f"í
N
Energie
Energy
Énergie
M o n a t l i c h e S t a t i s t i k e n
M o n t h l y s t a t i s t i c s
S t a t i s t i q u e s m e n s u e l l e s
DE
Eurostat hat den Auftrag, der
Europäischen Union
einen qualitativ hochwertigen statistischen Informationsdienst bereitzustellen.
E u r O S t a t - R e i h e n : ein an den Bedarf aller Nutzer angepaßtes Angebot.
Pressemitteilungen: Sie enthalten die Schlüsselzahlen zur EU, zu ihren Mitgliedstaaten und ihren Partnern. Die Pressemitteilungen werden kostenlos zur Verfügung gestellt. Unmittelbar nach ihrer Veröffentlichung sind sie auch im Internet zu finden:
wvwv.europa.eu.int/comm/eurostat/
Statistik kurzgefaßt: aktuelle Zusammenfassungen der wichtigsten Ergebnisse von statistischen Erhebungen, Studien und Analysen.
Schlüsselindikatoren: Diese Reihe enthält in einem handlichen Buch von maximal 100 Seiten die wichtigsten Indikatoren zu einem Themenbereich oder einem Teilbereich.
Panorama der Europäischen Union: In dieser Reihe geht
es um die Merkmale und Trends in multisektoralen Themenbereichen oder sektoralen Teilbereichen.
Methoden und Nomenklaturen: Diese Veröffentlichungen
richten sich an Fachleute; sie beschreiben die Methoden und Systematiken, die für einzelne Themen, Themenbereiche oder Sektoren verwendet werden.
Detaillierte Tabellen: Diese Veröffentlichungen richten sich an Fachleute; darin sind ein Teil oder die Gesamtheit der statistischen Angaben zu einem Thema, Themenbereich oder Sektor zu finden.
Studien und Forschung: Zusammenfassungen der Ergebnisse
von Studien und Forschungsarbeiten im Bereich cer europäischen Statistik.
Kataloge: Die kostenlosen Kataloge informieren rasch und genau über das Produkt- und Dienstleistungsangebot von Eurostat.
.Our mission is to provide the
European Union
with a high-quality statistical information service
EN
Eurostat'S Collections
are adapted to the needs of all users.
Press releases: key figures on the EU, the Member States and their partners. They are provided free of charge. They are also available on the Internet as soon as they are published: www.europa.eu.int/comm/eurostat/.
Statistics in focus: up-to-date summaries of the main results of statistical surveys, studies and analyses.
Key indicators: the main indicators on a theme or sub-theme in an easy-to-carry booklet.
Panorama of the European Union: highlights the features
and trends of a multi-sectoral theme or a sectoral sub-theme.
Methods and nomenclatures are intended for specialists who want to consult the methodologies and nomenclatures used for a theme, a sub-theme or a sector.
Detailed tables: statistical data for specialists compiled on a theme, sub-theme or sector.
Studies and research summarise the results of European
statistical studies and research and are intended for specialists.
Catalogues: free of charge rapid access to concise information on Eurostats products and services.
Notre mission est de fournir à
l'Union européenne
un service d'information statistique de qualité
Les collections d'EurOStat
sont une offre adaptée aux besoins de tous les utilisateurs.
FR
Communiqués de presse: les chiffres clés sur l'UE, les États membres et leurs partenaires. Ils sont distribués gratuitement et sont également disponibles sur Internet dès leur publication.
Méthodes et nomenclatures: les méthodologies et les
o
o
t^
Energie
Energy
Énergie
Monatliche Statistiken
Monthly statistics
A
DE
Τ
Unmittelbarer Zugriff auf harmonisierte statistische Daten
E u r o s t a t D a t a S h o p s :
J
bieten ein umfassendes Angebot an „maßgeschneiderten" Dienstleistungen:
* eine unmittelbare Bearbeitung von Informationsanfragen;
* eine garantiert schnelle und individuelle Antwort;
*· Wahl des Trägers, auf dem die statistischen Daten geliefert werden.
Informationen können telephonisch, schriftlich, per Fax oder per EMail angefragt werden.
Internet:
J
Die wesentlichen statistischen Nachrichten aus der Gemeinschaft
* EuroIndikatoren: über 100 harmonisierte, vergleichbare und kostenlose Indikatoren der Eurozone;
• Pressemitteilungen: direkter Zugriff auf alle Pressemitteilungen von Eurostat.
Weitere Informationen finden sich auf der InternetSite unter
www.europa.eu.int/comm/eurosta1/
immediate access to harmonized statistical data
EIU
E u r o s t a t D a t a S h o p s :
J
provide a wide range of tailor-made services:
* immediate information searches
* rapid and personalised response
* choice of data carrier
Information can be requested by phone, mail, fax or email.
I n t e r n e t :
J
Essentials on Community statistical news
• Euro indicators: more than 100 indicators on the eurozone; harmonized, comparable, and free of charge; *■ Press releases: direct access to all Eurostat press releases.
For further information, visit us on the Internet at:
www.europa.eu.int/comm/eurostat/
Accès immédiat à des données statistiques harmonisées
FR
E u r o s t a t D a t a S h o p s :
J
offrent un large éventail de prestations «sur mesure»:
* la prise en charge immédiate de toute recherche d'information,
* la garantie d'une réponse rapide et personnalisée,
•k le choix du support de fourniture des données.
Les informations peuvent être demandées par téléphone, par courrier, par télécopie ou par courrier électronique.
I n t e r n e t : )
l'essentiel de l'actualité statistique communautaire
* Euroindicateurs: plus de cent indicateurs sur la zone euro (harmonisés, comparables et disponibles gratuitement).
* Communiqués de presse: accès direct à tous les communiqués de presse d'Eurostat.
Pour plus d'informations, visitez le site Internet d'Eurostat:
www.europa.eu.int/comm/eurostat/
Zahlreiche weitere Informationen zur Europäischen Union sind verfügbar über Internet, Server Europa (http://europa.etJ.int). A great deal of additional information on the European Union is available on the Internet.
It can be accessed through the Europa server (http://europa.eu.int).
De nombreuses autres informations sur l'Union européenne sont disponibles sur Internet via le serveur Europa (http://europa.eu.int).
L2920 Luxembourg — Tél. (352) 43 011 — Télex COMEUR LU 3423
e u r O S t a t
Rue de la Loi 200, B1049 Bruxelles — Tél. (322) 299 11 11
D E Eurostat ist das Statistische
Τ
Amt der Europäischen
Gemeinschaften. Es hat den Auftrag,
die Union mit europäischen
Statistiken zu versorgen, die
Vergleiche zwischen Ländern und
Regionen ermöglichen. Eurostat
konsolidiert und harmonisiert die in
den Mitgliedstaaten erhobenen
Daten.
Um die weite Verbreitung der
gewaltigen verfügbaren Datenmenge
zu gewährleisten und den einzelnen
Nutzern zu helfen, diese
Informationen richtig zu verwenden,
hat Eurostat sein Veröffentlichungs
und Dienstleistungsprogramm
geschaffen. Um sich gezielt an das
breite Publikum oder an Fachleute
wenden zu können, wurden für die
einzelnen Nutzergruppen spezielle
Reihen entwickelt.
Im Rahmen des neuen Programms
hat Eurostat eine WebSite
entwickelt. Sie umfaßt ein breites
Angebot von OnlineInformationen
über die Erzeugnisse und
Dienstleistungen, Pressemitteilungen,
Kataloge, OnlineVeröffentlichungen
sowie Indikatoren für die Eurozone.
E M Eurostat is the Statistical Office
ψ
of the European Communities.
Its task is to provide the European
Union with statistics at a European
level, that allow comparisons to be
made between countries and
regions. Eurostat consolidates and
harmonizes the data collected by the
Member States.
To ensure that the vast quantity of
accessible data is made widely
available, and to help each user
make proper use of the information,
Eurostat has set up a publications
and services programme.
As part of the new programme
Eurostat has developed its website.
It includes a broad range of online
information on Eurostat products and
services, newsletters, catalogues,
online publications as well as
indicators on the eurozone.
Yves Franchet
Director-General
F R Eurostat est l'Office statistique
Τ
des Communautés
européennes. Il a pour tâche de
fournir à l'Union européenne des
statistiques au niveau européen,
qui permettent des comparaisons
entre pays et régions. Eurostat
consolide et harmonise les données
collectées par les États membres.
Pour assurer que l'ensemble des
données disponibles soit largement
accessible et pour aider chaque
utilisateur à faire bon usage de
toute cette information, Eurostat a
mis en place un programme de
publications et de services.
Dans le cadre du nouveau
programme, Eurostat a développé
son site Internet. Celuici comprend
toute une série d'informations
en ligne sur les produits et les
services d'Eurostat, ses bulletins
d'information, ses catalogues et ses
publications en ligne ainsi que des
indicateurs sur la zone euro.
Yves Franchet
Directeur-Général
Seite
1. - Kohle 7
2. - Kohlenwasserstoffe 27
3. - Elektrizität 77
4. - Gesamtenergie 95
5. - Verschiedenes 117
Energiebilanz-1998 (Jahreszahlen) 118
- Energiebilanz - (Jan. - Dez. 1999) 135
Klimatische Bedingungen 152
Preise : Durchschnittliche Einfuhrwerte - Tankerfrachtraten 154
TABLE OF CONTENTS
Page
1. - Coal 7
2. - Hydrocarbons 27
3. - Electrical energy 77
4. - All energy 95
5. - Miscellaneous 117
Energy balance-sheet - 1998 (annual data) 118
Energy balance-sheets (Jan. - Dec. 1999) 135
[image:7.595.54.549.52.719.2]Climate conditions 152
Prices : Average import values - Oil tanker freight rates 154
TABLE DE MATIERES
Page
1. - Charbon 7
2. - Hydrocarbures 27
3. - Energie électrique 77
4. - Total énergie 95
5. - Divers 117
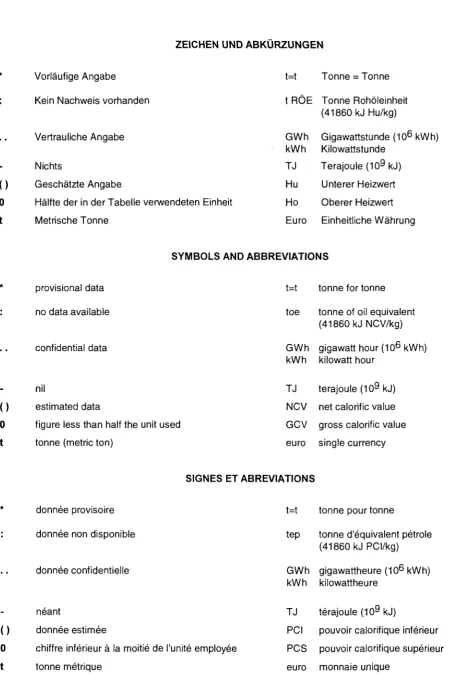
ZEICHEN UND ABKÜRZUNGEN
0
o
t
Vorläufige Angabe
Kein Nachweis vorhanden
Vertrauliche Angabe
Nichts
Geschätzte Angabe
Hälfte der in der Tabelle verwendeten Einheit
Metrische Tonne
t=t
Tonne = Tonne
t RÖE Tonne Rohöleinheit
(41860 kJ Hu/kg)
GWh Gigawattstunde(10
6kWh)
kWh Kilowattstunde
TJ Terajoule(10
9kJ)
Hu Unterer Heizwert
Ho Oberer Heizwert
Euro Einheitliche Währung
SYMBOLS AND ABBREVIATIONS
*
:
.
0
0
t
provisional data
no data available
confidential data
nil
[image:8.595.44.501.30.721.2]estimated data
figure less than half the unit used
tonne (metric ton)
t=t tonne for tonne
toe tonne of oil equivalent
(41860 kJNCV/kg)
GWh gigawatt hour (10
6kWh)
kWh kilowatt hour
TJ terajoule(10
9kJ)
NCV net calorific value
GCV gross calorific value
euro single currency
SIGNES ET ABREVIATIONS
O
donnée provisoire
donnée non disponible
donnée confidentielle
néant
donnée estimée
t=t tonne pour tonne
tep tonne d'équivalent pétrole
(41860 kJ PCI/kg)
GWh gigawattheure(10
6kWh)
kWh kilowattheure
TJ térajoule(10
9kJ)
1
KOHLE/ERLÄUTERUNGEN
Die Angaben sind in 1 000 metrischen Tonnen aufgeführt, auf der Basis Tonne-für-Tonne (1 0001 = t).
Deutschland
Spanien
Vereinigtes
Königreich
Förderung
Lieferungen
Kokereien
Die außerhalb der Zechen bzw. Kokereien gelagerten Bestände (nationale
Stein-kohlenreserven) der Steinkohlen- bzw. Kokserzeuger sind auch in den erfaßten
Beständen enthalten.
Ab 1. Januar 1987 umfassen die Daten über die Steinkohle auch die alte
Braun-kohle (lignito negro).
Alle monatlichen Angaben, mit Ausnahme derjenigen für den Außenhandel,
beziehen sich auf Zeiträume von vier bis fünf Wochen (vier Wochen für die beiden
ersten Monate eines Quartals, fünf Wochen für den letzten Monat eines Quartals).
Die Förderung umfaßt auch die Kohleförderung der Kleinzechen und
Tagebaubetriebe.
Die „Lieferungen an Kraftwerke" umfassen die Lieferungen an die
Elektrizitätswerke der öffentlichen Versorgung, jedoch nicht Lieferungen an
zecheneigene Kraftwerke. Für die Bundesrepublik Deutschland sind auch die
Lieferungen an die Bergbauverbundkraftwerke und an die Kraftwerke der
Bundes-bahn ausgeschlossen. Die Steinkohlenlieferungen an die Industriekraftwerke
(Eigenerzeuger) sind in den "Lieferungen an Industrie insgesamt" enthalten.
Alle Angaben über die Kokereien (Steinkohlenlieferungen, Bestände usw.)
beziehen sich auf sämtliche Kokereien (d.h. die zechen- und hütteneigenen, sowie
auf die unabhängigen Kokereien).
In der Erzeugung von Hüttenkoks ist auch Steinkohlenschwelkoks, nicht jedoch
Braunkohlenkoks enthalten.
Außenhandel
Die veröffentlichten Daten sind Meldungen der Importeure und Exporteure
ent-nommen. Sie können daher von den Angaben abweichen, die von den
Zollbehörden erfaßt und in der Außenhandelsstatistik veröffentlicht werden.
The data are expressed in 1 000 metric tonnes on a tonne = tonne basis (1 000 t=t).
Germany
The stocks held by coal/coke producers outside the mines/coking plants (Nationale
Steinkohlenreserve) are also included
Spain
As from January 1987 black lignite (lignito negro) is included in the data concerning
hard coal.
United Kingdom
All the monthly data, except those for external trade, refer to periods of four or five
weeks (four weeks for the first two months of each quarter and five for the last).
Production
Coal production includes that of small and open-cast mines.
Deliveries
"Deliveries to power stations" comprise the quantities delivered to public supply
power stations but do not include deliveries to pithead power stations. For Germany,
deliveries to the "Bergbauverbundkraftwerke" and the Federal Railway power
stations are also not included. Supplies of coal to autoproducer power stations are
included in the tables "deliveries to all industries".
Coking plants
All the data on coking plants (deliveries of coal, stocks, etc.) refer to all coking plants
(i.e. those operated by mines and steelworks and those run independently).
The production of hard coke also includes semi-coke. Brown-coal coke is not
included.
External trade
Where the data published are taken from the declarations made by importers and
exporters, they may differ from the data recorded by the customs services and
published in the external trade statistics.
CHARBON / NOTES EXPLICATIVES
Les données sont exprimées en tonnes métriques, établies sur une comptabilisation tonne = tonne (1000 t=t)
Allemagne
Les stocks des producteurs de houille/coke existant hors des mines/cokeries
(Nationale Steinkohlenreserve) sont également inclus.
Espagne
À partir de janvier 1987, les données concernant la houille comprennent le lignite
ancien (lignito negro).
Royaume-Uni
Toutes les données mensuelles, sauf celles du commerce extérieur, se réfèrent à
des périodes de quatre ou cinq semaines (quatre semaines pour les deux premiers
mois de chaque trimestre, cinq pour le dernier).
Production
La production de charbon comprend celles des petites mines et des mines à ciel
ouvert.
Livraisons
Les "livraisons aux centrales électriques" couvrent les quantités livrées aux
centrales électriques des réseaux publics, mais non pas celles livrées aux centrales
thermiques des mines. Concernant l'Allemagne, les livraisons aux
"Bergbauverbundkraftwerke" et aux centrales des chemins de fer fédéraux ne sont
pas comprises non plus. L'approvisionnement en houille des autoproducteurs
industriels est inclus dans les tableaux "Livraisons à l'ensemble de l'industrie".
Cokeries
Commerce
extérieur
Toutes les données concernant les cokeries (livraisons de houille, stocks, etc.) se
réfèrent à l'ensemble des cokeries (minières, sidérurgiques et indépendantes).
La production de coke de four comprend également le semi-coke de houille. Le
coke de lignite est exclu.
Les données publiées proviennent des déclarations des importateurs et exportateurs,
elles peuvent donc différer des données relevées par les services douaniers et
publiées dans les "Statistiques du commerce extérieur".
700 -ι
600
500
400
300
-200
100
-STEINKOHLE
HARD COAL
HOUILLE
eurostat
KOHLE
COAL
STEINKOHLE
10001 (t=t)
Förderung
1998 01-12 1999 01-12 199812 1999 01 1999 02 1999 03 199912 2000 01 2000 02 2000 03 1999 01 · 2000 0 1 ·
03 03 2 0 0 0 / 1 9 9 9 %
Gesamtbestände bei den Zechen
EU15
106 504 99 698 8 716 7 723 8 549 10 054 7 874
26 326
EUR11
66 459 63 315 4 936 5368 5 359 6083 4 8 4 8
16 810
DK EL
199812 199912 1998 12 1999 01 1999 02 1999 03 1999 12 2000 01 2000 02 2000 03
Gesamteinfuhren
1998 01-12 1999 01-12 1998 09 199810 1998 11 199812 1999 09 199910 199911 1999 12
14 779 15 269 14 779 14 043 13 866 14 141 15 269
10 214 10 293 10 214 9 608 9 279 9 458 10 293
1998 01 ■ 1999 01 ■
12 12 1 9 9 9 / 1 9 9 8 %
150 943 153 316 12 716 13 127 15 619 13 381 11 152 11 681 14 173 13 032
150 943 153 316
117 722 121 839 10 132 9 9 6 8 11 788 10566
8 561 9 242 11 359 9 613 117 722 121 839
1.6 3.5
Innergemeinschaftliche Einfuhren (EU-15)
1998 0 1 - 1 2 1999 0 1 - 1 2 1998 09 1998 10 1998 11 199812 1999 09 199910 1999 11 1999 12 1998 01 - 12 1999 01 - 12
3 092 2 860 185 473 652 259
190 106
171
187
3092 2 860
2 816 2 515 141
454 618 213 140 85
141
145
2 816 2 515
12 632 10 848 961
868
958 1 329 719
691
1 399 998 12 632 10 848 -14.1
262 214
27 24 17 20 24 13 10 11
262 214
8 071 7 115
577 745 612 647 487 580 491 423
8 071 7 115 -11.8
45 340 43 849 3504 3 758 3683 4343 3404 3 325 3 291 3 561 11 784 10 177
-13.6
8 565 8 601 8 565 8 021 7 801 8063 8 601 8 078 7483 7 134
23 619 23 584 2 108 2 915 2 592 2 237 1 452 2 167 2 129 1 715 23 619 23 584 -0.1
1 554 1 714
33 341 508 107 82 33
75
73
1 554 1 714
883 821
79 81 78 79 68 65 63 61
883 821
-7.0
16 380 15433 1 097 1 210 1 291 1 349 1 090
3 850
927 876
927 868 831 770 876
14 546 20 081 1 340 1 413 1 573 1 065 1 341 1 338 2 118 1 619 14 546 20 081 38.1
F | IRL
HARD COAL
10001 (t=t)
Production
4 739 4033
335 400
385 391 354
1 176
Total colliery stocks 697
803 697 695 624 601 803
Total
3 156 5434 1 117
854 862
1 458 1 181 1 021 1 291 1 193 3 156 5434
25
13
25 24 23 24
13 11 9 10
imports
2 345 2 8 0 0 141 112
424
121
250 260 255 247
2 345 2 8 0 0
17.3 19.4
Intra-community imports (EU-15) 234
200
20 14 23 22 7 14 14
24 234 200
504
224 42 62 61 42 19 18
ι
16 566 17 194 1 407 1 393 1 219 1 741 1 570 1 319 1 235 1 474 16 566 17 194 3.8
2 1
-2
L
153 151 18 9 14 20 5 16 21 13 153 151 -1.3
61 62 6 5 4 5 5 6 6 5 61 62
NL
21 507 19 657 1 907 1 175 2 691 1 559 1 039 924 1 590 1 202 21 507 19 657 -8.6
195 88 10 8 5 17 3 1 14 6 195 88
A
3 458 3 732 329 308 312 208 370 365 293 192 3 458 3 732 7.9
-—
Ρ
5 052 6 042 306 390 674 517 433 833 702 682 5 052 6 042 19.6
-—
FIN
4 688 2 316 498 531 469 311 201 308 326 278 4 6 8 8 2 316 -50.6
4 13 2
-4 13
S
3 035 2 921 175 427 559 297 265 385 524 138 3 035 2 921 -3.8
UK
40 045 36 383 3 780 2 355 3 190 3 971 3 026 1 729 2 592 9 516
NO
HOUILLE 10001 (t=t) Production
1998 0 1 - 1 2 1999 0 1 - 1 2 1 9 9 8 1 2 1999 01 1999 02 1999 03 1 9 9 9 1 2 2 0 0 0 01 2000 02 2000 03 1999 0 1 - 03 2000 01 - 03 2 0 0 0 / 1 9 9 9 %
Stocks totaux auprès des mines
4 565 4 976 4 565 4 435 4 587 4 6 8 3 4 976 4 104 3 571
21 232 20 620 1 753 1 906 2 582 1 792 1 771 1 409 1 736 2 797 21 232 20 620 -2.9
1998 12 1 9 9 9 1 2 1 9 9 8 1 2 1999 01 1999 02 1999 03 1 9 9 9 1 2 2000 01 2000 02 2000 03
Importations totales
1998 0 1 - 1 2 1999 0 1 - 1 2 1998 09 1 9 9 8 1 0 1 9 9 8 1 1 1 9 9 8 1 2 1999 09 1999 10 1999 11 1999 12 1998 01 - 12 1999 01 - 12 1 9 9 9 / 1 9 9 8 %
Importations intra-communautaires (EU-15)
27 14 2 2 3 4 1 27 14
248 328 43 17 32 43 43 21 29 42 248 328
~m
eurostat
KOHLE
COAL
EU-15 EUR-11 B
STEINKOHLE
10001 (t=t)
Außergemeinschaftliche Einfuhren (EU-15) 1998 0 1 - 1 2
1999 0 1 - 1 2 1998 09 1 9 9 8 1 0 199811 1 9 9 8 1 2 1999 09 1 9 9 9 1 0 199911 1 9 9 9 1 2 1998 01 - 12 1999 0 1 - 12
Einfuhren aus dei 1998 0 1 - 1 2
1999 0 1 - 1 2 199811 1 9 9 8 1 2 1999 01 1999 02 1999 11 1999 12 2000 01 2000 02 1999 01 - 02 2000 01 - 02
Einfuhren aus Au 1998 0 1 - 1 2
1999 0 1 - 1 2 199811 1 9 9 8 1 2 1999 01 1999 02 1999 11 1999 12 2000 01 2000 02 1999 01 - 02 2000 01 - 02
Einfuhren aus Sü 1998 0 1 - 1 2
1999 0 1 - 1 2 1998 09 1998 10 1998 11 1 9 9 8 1 2 1999 09 1 9 9 9 1 0 199911 1 9 9 9 1 2 1998 01 - 12 1999 01 - 12
147 851 150 456 12 531 12 654 14 967 13 122 10 962 11 575 14 002 12 845 147 851 150 456 ) U.S.A. 23 283 19 740 2 071 1 687 1 788 1 833 1 799 1 548 3 621 stralien 20 313 24 566 2 577 1 981 1 891 2 395 2 431 1 350 4 286 dafrika 31 992 32 463 2 850 2 449 2 878 2 836 2 615 1 686 3 160 2 821 31 992 32 463 114 906 119 324 9 991 9 514 11 170 10353 8 421 9 157 11 218 9468 114 906 119 324 20 083 16 738 1 803 1 445 1 642 1 604 1 479 1 258 3 246 15 015 18 389 1 947 1 594 1 293 1 826 1 815 995 3 119 28 427 30 236 2 662 2044 2 618 2 626 2 495 1 649 2834 2600 28 427 30 236 12 370 10 634 934 844 941 1 309 695 678 1 389 987 12 370 10 634 2 477 2008 115 252 262 94 277 31 356 3 708 3536 352 282 53 446 452 346 499 4088 3 074 266 250 278 444 280 89 301 468 4088 3 074 DK 8 070 7 112 576 745 612 647 484 580 491 423 8 070 7 112 573 -446 1 056 156 265 151 -416 2900 1 477 143 360 211 164 86 241 131 2900 1 477 D 22 065 21 870 2 075 2 574 2084 2 130 1 370 2 134 2 054 1 642 22 065 21 870 838 904 50 84 112 364 1 1 74 476 75 1 860 1 847 231 432 201 309 91 136 143 210 510 353 5 440 4 718 589 410 433 342 215 290 546 363 5440 4 718
EL E F IRL
HARD COAL
10001 (t=t)
Extra-community imports (EU-15) 883 821 79 81 78 79 68 65 63 61 883 821 _ -_ -488 371 36 38 41 35 26 29 30 32 488 371 14 312 19 881 1 320 1 399 1 550 1 043 1 334 1 324 2 104 1 595 14 312 19 881 12 652 15 210 1 075 792 801 1 416 1 162 1 003 1 269 1 167 12 652 15 210 2345 2800 141 112 424 121 250 260 255 247 2 345 2800
Imports from the U.S.A. 2966 2 354 373 34 179 286 147 219 465 3333 3 072 288 442 175 331 281 203 506 1025 1 250 121 121 115 107 111 113 108 100 222 208
Imports from Australia 1 241 2 255 164 67 159 307 226 2 457 3 811 231 193 327 258 226 256 585 162 162
CHARBON
NL FIN UK NO
HOUILLE 10001 (t=t) Importations extra-communautaires (EU-15) 16 564
17 194 1 406 1 393 1 219 1 741 1 570 1 319 1 235 1 474 16 564 17 194
4 824 3 655 314 261 415 152 291 384
567
3080 3 195 309 358 224 315 340 241
539
3 946 3 784 265 434 262 564 548 288 166 310 3946 3 784
92 89 12 4 10 15
-10 15 8 92 89
92 89 12 4 10 15
-10 15 8 92 89
21 312 19 569 1 897 1 167 2686 1 542 1 036 923 1 576 1 196 21 312 19 569
3 589 2 653 474 251 251 223 201 248
474
2 270 3 127 425 165 298 339 399 16
637
5 126 4 797 639 181 456 439 386 50 387 231 5 126 4 797
3 458 3 732 329 308 312 208 370 365 293 192 3 458 3 732
-5 0-52 6 042 306 390 674 517 433 833 702 682 5 052 6 042
667 842
-133
47 171 59 58 40 180 98
237 618 237
-123
-123
1 755 1 680 152
-325 37 255 145 221 208 1 755 1 680
4684 2 303 496 531 469 311 201 308 326 278 4684 2303
364
-68
-99 64
-99
-64
-99 64
3008 2 907
175 425 557 294 261 385 523 138 3008 2 907
801 547 209 128
-120
68
850 1 011 142 68
-69 202
69
20 984 20 292 1 710 1 889 2 550 1 749 1 728 1 388 1 707 2 755 20 984 20 292
Import 1 826 2 455 59 114 146 229 200 222 205 207 375 412
Importi 4 002 4 110 332 319 333 349 414 355 404 313 582 717
Importations
~
-_
-_
-177 379 9 7 8 11 8 8 55 58 177 379
1998 01-12 1999 01-12 1998 09 199810 199811 199812 1999 09 1999 10 199911 1999 12 1998 0 1 - 12 1999 01 - 12
Importations en provenance des U.S.A.
1998 01-12 1999 01-12 1998 11 1998 12 1999 01 1999 02 1999 11 1999 12 2000 01 2000 02 1999 01 - 02 2000 01 - 02
Importations en provenance d'Australie
1998 01-12 1999 01-12 199811 199812 1999 01 1999 02 1999 11 1999 12 2000 01 2000 02 1999 01 - 02 2000 01 - 02
1998 1999 01-1998 09 199810 1998 11 199812 1999 09 1999 10 199911 199912 1998 011999 01
10
eurostat
KOHLE
COAL
EU-15 EUR-11 DK EL 1RL
STEINKOHLE
1000 t
Einfuhren aus Polen
1998 0 1 - 1 2 16 127
1999 01-12 15 293
1998 11 1 770
1 9 9 8 1 2 1608 1999 01 1079 1999 02 1322 1999 11 1 193
1 9 9 9 1 2 1318
2000 01 2000 02
1999 0 1 - 02
2000 01 - 02
Einfuhren aus der GUS
1998 0 1 - 1 2 2 539 1999 0 1 - 1 2 6 234
1998 09 203 1 9 9 8 1 0 255 199811 364 1 9 9 8 1 2 276 1999 09 585 1 9 9 9 1 0 641 1999 11 616 1 9 9 9 1 2 704 1998 01 - 12 2 539
1999 01 - 12 6 234
Einfuhren aus Kanada
1998 0 1 - 1 2 3 599
1999 01-12 4 075
1998 11 200 1998 12 511
1999 01 248 1999 02 237 199911 372 199912 360 2000 01
2000 02 1999 01 - 02 2000 01 - 02
Einfuhren aus Kolumbien
1998 0 1 - 1 2 1999 0 1 - 1 2 1998 11 1 9 9 8 1 2 1999 01 1999 02
199911
1999 12 2 0 0 0 0 1 2000 02 1999 01 - 02
2000 01 - 02
13 741 15 327
789 1 285 1 520 1 304 1 594 1 271
2 824
12 056 11 315 1 441 1 224 751 921
906 1 007
1 672
1 847 4 926 145 185 252 158 462 523 512 578 1 847 4 926
3063 3 725 158 459 193 198 341 341
391
11 982 13 467
756 1 093 1 321 1 238 1 536 1 240
2 559
29 65 72
67
426 484
18 50 47 30 47 46 50 105 426 484
411 606
128 53
191 12
372 93
1 82 5 3
2 679 2 641 186 285 201 194 209 205 150 205
395 355
221 835
29 59 66 93 80 41 87 221 835
1 249 1 243
131 131
104
131 104
3 703 5 147 596 379 254 372
424 461 247 258
626 505
5 175
35 5 20 14 5 175
219 439 16 98 22 45 7 22
67
2 109 2 540
115 120 296 405
200 108 125 218 701 343
118 121 10 9 11 8 10 10 10 10 118 121
116
120 1 185
59 39 105 104 125 131 120 1 185
236 564
59
58
59
HARD COAL
1000 t
Imports from Poland
220 541
-116 68 4
1 304 689 56 125 124 33 61 59
Imports from the CIS
106 255 10 7 4 6
40 41 39 48 106 255
Imports from Canada
446 558 9 75 25 17 66 61
42
Imports from Colombia
421 740 39
-130
-290 140
130
1 396 1 756 111 168 164 233 106 151
397
858 1 472
CHARBON
NL FIN UK NO
104 564
52
120
52
HOUILLE
1000
t
Importations en provenance de Pologne 1 983
1 384 394 342 62 55 89 125
1 625 1 717 158
99 139 158 133 92
117 297
2640 829
237 250 107 63
64 146 107 200
170 307
785 894 80 71 96 169
39 64
265
607 443 63 28 31 38 39 42 37 38 69 75
1998 01-12 199901-12
1998 11 199812 1999 01 1999 02 199911 199912 2000 01 2000 02 1999 01- 02 2000 01 - 02 Importations en provenance de la CEI 126
884 10
-39 9 56 112 71 74 126 884
867 1 067
-112 87 85 71 125
172
2343 1 362 210 196 157 110 119 161
267
243 360 19 45 38 8
-76 74 243 360
633 319 5 67
-51 6 63
51
2 590 3094
280 101 261 169 358 138
430
_
172
-172
-—
_
81
-52
-81
230 172
-54
-1 605 2 410
-426 160 158 310 415 267 282 318 549
821 1 330
88 83 65 61 179 163 131 132 821 1 330
21
-288
-~
178 184 22 10 16 27 13 20 42 6 178 184
175 168 26 22 26 17 7 8 11 23 175 168
1998 0 1 - 1 2 1999 0 1 - 1 2 1998 09 1998 10 1998 11 1998 12 1999 09 1 9 9 9 1 0 1999 11 1999 12 1998 01 - 12 1999 01 - 12
Importations en provenance du Canada 536
350 42 52 55 39 31 19 13 22 94 35
Importations en provena
-510 617 33 61 68 66 58 31 55 58 134 113
1998 0 1 - 1 2 1999 0 1 - 1 2 1998 11 1998 12 1999 01 1999 02 199911 1 9 9 9 1 2 2000 01 2000 02 1999 01 - 02 2000 01 - 02
nce de la Colombie 1998 0 1 - 1 2
Wà
eurostat
KOHLE
COAL
EU15 EUR11 DK EL IRL
STEINKOHLE
10001 (t=t)
Einfuhren aus China
1998 0 1 - 1 2 1 9 9 9 0 1 - 1 2
1998 11 199812 199901 1999 02 1999 11 199912 2000 01 2000 02 1999 0 1 - 02 2000 01 - 02
Gesamtausfuhren 1998 01-12 1999 01-12 199812 1999 01 1999 02 1999 03 199912 2000 01 2000 02 2000 03
1 307 1 600 121 101 398 34 47 26
1 307 1 476
121 101 274 34 47 26 58 226 4 8 18 5 1999 01 2000 01 ■
03 03
2 0 0 0 / 1 9 9 9 %
Gesamtinlandslieferungen
1998 0 1 - 1 2
1999 01-12
1998 09 1 9 9 8 1 0
1998 11 199812 1999 09 199910 199911 199912 1998 01- 12 1999 01- 12
1 9 9 9 / 1 9 9 8 %
265 385 241 211 21 544 22 823 22 910 23 649 20 185 19 821 20 682 20 889 265 385 241 211
189 176 175 942 15 095 16 463 16088 16 265 14 231 14 883 15 113 14 211 189 176 175 942 -9.1
Lieferungen an öffentliche Kraftwerke
1998 0 1 1 9 9 9 0 1
-1998 11 199812 1999 01 1999 02 199911 199912 2000 01 2000 02 1999 01- 02
165 318 157 808 14 872 15 273 13 935 15 561 14 228 14 111
111 096 110 289 9 846 10 070 10 158 10 741 10 187 9 388
29 496 20 899
11 086 9 897
793 915 905 888 757 853 879 951
11 086 9 897 -10.7
4 932 3 682 400 400 364 414 348 411 778
HARD COAL
10001 (t=t)Imports from China
124 124 5 34 5 5 10 12 615 611 24 23 112 24 15 20 432
7 628 9 017 1 062 786
682 638 741
2 106
308
6 499 8 066
922 676 575 549 651
1 800
8
1 294 1 155
87 81 89 75 166 245 124 170 192 32 38 11 21 21 22 21 26 70 69 15 12 295 252 18 23 10 14 13 12 12 3 47 27 15 30 1 5 4 2 2 2 1 1 11 4 6 6 6 136
Total exports
75 79 8 6 6 5 7 17 19 15 1 2 1 1 2 1 1 4 2
9 173 7 804
680 654 831 906 612 717 691 871
9 173 7804
-14.9
8 772 7 466
780 860 844 757 656 835 745 633 1 601 75 503 65 311
5 924 6 651 6 155 6 469 5 065 6 215 5 676 6 028 75 503 65 311 -13.5
44 938 42 026 3 766 3 955 4 005 4 286 4 256 4 409 3 422 3 561 8 291
-63.6
1 626 1 382
125 124 126 124 112 113 112 111 1 626 1 382 -15.0
30 755 34 681
2 704 3 011 2444 2 373 2 8 8 0 2 657 3 259 1 693 30 755 34 681 12.8
-50.0
Total inland deliveries 2 476 1 839 214 232 171 191 138 127 127 122 2 476 1 839 -25.7
25 076 21 946 1 688 1 931 2 242 2 435 1 636 1 564 1 965 1 841 25 076 21 946
-12.5
Deliveries to public power stations
36 36 3 3 3 3 3 3 3 3
25 395 29 083 2 156 2 148 2 307 2 662 2 787 1 315
4 969
8 798 9 6 3 8
972
1 156
942
1 012 986 911
1 954
CHARBON
NL FIN UK NO
574 528
53 69 149
149
-0.6
8048 8 310
809 658 726 772
511 712
1 498
-1.3
55 77 44
14
4 816 6 559 808 558 469 454
463
-22.4
HOUILLE
10001 (t=t)
Importations en provenance de la Chine
944 729 107 67 92 66 67 68 61
225
17 068 16 972 1 467 1 628 1 523 1 398 1 394 1 383 1 222 1 456 17 068 16 972
153 151 18 9 14 20 5 16 21 13 153 151
14 861 11 528
1 424 976 1 436 1 300 1 020 1 012 716 915 14 861 11 528
3 458 3 733 329 308 312 208 370 364 294 193 3 458 3 733
5 046 6 099 382 498 495 534 706 337 572 565 5 046 6099
3 694 3 785 152 304 391 449 260 355 382 434 3 694 3 785
3 128 2 980 198 539 621 454 263 498 502 254 3 128 2 980
62 282 53 103 5446 5043 5 244 5900 4 967 3 610 4 264 5 442 62 282 53 103
1998 01-12 1999 01-12 1998 11 199812 1999 01 1999 02 199911 199912
2000 01 2000 02 1999 01 - 02 2000 01-02
Exportations totales
1998 01-12 1999 01-12 199812 1999 01 1999 02 1999 03 199912
2000 01 2000 02 2000 03
1999 01 - 03
2000 0 1 - 0 3
2 0 0 0 / 1 9 9 9 %
Livraisons intérieures totales
1998 01-12 1999 01-12
1998 09 1 9 9 8 1 0 1998 11 199812 1999 09 1999 10 199911 199912 1998 01· 1999 01 12 12
1 9 9 9 / 1 9 9 8 %
Livraisons aux centrales électriques publiques 9 295
7 194 812 777 753 659 419 670
1 412
1 132 1 300 97 49 85 103 65 38
188
4 148 5 152 417 437 434 371 449 482 483 413 805 896
2 120 2 186 259 310 351 328 248 326 328 306 679 634
529 612 59 59 58 57 40 41
115
44 885 39 405 4 184 4 281 2 872 4 003 3 342 3844 3 335 3 892 6 875 7 227
1998 01-12 1999 01-12
\=¥A
eurostat
KOHLE
EU-15 EUR-11
STEINKOHLE
10001 (t=t)Lieferungen an Zechenkraftwerke 1998 0 1 - 1 2
1999 0 1 - 1 2 1 9 9 8 1 2 1999 01 1999 02 1999 03 1 9 9 9 1 2 2000 01 2000 02 2000 03 1999 0 1 - 03 2000 01 - 03 2 0 0 0 / 1 9 9 9 %
Lieferungen an Kt 1998 0 1 - 1 2
1999 0 1 - 1 2 199811 1998 12 1999 01 1999 02 199911 1 9 9 9 1 2 2000 01 2000 02 1999 01 - 02 2000 0 1 - 0 2 2 0 0 0 / 1 9 9 9 % Lieferungen an Bi 1998 0 1 - 1 2
1999 0 1 - 1 2 1998 12 1999 01 1999 02 1 9 9 9 0 3 1999 12 2000 01 2000 02 2000 03 1999 01 - 03 2000 01 - 03 2 0 0 0 / 1 9 9 9 %
Lieferungen an In 1 9 9 8 0 1 - 1 2
1999 0 1 - 1 2 1998 09 1998 10 199811 1 9 9 8 1 2 1999 09 1 9 9 9 1 0 1999 11
11 548 6 757 1 036 870 823 693 116
2386
jkereien 58 913 48 368 4 473 4 803 3908 4 111 3665 3 933
8 019
11 548 6 757 1 036 870 823 693 116
2386
47 044 38 416 3 607 3 687 3 329 3 305 2 822 2860
6634
ikettfabriken 978 967 107 97 81 74 112
252
335 317 31 37 18 21 30
76
dustrie insgesamt 24 385
23 869 1 886 2 233 2 173 1 950 1 902 1 946 2 230
16 583 18 132 1 249 1 510 1 452 1 202 1 403 1 519 1 701
B
-3 876 3 850 313 327 327 291 315 328
618
12 6 2 1
1 1
2
1 957 2 079 170 159 166 129 131 139 189
DK
401 338 31 55 51 46 31 38 35
D
7 590 4 740 740 517 468 561
-1 546
-100.0
16 213 10 338 1 115 1 346 913 986 523 804 1 026
870 1 899 1 896 -0.2
173 163 15 20 9 9 13 14 11 11 38 36 -5.3
5 669 7 230 278 598 524 342 559 688 743
EL E
COAL
F IRL
HARD COAL
10001 (t=t) Deliveries to pithead power stations3958 2 017
296 353 355 132 116
840
Deliveries to coking plants 3 813
4 027 152 122 275 338 319 262
613
6946 5 291 514 502 535 497 401 376
1 032
Deliveries to patent fuel/B KB plants
1 590 1 346 122 121 123 121 109 110 109
-150 148 14 16 9 11 16
36
Deliveries to all industries 1 370
1 420 175 104 126 83 141 87 140
NL FIN UK NO
8404 7 955
666 697 680 595 655 685
1 275
7.8 1.0
HOUILLE 10001 (t=t) Livraisons aux centrales électriques minières
3 981 3 067 508 397 283 277 218 142
560
2 072 2 107 199 147 169 181 195 144
350
459 543 37 41 40 37 92 42 43 40 77 83
1 280 1 238 103 108 107 103 104 77 109 103 210 212
1 709 1 681 412 243
-69 370 121
69
10 160 8 271 454 873 579 737 473 952 604 749 1 316 1 353
1998 01-12 199901-12
199812 1999 01 1999 02 1999 03 1999 12 2000 01 2000 02 200003 1999 0 1 - 03 2000 01 - 03
2000/1999%
Livraisons aux cokeries
1998 01-12 199901-12 199811 199812
1999 01 1999 02 1999 11 199912 2000 01 2000 02
2.8
1999 01 ■ 2000 01 ■
02 02
2000/1999%
Livraisons aux fabriques d'agglomérés/briquettes
643 650 76 60 63 53 82 47 33 176
1998 0 1 1999 0 1 -199812 1999 01 1999 02 1999 03
1999 12
2000 01 2000 02 2000 03 1999 01-2000 01
-03 03
2000/1999%
Livraisons à l'ensemble de l'industrie
616 707 54 55 48 43 53 49 56 59
153 151 18 9 14 20 5 16 21 13
1 585 1 267 147 137 116 126 102 107 79 103
189 246 25 19 5 7 39 42 24 5
439 404 40 37 41 56 25 59 31 41
294 361
-49 29 31 30 31 30 31
843 629 49 143 143 145 54 87 87 87
4 9 6 8 3 424 435 404 404 436 305 192 298 380
rafl
eurostatKOHLE
COAL
EU-15 EUR-11 DK EL IRL
STEINKOHLE
10001 (t=i)
Sonstige Lieferungen
1998 01-12 1999 01-12 199812 1999 01 1999 02 1999 03 1999 12 2000 01 2000 02 2000 03 1999 01 2000 01
03 03
4 243 3 442 480 324 363 321
2 570 2 031 239 175 192 156
309 280 30 18 21 18
400
1 008
2 0 0 0 / 1 9 9 9 %
STEINKOHLENKOKS
1000 t
Produktion der Kokereien
1998 0 1 - 1 2 39 672 1999 0 1 - 1 2 36 320 1998 11 3 105 1998 12 3 221 1999 01 3 103 1999 02 2 846 1999 11 2 942 1999 12 3 098
2000 01 2000 02 1999 01 - 02
2000 0 1 - 0 2 2 0 0 0 / 1 9 9 9 %
Bestände bei den Kokereien
199812 199912 199812 1999 01 1999 02 1999 03
1999 12 2000 01 2000 02 2000 03
Gesamteinfuhren
1998 01-12 1999 01-12
1998 09 1 9 9 8 1 0 199811 1 9 9 8 1 2 1999 09 1 9 9 9 1 0 199911 1 9 9 9 1 2
3 989 3630 3 989 4 157 4 117 3999
3630
10 218 8 769
926
980 1 051
628
701 806 847 929
211
523
32 305 29 196 2 551 2 547 2 571 2 323
2 381 2 416
4 894
3 040 2 928 3040 3 198 3 243 3 205 2 928
8 927 7 971
774 911 897 578 629 727 813 804
8 927
27
57
3 042 3 138
257 256 262 237
254 269
499
260 296
260 261 244 239
296
965
914 58 81 69 76 78 77 31 80
965
47 48
9 2 5 5
2 6
920 814 71 31 53 66
116 25 24
163 150 212
41.3
10 277 8568
776 777 765 679
661 701 743 729 1 444 1 472 1.9
1 552 1 572 1 552 1 612 1 671 1 700 1 572 1 576 1 586 1 615
3 701
4 142
384 415 245 237 328 312 507 442
40 40 3 4 3 4 3 3 3 2
HARD COAL
10001 (t=t)
Miscellaneous deliveries
177 151 20 17 18 16
1 099 706
113 103 97 55
13 49
HARD COKE
1000 t
Production of coking plants
2 649 2 320 183 185 183 165 212 223
5 367 4 941 453 455 468 423 409 401
348 891
Stocks at coking plants
209 195 209 238 230 203
195
143 259 143 155 163 122
Total imports
86
119
1 7 5 7 7 14
11 11
2 128 1 157
185 284 429
86 53 105
121
123
NL FIN UK NO
5 203 4 988 416 410 430 377 407 414
807
514 430 514 588 604 620 430
508 249 38 20 54 93
29
86 3 2 506 249 -51.0
2 903 2384
228 220 219 221
200 172
440
65 80 5 6 3 1
1 600 1 596 133 138 138 125 132 129
263
352 361
29 29 29 27
31 30 32 30
56 62
10.7
912 900 76 77 77 69 75 77 76 73
146 149
47 58 7 12 11
11
34
1 151 1 148 94 99 98 87
94 98
185
1 626 1 353 234 137 160 154 184 105 113
451
6 216 5 976 460 575 434 436 467 584 467 471
870 938 7.8
285 132 285 276 269 257 132
493 577 38 30 38 29 51 61 35 84
493 577
872 590 57 52 43 30 63 51 41 41 872 590
77 44 77 68 62 64
44 26 20 28
-174 136 13 22 14 20 12 11 5 12 174 136
184 130 184 214 191 175 130
373 345 105 10 25 18 14 26 23 67 373 345
762 569 762 742 680 616
569 424 471
831 365 35 53 121 23 50 46 6 50 831 365
HOUILLE 10001 (t=t) Livraisons divers
1998 01-12 1999 01-12
1998 12 1999 01 1999 02 1999 03
1999 12 2000 01 2000 02 2000 03
1999 01 · 2000 01·
03 03
2000/1999%
COKE DE FOUR
1000
t
Production des cokeries
1998 01-12 199901-12
1998 11 1998 12 1999 01 1999 02 1999 11 1999 12 2000 01 2000 02 1999 01 ■ 2000 01 ■
02 02
2000/1999%
Stocks auprès des cokeries
199812 199912
17.0 -32.3 -21.8 -7.5 -56.1
199812 1999 01 1999 02 1999 03
1999 12
2000 01 2000 02 2000 03
Importations totales
1998 01-12 199901-12
1998 09 199810 199811 199812
1999 09 199910 199911 199912
1998 0 1 - 12 1999 0 1 - 12
sa
eurostat
KOHLE
COAL
EU-15 EUR-11 DK EL IRL
STEINKOHLENKOKS
1000 t
Lieferungen an Stahlindustrie
1998 0 1 1999 0 1 -1998 09 1 9 9 8 1 0 199811 1 9 9 8 1 2 1999 09 1 9 9 9 1 0 1999 11 1 9 9 9 1 2 1998 01 1999 01
12 12
- 12 - 12 1 9 9 9 / 1 9 9 8 %
36 266 34 493 2 942 2 869 2 705 2534 2 910 2 889 2 839 3068 36 266 34 493
-4.9
28 673 26 508 2 255 2 271 2 123 1 971 2 129 2 219 2 183 2308 28 673 26 508 -7.6
3682 3 701
321 285 314 226 284 298 312 334 3 682 3 701 0.5
BRAUNKOHLE INSGESAMT
1000 t
1998 01-12 1999 01-12 1998 12 1999 01 1999 02 1999 03 199912 2000 01 2000 02 2000 03 1999 01 - 03 2000 01 - 03
2 0 0 0 / 1 9 9 9 %
240 416 245 521 20 707 21 115 19 075 20 669 19 176
60 859
182 424 184 052 16 064 15 714 14 259 15 282 14 386
45 255
Lieferungen an öffentliche Kraftwerke
1998 0 1 - 1 2 1 9 9 9 0 1 - 1 2 1 9 9 8 1 2 1 9 9 9 0 1
1999 02 1999 03 1999 12 2000 01 2000 02 2000 03 1999 01 - 03
2000 01-03 2000/1999%
250 010 239 426 21 284 21 753 20 985 21 368
192 152 178 093 16 654 16 363 16 183 15 991 19 424
64 106
14 648
48 537
9 104 8 011
-2.9
-9.6
HARD COKE
1000 t
Deliveries to iron/steel Industry
2 320 5 564 2 052 5 312
726 692 657 623 649 655 676 687 9 104 8 011 -12.0
66 034 62 242 14 658 14 440 13 196 14 201 13 458 13 392 13 549 13 662 41 837 40 603
-57 992 61 469 4643 5 401 4 816 5 387 4 790 4 882 5 070 5 499 15 604 15 451
164 199 140 172 160 166 162 189 2 320 2 052 -11.6
9 749 8 831 1 000 884 641 631 548
2 156
440 424 430 446 409 432 443 443 5564 5 312
-4.5
TOTAL LIGNITE
766 894 69 78 48 92 66
218
1000 t
2880 2 855 240 240 240 240 229 218 211 221 720 650
-1.0 -9.7
Deliveries to public power stations
176 412 163 071 14 918 14 687 14 843 14 732 13 391 13 187 13 289 13 558 44 262 40 034
57 858 61 333 4 630 5 390 4 802 5 377 4 776 4 873 5 056 5482 15 569 15 411
9 603 8 849 977 902 632 567 504
2 101
-1 380 1 359 115 115 115 115 114 111 98 116 345 325
NL FIN UK NO
5 138 4 825
382
400 386 403
405 438 365 434
5 138 4 825
-6.1
156 19
19
1 969 1 936
173 159 149
-165 179 114 163
1 969 1 936
676 438 30 94 30 82 37 30 89 34 676 438
220 233 19 18 17 17 20 21 22 24 220 233
-1.7
157 80 12
30
-35.2
1 139 1 054 78 72 134 118 80
324
1 000 1 000 120 120 120 65 120
305
5.9
1 403 1 440
115 112 113 113
ιοi
141 141 142
1 403 1 440
6 190 6 545
572 486 469 450 680 529 515 618
6 190 6 545
2.6
1 700 8 157
COKE DE FOUR 1000 t Livraisons à l'industrie sidérurgique
1998 01-12 1999 01-12
1998 09 199810 1998 11 199812 1999 09 199910 1999 11 199912 1998 01- 12 1999 01- 12
1999/1998% 5.7
TOTAL LIGNITE 1000 t
1998 01-12 1999 01-12 199812 199901 1999 02 1999 03 199912 2000 01 2000 02 2000 03 1999 01- 03 2000 01 - 03
2 0 0 0 / 1 9 9 9 %
Livraisons aux centrales électriques publiques
3 6 0 0 3 734 512 539 473 512 489 487 433
1 524
1998 0 1 - 1 2
1999 0 1 - 1 2 1998 12 1999 01 1999 02 1999 03
1999 12
2000 01 2000 02 2000 03 1999 01 - 03 2000 01 - 03