Int. J. Electrochem. Sci., 8 (2013) 8348 - 8355
International Journal of
ELECTROCHEMICAL
SCIENCE
www.electrochemsci.org
Short Communication
Fumed Silica–Doped Poly(Vinyl Chloride)–Poly(Ethylene
Oxide) (PVC/PEO)–Based Polymer Electrolyte for Lithium Ion
Battery
S.Ramesh* , K.Ramesh and A.K.Arof
Centre for Ionics University Malaya, Department of Physics, Faculty of Science, University of Malaya, 50603 Kuala Lumpur, Malaysia.
*
E-mail: [email protected]
Received: 19 December 2012 / Accepted: 24 April 2013 / Published: 1 June 2013
Polymer electrolytes composed of a blend of poly(vinyl chloride)–poly(ethylene oxide) (PVC/PEO) as a host polymer, lithium triflate (LiCF3SO3) as a salt, mixture of ethylene carbonate (EC) and dibuthyl phthalate (DBP) as plasticizers and silica (SiO2) as the nanocomposite filler were studied. The variation in ionic conductivity values for PVC–PEO–LiCF3SO3–DBP–EC:SiO2 complexes at different silica content were observed. The highest ionic conductivity value obtained for this system is at 3.3210-4 S/cm with 5 wt% of silica. The LiNi0.8Co0.2O2/ PVC–PEO–LiCF3SO3–DBP–EC: SiO2 / MCMB cell shows a discharge time of 522 minutes at 1st cycle. From the discharge part of the curves, the discharge capacity of the cell can be calculated. The discharge capacity observed for Li–ion polymer battery based on PVC/PEO blend electrolyte at 1st cycle is 50 mAh/g. The nominal voltage versus cycle number plot for LiNi0.8Co0.2O2/ PVC–PEO–LiCF3SO3–DBP–EC: SiO2 / MCMB cell shows that the nominal voltage decreased quite significantly after the first discharge cycle and decreased slowly as the cycle number increases.
Keywords: Polymers; Thin films; Chemical Synthesis; Dielectric response
1. INTRODUCTION
weight [3]. It also shows wider electrochemical and thermal stability range as well as low volatility [4]. Therefore, many efforts have been devoted to develop SPE.
In past three decades, polymer electrolytes based on PEO have drawn keen interest because of their efficiency in coordinating lithium ions by solvating lithium ions through the complexation with the lone pair electrons on the ether oxygen atoms in polymer chains [2,5]. The ionic transportation in the PEO-based polymer electrolyte is occurred in the amorphous state, coupled with local relaxation and segmental motion of the PEO chains via hopping mechanisms within the coordination sites [2–3]. However, PEO exhibits relatively high crystalline portion at ambient temperature due to its particular structure and thus shows low ionic conductivity. To overcome this limitation, one of the approaches used is the polymer blending method. Therefore, PVC is blended in order to improve the ionic conductivity. To date, several effective ways are employed to enhance the ionic conductivity, such as plasticization, impregnation of fillers, comb-branched copolymers, cross–linking polymer matrices, binary salt systems and different preparation methods [4]. Among all these methods, additions of plasticizers and inorganic filler are probed. In the present study, a novel of PVC–PEO–LiCF3SO3– DBP–EC–SiO2 has been developed, in which mixture of DBP and EC and SiO2 are used as plasticizer and filler, respectively.
Many researches onto PEO–based polymer electrolytes have been reported. Nevertheless, the fabrication of secondary electrochemical cell is lesser being explored and it will be focused by using polymer matrix which achieves the highest ionic conductivity as an electrolyte. In this work, we present the performance of the cell such as discharge capacity. The discharge characteristic and nominal voltage against cycle number are studied.
2. EXPERIMENTAL
High molecular weight poly(vinyl chloride) (PVC) was obtained from Fluka, while polyethylene oxide (PEO) with average molecular weight of 200,000 were obtained from Aldrich. The PVC/PEO blends were prepared by dissolving in tetrahydrofuran (THF) that was obtained from J.T. Baker. Lithium triflate (LiCF3SO3), obtained from Aldrich, was used as the doping salt. The plasticizers, dibutyl phthalate (DBP) and ethylene carbonate (EC) were both procured from Aldrich and Fluka, respectively. Fumed silica (SiO2) with particle size of 10 – 30 nm, which was supplied by Wacker Chemie was used as the nanocomposite filler.
Ionic conductivity of the polymer electrolytes were determined by ac–impedance measurements using HIOKI 3531 Z bridge interfaced with a computer for data acquisition over a frequency range between 50Hz and 1MHz. The thin film polymer electrolyte films were sandwiched between two stainless disk electrodes, which acted as a blocking electrode for ions.
The PVC blend based polymer electrolyte film with the highest electrical conductivity was used as the electrolyte in the secondary electrochemical cell fabrication. The LiNi0.8Co0.2O2 composite cathode pressed on to an aluminium mesh consisted of LiNi0.8Co0.2O2 with gel polymer electrolyte and activated carbon in the proportions of 70:15:15 wt. %. The anode consisted of MCMB, gel polymer electrolyte and activated carbon in the proportions of 70:15:15 wt% pressed on to a copper mesh. A LiNi0.8Co0.2O2/ polymer electrolyte/ MCMB cell was assembled in a glove box, with the electrolyte sandwiched between the electrodes. The cell was characterized using a BAS LG50 galvanostat interfaced to a computer.
3. RESULTS AND DISCUSSION
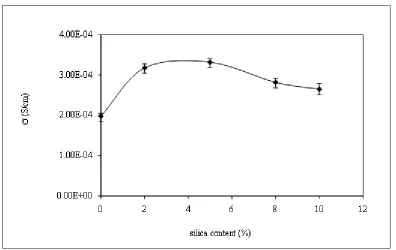
The variation in ionic conductivity values for PVC–PEO–LiCF3SO3–DBP–EC: SiO2 complexes at different silica content are depicted in Fig.1.
Figure 1. Conductivity of PVC–PEO–LiCF3SO3–DBP–EC: SiO2 system as a function of silica content at room temperature.
[image:3.596.102.498.400.650.2]
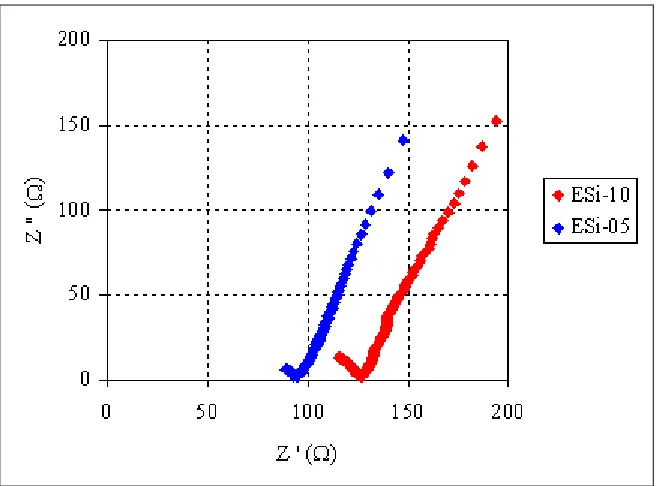
at 3.3210-4 S/cm with 5 wt% of silica. The complex impedance plots of sample with 5 wt% silica (ESi–05) and 10 wt% (ESi–10) silica are shown in Fig.2.
Figure 2. The complex impedance plots of ESi–05 and ESi–10.
From the above analyses on silica incorporation in PVC–PEO system, we can conclude that silica has brought the conductivity of polymer electrolytes into the useful realm for materials in lithium polymer battery applications. The reason for the maximum behavior of the ionic conductivities could be related to the increase in the mobility and in the number of charge carriers with the addition of silica.
The reasons proposed for the enhancement of ionic conductivity, were as follows:
i) The presence of disorder due to interactions between polymers and silica, enhanced by the Lewis acid nature of the silica used leads to a weaker interaction between the polymers and the lithium ions. This interaction is suggested to result in the stiffening of the polymer but allows easier mobility of Li+ ions through an interfacial region [7,9,10]. Silica is expected to interact also with the lithium cation through an acid–base interaction between the lithium cation of the salt and oxygen in the silica. Such an interaction could lead to an increase in the number of free plasticizers, resulting in an increase in ionic conductivity [11].
ii) The extremely high surface area of the nanometric sized silica compared to the polymer increased the amorphousity of the material [8-10,12].
iii) The formation of a new kinetic path via polymer–ceramic boundaries. These boundaries are important because these are the sites for high defect concentration that may allow faster ionic transport [8,13].
[image:4.596.135.463.130.373.2]
electrolyte. This will lead to a higher mobility of the charge carrier and also a larger number of the charge carrier [14].
v) The ceramic particles acting as nucleation centers for the formation of minute crystallites [8].
The conductivity does not continue to rise indefinitely, with increasing concentration of silica. It falls once an optimum concentration of silica (5 wt%) is crossed. The decrease in conductivity at higher silica content can be explained as follows:
i) The agglomeration of the primary silica particles to bigger particles which then leads to lower surface area. This mechanism assumes that the surface area of filler is the key factor in determining high conductivity [10]. High concentration of silica also leads to well–defined crystallite regions. This reasoning is in line with the finding of Rajendran et.al. [8]. Further, beyond this optimum concentration, silica particles tend to impede ionic movement by acting as mere insulators. According to Capuano et.al. [15] the added filler particles may catalyze aggregation of polymer chains and thus increase the rate of recrystallization processes.
ii) At low concentration levels the dilution effect which tends to depress the conductivity, is efficiently contrasted by the specific interaction of the ceramic surface, which promotes fast ion transport. At high filler content, the dilution effect becomes predominant and tends to depress the conductivity [7, 15, 16].
iii) The increase of viscosity of the plasticizer–rich phase and the decrease in the charge carrier numbers [11].
[image:5.596.196.401.469.721.2]PVC–PEO–LiCF3SO3–DBP–EC: SiO2 (95:5) which showed the highest ionic conductivity in PVC–PEO blend based electrolytes was chosen as electrolyte in electrochemical cells.
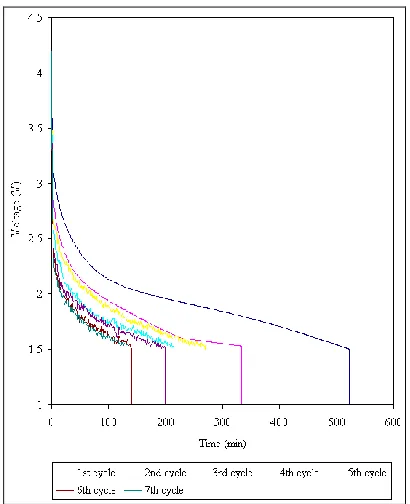
Fig. 3 shows the discharge characteristics of the cells from 1st cycle to 7th cycle. The cells were charged to 4.2 V. For the LiNi0.8Co0.2O2/ PVC–PEO–LiCF3SO3–DBP–EC: SiO2 / MCMB cell, the time needed is 60 minutes.
The LiNi0.8Co0.2O2/ PVC–PEO–LiCF3SO3–DBP–EC: SiO2 / MCMB cell show a discharge time of 522 minutes at 1st cycle. From the discharge part of the curves, the discharge capacity of the cell can be calculated. The discharge capacity observed for Li–ion polymer battery based on PVC/PEO blend electrolyte at 1st cycle is about 50 mAh/g.
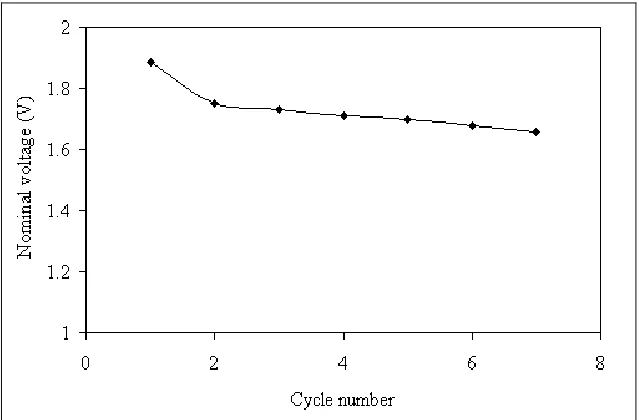
Figure 4. Nominal voltage as a function of cycle number of Li–ion polymer battery based on PVC– PEO blend electrolytes.
From the discharge part of the curves, we can also calculate the nominal voltage of the cells. The nominal voltage versus cycle number plot for LiNi0.8Co0.2O2/ PVC–PEO–LiCF3SO3–DBP–EC: SiO2 / MCMB cell is shown in Fig. 4. The nominal voltage decreased quite significantly after the first discharge cycle and decreased slowly as the cycle number increases. The change in nominal voltage, which for a practically good battery does not, is probably due to the incomplete charging of the cell. Usually for a lithium ion cell, charging is done in two modes, i.e., the constant current and constant voltage mode. During the constant current mode the Li+ ions are forced to intercalate into the graphite layered structure and in the constant voltage mode, the Li+ ions are orderly intercalated into the remote parts of the intercalated layers. Incomplete charging not only gives the cell a lower capacity but also a lower nominal voltage, which fades quite quickly.
The above analyses show that the cells discharge time and nominal voltage decreases with cycle number, which leads to a decrease in discharge capacity values. The capacity fading of the cells after cycling may be attributed to several reasons.
[image:6.596.151.471.216.426.2]
believed to degrade the electrical contact between the surface of the insertion particles, and hence decrease the capacity during repeated cycling [17-19]. Deterioration of interfacial contacts with low ionic conductivity of polymer electrolytes (around 10-4 S/cm) gradually increases the internal resistance of the cells during cycling [20, 21].
According to Kim et.al [22], an abrupt decrease in the discharge capacity is due to the delamination between the polymer electrolyte and the anode. This behavior is common for the electrolyte film prepared with a high polarity solvent due to the lower adhesion property.
4. CONCLUSIONS
PVC–PEO–LiCF3SO3–DBP–EC: SiO2 complex with 5 wt% of silica shows the the highest ionic conductivity value of 3.3210-4 S/cm at room temperature. The discharge capacity for LiNi0.8Co0.2O2/ PVC–PEO–LiCF3SO3–DBP–EC: SiO2 / MCMB cell at 1st cycle is 50 mAh/g. In lithium ion cell, charging is done in two modes (constant current mode and constant voltage mode). It is found that the discharge capacity of the cells fades gradually with cycling.
ACKNOWLEDGEMENT
This work was supported by eScienceFund (16-02-03-6031) from Ministry of Science, Technology and Innovation (MOSTI), Malaysia.
References
1. K. Hanai, M. Ueno, N. Imanishi, A. Hirano, O. Yamamoto and Y. Takeda, , J Power Sources (2010) doi:10.1016/j.jpowsour.2010.10.079.
2. H. (H). Zhang, P. Maitra and S. L. Wunder, Solid State Ionics, 178 (2008) 1975–1983. 3. L. Wang, W. Yang, J. Wang and D. G. Evans, Solid State Ionics, 180 (2009) 392-397 4. S. Ramesh, C.–Wen Liew, E. Morris, R. Durairaj, Thermochim Acta 511 (2010) 140-146.
5. N.K. Karan, D.K. Pradhan, R. Thomas, B. Natesan and R.S. Katiyar, Solid State Ionics, 179 (2008) 689–696.
6. D.Carriere, P.Barboux, F.Chaput, O.Spalla and J.P.Boilet, Solid State Ionics, 145 (2001) 141-147. 7. F.Croce, L.Persi, B.Scrosati, F.S.Fiory, E.Plichta and M.A.Hendrickson, Electrochim Acta, 46
(2001) 2457-2461.
8. S.Rajendran and T.Uma, Mat Lett, 44 (2000) 208-214.
9. X.Qian, N.Gu, Z.Cheng, X.Yang, E.Wang and S.Dong, Electrochim Acta, 46 (2001) 1829-1836. 10.M.Forsyth, D.R.MacFarlane, A.Best, J.Adebahr, P.Jacobsson and A.J.Hill, Solid State Ionics, 147
(2002) 203-211.
11.K.H.Lee, Y.G.Lee, J.K.Park and D.Y.Seung, Solid State Ionics, 133 (2000) 257-263.
12.Z.Wen, M.Wu, T.Itoh, M.Kubo, Z.Lin, O.Yamamoto, Solid State Ionics, 148 (2002) 185-191. 13.M.S.Michael, M.M.E.Jacob, S.R.S.Prabaharan and S.Radhakrishna, Solid State Ionics, 98 (1997)
167-174.
14.N.S.Choi and J.K.Park, Electrochim Acta, 46 (2001) 1453-1459.
17.D.W.Kim and Y.K.Sun, J Power Sources, 102 (2001) 41-45.
18.D.W.Kim, J.M.Ko and J.H.Chun, J Power Sources, 93 (2001) 151-155.
19.D.H.Shen, G.Nagasubramaniam, C.K.Hung, S.Surampudi and G.Halpert, Proceeding of the 182nd Elecrochemical Soc., Canada, (1992) 261-265.
20.S.Ramesh and A.K.Arof, J Power Sources, 99 (2001) 41-47.
21.D.W.Kim, B.Oh, J.H.Park and Y.K.Sun, Solid State Ionics, 138 (2000) 41-49.