Int. J. Electrochem. Sci., 8 (2013) 1623 - 1634
International Journal of
ELECTROCHEMICAL
SCIENCE
www.electrochemsci.org
A Hyphenation of Stripping Voltammetry with Electrospray
Ionization Mass Spectrometry; an Effect of Sodium Perchlorate
on Ferrocene Oxidation
Jana Jaklová Dytrtová1*
, Michal Jakl2, Tomáš Navrátil3, Detlef Schröder1
1
Institute of Organic Chemistry and Biochemistry of the AS CR, v.v.i., Flemingovo náměstí 2, CZ-166 10 Prague 6, Czech Republic
2
Department of Agro-Environmental Chemistry and Plant Nutrition, Faculty of Agrobiology, Food and Natural Resources, Czech University of Life Sciences Prague, Kamýcká 129, CZ-165 21 Prague – Suchdol, Czech Republic
3
J. Heyrovský Institute of Physical Chemistry of the AS CR, v.v.i., Dolejškova 3, CZ-182 23 Prague 8, Czech Republic
*
E-mail: [email protected]
Dedicated to the memory of Dr. habil. Detlef Schröder – one of the tireless investigators and propagators of mass spectrometry
Received: 31 July 2012 / Accepted: 28 August 2012 / Published: 1 February 2013
The coupling of electrospray ionization mass spectrometry (ESI-MS) with an electrochemical (EC) method is a promising technique applicable in electrochemical reaction studies as well as in other analytical fields. The connection of two-electrodes flowing EC cell prior ESI-MS is provided and tested on ferrocene/ferricene system. The base electrolyte used (a mixture of NaClO4 and HClO4) causes particular oxidation of ferrocene to ferricene. Consequently, in ESI-MS spectrum are observed two charged ferricene/ferrocene species: protonated ferrocene (Cp2Fe(II)H)+ and ferricene (Cp2Fe(III))+. In the on-line connection of EC with ESI-MS the ferricene species is electrochemically reduced (in accumulation step of differential pulse anodic stripping voltammetry via insertion of negative potential) to ferrocene species, which is detected as (Cp2Fe(II)H)+ using ESI-MS. The yield of electrochemical reduction of ferricene to ferrocene is almost 30 %, whereas the inserted potential is -1000 mV.
Keywords: ESI-MS; Anodic stripping voltammetry; Electrochemistry; Ferrocene; Ferricene; Base electrolyte
1. INTRODUCTION
e.g., hyphenation with various chromatographic separation techniques (gas chromatography, liquid chromatography, high performance liquid chromatography, etc.) [1,2]. On the other hand very common is the hyphenation of mentioned chromatographic separation techniques with electrochemical (EC) detection [3-5].
Several published papers have dealt with the on-line tandem connection of EC flow cells with MS. With a respect to a successful analyte analysis in such hyphenation, there exist two concepts: quantification of flow-electrolysis products using mass spectrometry [6-10] and data collection from two different detection methods in a flow system [11].
The first system based on hyphenation of EC and MS, which was utilized for determination of species generated during electrochemical reaction, was called DEMS (differential electrochemical mass spectrometry [12]). This technique was advantageous especially for determination of uncharged molecules [13,14]. The potential of such hyphenation in the context of analytical questions as well as reaction mechanisms derives from the possibility of measurements directly in the electrochemical cell [6,15]. However, the required presence of supporting electrolytes can cause interferences of the complexes of interest with more abundant ions stemming from the supporting electrolytes. This interference can be avoided using a volatile electrolyte, such as ammonium acetate or electrolytes, which do not form complexes overlapping with the m/z ratios of the metal complexes under study [8]. The problem with the limited efficiency of electrolysis could be solved by an increase of the working electrode surface or by lowering of the flow, but the lower flow is connected with smaller inner cell volume [16].
In order to gain complementary insight into the nature of the complexes formed, electrospray ionization mass spectrometry (ESI-MS) has been used to assess the types of metal complexes [17-22]. In many cases, ESI-MS data show good correlations with solution phase studies [23-25], and ESI-MS conditions are often considered to mimic biological environments [17-19,26-28]. The stoichiometry of the metal complexes can be derived from the MS spectra by the mass to charge ratios (m/z) in conjunction with the characteristic isotope patterns.
Hyphenation of two different analytical methods EC and ESI-MS seems to be very promising target at present [11,29-32]. It enables to enlarge the field of application of both, EC as well as ESI-MS techniques, simultaneously used e.g. to gain insight into electrochemical processes of metals with low molecular weight organic acids [15,33,34] or pesticides [20,35] in solutions. This hyphenation exhibits some general problems and limitations; the product vs. analyte ratio depends on the solution flow, its trajectory, the electrode surfaces [6,7,15,36], transport of isolated product to the mass spectrometric detector [15] as well as on concentration and solubility of a base electrolyte.
EC methods have been famous in the field of qualitative and quantitative analysis for more than ninety years [37]. They are highly suitable for trace analysis of plenty elements [38] and organic/inorganic compounds, mostly under physiological conditions (e.g., [39-41]). Moreover, the EC techniques are famous due to the possibility of speciation [42-45], particularly, direct current voltammetry (DCV) for assessment of stability constants [44,46].
physical chemistry [48]. The soft ionization of molecules allows to determine stoichiometry of molecules as well as their reactions and moreover to determine the stability of the molecules [49].
The hyphenation of EC with ESI-MS allows investigation of electrochemical properties of substances from the kinetic point of view. The field of application of such hyphenated techniques seems to be very wide, e.g., the generation and identification of reactive metabolites [50], investigation and generation of a wide variety of electrode reaction intermediates (e.g., [51,52]). To the most important field of on-line EC-ESI-MS application belongs the possibility to study the reactions in situ. Nevertheless, such systems are too complicated; therefore, the simpler redox system has to be chosen for the characterization of basic properties of the investigated system. We applied one electron redox system ferrocene (Cp2Fe(II)) /ferricene (Cp2Fe(III)+) in this paper, because this system exhibits high electrochemical reversibility [53].
2. EXPERIMENTAL PART
2.1. Reagents and Materials
The sample solution was prepared from solid ferrocene (to 10-4 mol L-1) and base electrolyte (BE) (NaClO4 and HClO4 [53]), in pure 99.98 % ethanol (all from Sigma-Aldrich, Czech Republic). The solvent of ferrocene was 99.98 % ethanol and the solvent of BE was pure water. The consequent solvent of all measured samples was 95 % ethanol. More diluted concentrations of BEs were prepared (NaClO4 10-3 mol L-1 and HClO4 10-4 mol L-1) to be suitable for ESI-MS [54]. Prior to the measurements the sample was degassed using N2 and afterwards was injected continually (0.5 mL h-1) from a Hamilton syringe (Thermo Fisher Scientific, USA) via syringe pump (KD Scientific, USA).
The preconcentration step (120 s long in our case) of anodic stripping voltammetry was used to show the impact of inserted accumulation potential (-1200 mV to -200 mV in 100 mV step, polarization rate 10 mV s-1) to ferrocene speciation visible in MS spectra. The changes of ferrocene speciation during oxidation/reduction were recorded in MS spectra.
2.2. Apparatus
The ESI-MS experiments were performed with a Finnigan LCQ Advantage ion-trap mass spectrometer (ThermoFinnigan, USA) fitted with an electrospray ionization source operated in positive and negative-ion mode [54]. The sample solutions of ferrocene were introduced into the ESI source via a fused-silica capillary at a flow rate of 0.5 mL h-1. Nitrogen was used as the nebulizer gas. The operating conditions were set as follows: spray voltage 5.0 kV, capillary voltage 0 V and tube lens offset 0 V for the most of measurements shown in this study, heated capillary temperature 250°C, sheath gas flow rate and auxiliary gas flow rate 10–50 arbitrary units. The ionization conditions in ESI are critically influenced by the settings of the capillary voltage and the tube lens offset.
Cross 0.020” thru-hole with F-300 Fittings; Upchurch Scientific Rheodyne, IDEX Health & Science, USA), with the sweep volume 0.72 µL. The sample inlet and outlet were via capillary PEEK Tubing 0.25 mm (IDEX Health & Science). The voltammetric cell works in two electrodes connection of computer controlled polarographic/voltammetric analyzer PC-ETP (Polaro-Sensors, Czech Republic) with Multielchem 2.1 software (J. Heyrovský Institute of Physical Chemistry of the AS CR, v.v.i., Czech Republic) [55] and POLAR.PRO software v. 5.1 (Polaro-Sensors, Czech Republic). Working electrode (WE) was a platinum wire and reference electrode (RE) was a silver wire (both 1 mm in diameter, Goodfellow Corp., USA).
It has to be noted that Ag electrode is not considered as ideal reference electrode because of its possible polarization during electrochemical reactions. However, the utilization of an electrode of the second kind in the EC cell is impossible from the construction point of view. Only the Ag/AgCl electrode can be installed into peak-cross holes. Nevertheless, the required presence of Cl- ions is undesirable due to evocation of clustering during the electrospray process. Moreover, the utilization of Ag electrode as the “pseudoreference” electrode takes the polarizability of the Ag electrode advantageous to electrochemical "cleaning" of the Pt electrode via insertion of a potential of opposite value that was applied for desirable electrochemical reaction.
Scheme 1. Design of the voltammetric flow cell (WE – working electrode, RE – reference electrode). Adopted from [11]. This figure is reproduced with kind permission of the Best Servis, Czech Republic.
3. RESULTS AND DISCUSSION
3.1. Impact of capillary voltage and tube lens offset on signal intensity
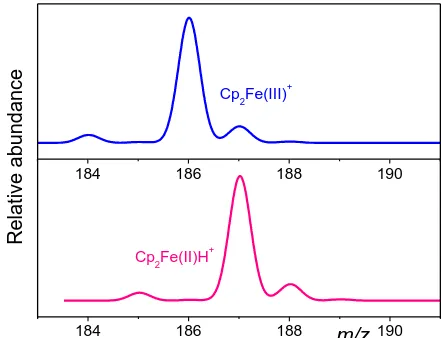
As ferrocene is considered as protonated Cp2FeH+ m/z 187 with Fe(II) and ferricene is considered as Cp2Fe+ m/z 186 with Fe(III) (Fig. 1); CV and TLO values were optimized to highest intensity of both Cp2Fe(II)H+ and Cp2Fe(III)+, respectively. Optimal values for Cp2Fe(II)H+ were lower (CV = 0 V, TLO = 20 V) than for Cp2Fe(III)+ (CV = 20 V, TLO = 40 V) in solution without BE (Fig. 2a). On the other hand, in solution with BE (10-3 mol L-1 NaClO4, 10-4 mol L-1 HClO4) were CV and TLO values similar for both (CV = 0 V, TLO = 20 V, Fig. 2b). To minimize the oxidative impact of positive voltage to the sample CV = 0 V and TLO = 0 V were chosen for coupling with ASV.
184 186 188 190
184 186 188 190
Cp2Fe(II)H+
Cp2Fe(III)+
Relative abundan
ce
[image:5.596.183.404.209.378.2]m/z
Figure 1. Simulation of isotope patterns and m/z values of ferricene (Cp2Fe(III)+, top) and protonated ferrocene (Cp2Fe(II)H+, bottom).
3.2. Impact of BE on abundance of Cp2Fe(II)H+ and Cp2Fe(III)+ species
The presence of BE in the sample might induce the creation of ferrocene species clusters with BE [11]. Also, the increase of solution conductivity can affect the electrospray ionization effect. Therefore, it was necessary to investigate impact of BE on ferrocene species. Regardless, BEs are considered as unaffecting the electrochemical reaction.
In the solution without the BE (Fig. 2a) the intensity of Cp2Fe(II)H+ was more than one order of magnitude higher than the intensity of Cp2Fe(III)+, whereas the absolute intensity of Cp2Fe(II)H+ has not exceeded the value 1.5∙105
and Cp2Fe(III)+ the value 8.0∙103. Contrary to this, the ratio between Cp2Fe(II)H+ and Cp2Fe(III)+ is the opposite (the ferricene form Cp2Fe(III)+ dominates) in presence of the BE (Fig. 2b).
-100 -50 0 50 100 150
0 1
184 186 188 190 0 2x10⁵ In te ns ity m/z
Tube lens offset (V)
Cp2Fe(III)+
Cp2Fe(II)H+
Relative abundan
ce
Capillary voltage (V)
-50 0 50 100 150
(a)
-100 -50 0 50 100 150
0 1
184 186 188 190 0 2x10⁶ In te ns ity m/z
-50 0 50 100
Cp2Fe(III)+
Cp2Fe(II)H+
Relative abundan
ce
Capillary voltage (V)
150 Tube lens offset (V)
(b)
Figure 2. Dependence of relative abundance of Cp2Fe(II)H+ (m/z 187) and Cp2Fe(III)+ (m/z 186) on capillary voltage (CV) and tube lens offset (TLO). Mass spectra of CV = 0 V and TLO = 0 V is shown on expanded mass scale; 95 % ethanol, ferrocene 10-4 mol L-1. (a) Solution without BE. (b) Solution with BE (10-3 mol L-1 NaClO4, 10-4 mol L-1 HClO4).
800 1000 1200 1400 1600 1800 2000
0 2x10⁵ 4x10⁵ 6x10⁵
8x10⁵ 100 200 300 400 500 600
0 2x10⁵ 4x10⁵ 6x10⁵ 8x10⁵
(Cp2Fe(III)H)2+
15 14 13 12 11 10 9 8 7 6 2 In te n sity m/z 16 a
Cp2Fe(III)+/Cp2Fe(II)H+
1
5 4
3
[image:6.596.71.524.69.282.2]b
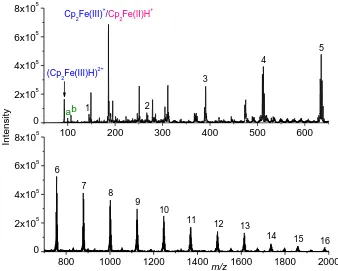
Figure 3. ESI-MS spectra of ferrocene (10-4 mol L-1) in BE (NaClO4 10-3 mol L-1, HClO4 10-4 mol L-1) in off-line regime (without connection with EC). Numbers represent x in [Na(NaClO4)x]+, a stands for [H(NaClO3)]+, and b stands for [Na(NaClO3)]+
[image:6.596.128.466.378.649.2]
2Fe(II) ↔ 2Fe(III) + 2e
-Cl(VII) + 2e- ↔ Cl(V)
Scheme 2.The scheme of Cp2Fe(II) oxidation to Cp2Fe(III)+ by ClO4-.
Ferricene creates two complexes Cp2Fe(III)+ (m/z 186) and (Cp2Fe(III)H)2+ (m/z 93), ferrocene is represented as protonated Cp2Fe(II)H+ (m/z 187) in the spectra (Fig. 3). Other major patterns in the spectra mostly represent BE clusters [Na(NaClO4)x]+, where x is 1 to 16 in the range m/z 50 to 2000. In the spectra are also present species containing NaClO3 coming from ferrocene oxidation, [H(NaClO3)]+ and [Na(NaClO3)]+.
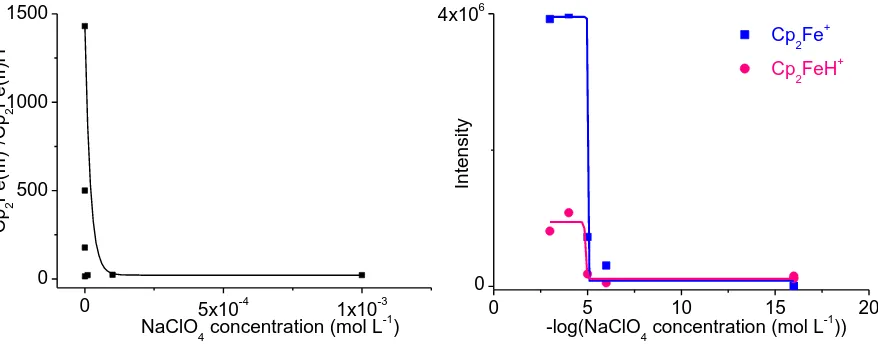
From previous discussion it is evident that the ratio Cp2Fe(II)H+/Cp2Fe(III)+ depends on the concentration of the BE (a mixture of NaClO4 and HClO4, Fig. 4a). The intensity of Cp2Fe(II)H+ in solution without BE was almost 1/3 (31.3 %) of the intensity in solution with BE (the highest concentration). The shift in intensities is evident in the case of Cp2Fe(III)+, where the intensity without BE was less than 0.5 % (0.42 % exactly) of the intensity in presence of the BE (Fig. 4b). The shift in Cp2Fe(II)H+/Cp2Fe(III)+ ratio is caused mainly with the increase Cp2Fe(III)+ signal with BE addition.
0 5x10⁻⁴
1x10⁻³ 0
500 1000 1500
Cp
2
Fe
(I
II
)
+ /C p2
Fe
(I
I)
H
+
NaClO
4 concentration (mol L -1
)
0 5 10 15 20
0 4x10⁶
Cp
2Fe +
Cp2FeH+
Intensi
ty
-log(NaClO
4 concentration (mol L -1
[image:7.596.81.520.350.522.2]))
Figure 4. (a) Dependence (exponential decay) of Cp2Fe(III)+/Cp2Fe(II)H+ ratio on concentration of BE (NaClO4, mol L-1). (b) Dependence (Boltzmann sigmoid function) of Cp2Fe(III)+ and Cp2Fe(II)H+ intensity on negative logarithm of NaClO4 concentration (mol L-1); 95% ethanol, ferrocene 10-4 mol L-1, different concentration of BE.
3.3. The hyphenation – influence of inserted potential on Cp2Fe(II)H+/Cp2Fe(III)+ ratio
Final part of this chapter is devoted to the optimization of electrochemical set up of ASV, namely to the impact of inserted potential during the accumulation step. Moreover, any influence of the electrospray process (ESI) on electrochemical reactions occurred in electrochemical device has to be ruled out.
not present, because in the flowing system no Cp2Fe(III)+ remains to be consequently reduced. In this point, it is important to be highlighted that the oxidation of Cp2Fe(II) to Cp2Fe(III)+ is caused by addition of the NaClO4 (used as BE) only, however, the oxidation is enhanced under oxidative electrospray conditions. It means, the oxidation of Cp2Fe(II) to Cp2Fe(III)+ mediated by ClO4- is not significant under usual electrochemical conditions. Moreover, the oxidation of Cp2Fe(II) to Cp2Fe(III)+ is also not realizable in electrospray process without ClO4- mediation. It means, the enormous oxidation of Cp2Fe(II) to Cp2Fe(III)+ is occurred under electrospray conditions in presence of ClO4 -only (Scheme 2, Fig. 4).
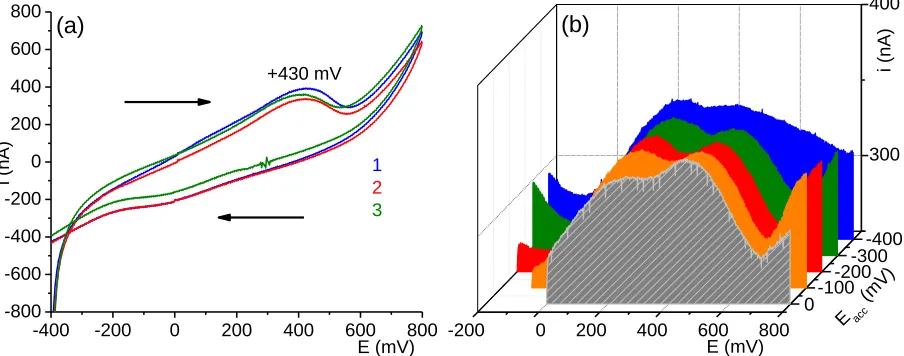
Differential pulse anodic stripping voltammetry (DPASV) was realized in different accumulation potentials (Fig. 5b) to see the impact of the value of inserted potential. Because oxidation of ferrocene is realized in one-step and on the anodic voltammograms two waves can be seen, it is possible to conclude that two different species are present (oxidized) or that only some part of ferrocene is adsorbed on the electrode surface [11]. The oxidation potential of ferrocene in the system Pt-Ag was in approx. +430 mV, the electrode surfaces were renewed by a reverse scan (not shown).
-400 -200 0 200 400 600 800
-800 -600 -400 -200 0 200 400 600 800 (a) i (nA) E (mV) +430 mV 1 2 3
-200 0 200 400 600 800
[image:8.596.74.526.321.499.2]300 400 0-100 -200-300 E (mV) -400 Eacc (mV) i (nA) (b)
Figure 5. (a) Consecutive cyclic voltammogram of ferrocene in flowing system; flow rate 0.5 mL h-1, scan rate 10 mV s-1. (b) DPASV in different accumulation potentials, accumulation time 120 s, polarization rate 10 mV s-1.
To see the effect of inserted potential using the EC cell working in ASV mode on ESI mass spectrum in off-line regime (the cell disconnected) were measured. While the EC cell was connected in front of the mass spectrometer (on-line regime), the working electrode (WE) may operate as anode (oxidation is occurred, more positive potentials than the standard potential are inserted) or as cathode (reduction is occurred, more negative potentials than the standard potential are inserted).
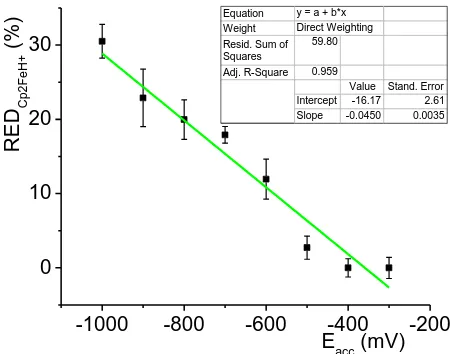
The efficiency of reduction in EC cell is expressed as percentage contribution of electrochemically reduced Cp2Fe(II)H+, which linearly depends on inserted accumulation potential (Fig. 6):
off line
100FeH Cp line -off FeH Cp line -on FeH Cp RED 2 2 2 FeH
Cp2
where REDCp2Fe(II)H+ stands for the electrochemical contribution of Cp2Fe(II)H+ (%), Cp2FeH+
(off-line) is the intensity of Cp2Fe(II)H+ in mass spectra measured in off-line regime and Cp2FeH+ (on-line)
is the intensity of Cp2Fe(II)H+ in mass spectra measured in on-line regime for different negative accumulation potentials. REDCp2Fe(II)H+ is exactly the yield of electrochemical reduction of Cp2Fe(III)+ to Cp2Fe(II). The yield linearly depends on inserted potential (Fig. 6). The maximum yield (almost 30 %) is reached for potential -1000 mV. The bars in the graph correspond to 3 standard deviations.
-1000 -800 -600 -400 -200
0 10 20 30
R
E
D C
p
2
F
e
H
+
(
%
)
Eacc (mV)
Equation y = a + b*x Weight Direct Weighting Resid. Sum of
Squares
59.80 Adj. R-Square 0.959
Value Stand. Error Intercept -16.17 2.61 Slope -0.0450 0.0035
Figure 6. The influence of inserted potential on EC cell demonstrated as the efficiency of electrochemical reduction expressed as percentage amount of electrochemically reduced Cp2Fe(II)H+; 95% ethanol, ferrocene 10-4 mol L-1, 10-3 mol L-1 NaClO4, 10-4 mol L-1 HClO4. The bars in the graph correspond to 3 standard deviations.
[image:9.596.185.410.204.381.2]
180 185 190 195
0 1 0 1 0 1
180 185 190 195
19 %
17 %
m/z
reduction
22 %
-1000 mV
Relative abundan
ce
oxidation
[image:10.596.187.414.66.363.2]+800 mV off-line
Figure 7. ESI-MS spectra of ferrocene (10-4 mol L-1) in BE (NaClO4 10-3 mol L-1, HClO4 10-4 mol L-1) in off-line regime (without connection with EC), in oxidation regime (+800 mV was inserted on WE) and reduction regime (-1000 mV was inserted on WE). The amount of Cp2Fe(II)H+ comparing to Cp2Fe(III)+ is expressed in %.
4. CONCLUSIONS
The coupling of electrochemistry (EC) with electrospray ionization mass spectrometry (ESI-MS) allows to study products of electrochemical reactions. In the first step (using solely ESI-(ESI-MS) the oxidation of ferrocene to ferricene with the addition of NaClO4 (10-3 mol L-1) and HClO4 (10-4 mol L-1) as BE was studied and observed under electrospray ionization conditions. Consequently, in on-line connection of electrochemical cell prior to ESI-MS the re-reduction of ferricene to ferrocene on the platinum wire electrode was observed. The yield of the electrochemical reduction of ferricene to ferrocene depended on the inserted potential. The reduction force of the electrochemical cell increased with decreasing potential.
This study serves to optimize the electrochemical cell construction as well as to investigate the impact of BE to simple redox system presented by ferrocene/ferricene couple. The electrochemical cell construction is applicable to study of electrochemical reaction with stable products in detectable amounts. The maximal yield of reduction reaction is almost 30 % in dependence on inserted potential. ACKNOWLEDGEMENTS
References
1. M. H. A. El-Zohri, R. Cabala and H. Frank, Analytical and Bioanalytical Chemistry, 382 (2005) 1871.
2. P. Přikryl, L. Havlíčková, V. Pacáková, J. Hradilová, K. Štulík and P. Hofta, Journal of Separation Science, 29 (2006) 2653.
3. O. Zitka, P. Babula, J. Sochor, M. Kummerova, O. Krystofova, V. Adam, L. Havel, M. Beklova, J. Hubalek and R. Kizek, International Journal of Electrochemical Science, 7 (2012) 908.
4. O. Zitka, H. Skutkova, O. Krystofova, P. Sobrova, V. Adam, J. Zehnalek, L. Havel, M. Beklova, J. Hubalek, I. Provaznik and R. Kizek, International Journal of Electrochemical Science, 6 (2011) 1367.
5. J. Barek, J. Fischer, T. Navrátil, K. Pecková, B. Yosypchuk and J. Zima, Electroanalysis, 19 (2007) 2003.
6. S. P. E. Smith, E. Casado-Rivera and H. D. Abruna, Journal of Solid State Electrochemistry, 7 (2003) 582.
7. H. Baltruschat, Journal of the American Society for Mass Spectrometry, 15 (2004) 1693. 8. R. Arakawa, T. Abura, T. Fukuo, H. Horiguchi and G. Matsubayashi, Bulletin of the Chemical
Society of Japan, 72 (1999) 1519.
9. V. Červený, P. Rychlovský, J. Hraníček and J. Šíma, Chemicke Listy, 103 (2009) 652. 10. N. H. Bings, Z. Stefánka and S. R. g. Mallada, Analytica Chimica Acta, 479 (2003) 203. 11. J. Jaklová Dytrtová, M. Jakl and D. Schröder, in T. Navrátil, J. Barek (Editors), Modern
Electrochemical Methods XXXI, BEST Servis, Ústí nad Labem, Jetřichovice, 2011, p. 69. 12. S. Bruckenstein and J. Comeau, Faraday Discussions of the Chemical Society, 56 (1973) 285. 13. A. M. Bond, R. Colton, A. D'Agostino, A. J. Downard and J. C. Traeger, Analytical Chemistry, 67
(1995) 1691.
14. M. C. S. Regino and A. Brajter-Toth, Analytical Chemistry, 69 (1997) 5067.
15. J. Jaklová Dytrtová, M. Jakl, D. Schröder and T. Navrátil, Current Organic Chemistry, 15 (2011) 2970.
16. K. Štulík and V. Pacáková, Critical Reviews in Analytical Chemistry, 14 (1984) 297.
17. K. J. Koch, T. Aggerholm, S. C. Nanita and R. G. Cooks, Journal of Mass Spectrometry, 37 (2002) 676.
18. S. A. Hofstadler and R. H. Griffey, Chemical Reviews, 101 (2001) 377. 19. C. L. Gatlin, F. Turecek and T. Vaisar, Analytical Chemistry, 66 (1994) 3950.
20. J. Jaklová Dytrtová, M. Jakl, D. Schröder, E. Čadková and M. Komárek, Rapid Communications in Mass Spectrometry, 25 (2011) 1037.
21. J. Jaklová Dytrtová, M. Jakl and D. Schröder, Talanta, 90C (2012) 63.
22. R. Norková, J. Jaklová Dytrtová, M. Jakl and D. Schröder, Water, Air, & Soil Pollution, 223 (2012) 2633.
23. V. B. Di Marco and G. G. Bombi, Mass Spectrometry Reviews, 25 (2006) 347. 24. C. Walther, M. Fuss and S. Buchner, Radiochimica Acta, 96 (2008) 411.
25. T. Urabe, T. Tsugoshi and W. Tanaka, Journal of Mass Spectrometry, 44 (2009) 193.
26. J. M. Daniel, S. D. Friess, S. Rajagopalan, S. Wendt and R. Zenobi, International Journal of Mass Spectrometry, 216 (2002) 1.
27. B. N. Pramanik, A. K. Ganguli and M. L. Gross, Applied Electrospray Mass Spectrometry, Marcel Dekker, New York, Basel, 2002.
28. N. G. Tsierkezos, M. Buchta, P. Holý and D. Schröder, Rapid Communications in Mass Spectrometry, 23 (2009) 1550.
30. U. Jurva, H. V. Wikström and A. P. Bruins, Rapid Communications in Mass Spectrometry, 14 (2000) 529.
31. C. F. Bökman, C. Zettersten and L. Nyholm, Analytical Chemistry, 76 (2004) 2017. 32. V. Gutkin, J. Gun and O. Lev, Analytical Chemistry, 81 (2009) 8396.
33. J. Jaklová Dytrtová, M. Jakl, I. Šestáková, E.-L. Zins, D. Schröder and T. Navrátil, Analytica Chimica Acta, 693 (2011) 100.
34. M. Jakl, J. Jaklová Dytrtová and P. Tlustoš, in T. Navrátil, J. Barek (Editors), Modern Electrochemical Methods XXX, BEST Servis, Ústí nad Labem, Jetřichovice, 2010, p. 85. 35. M. Jakl, J. Jaklová Dytrtová and E. Čadková, An electrochemical approach to study
bis-coordinated copper/tebuconazole complexes, BEST Servis, Ústí nad Labem, Jetřichovice, 2011. 36. F. Zhou, TrAC - Trends in Analytical Chemistry, 24 (2005) 218.
37. J. Barek, A. G. Fogg, A. Muck and J. Zima, Critical Reviews in Analytical Chemistry, 31 (2001) 291.
38. T. Navrátil and I. Šestáková, in M. Otesteanu, S. Celikyay, N. Mastorakis, S. Lache, F.K. Benra (Editors), 5th WSEAS International Conference on Environment, Ecosystems and Development, World Scientific and Engineering Acad and Soc, Puerto de la Cruz, SPAIN, 2007, p. 174.
39. D. Hynek, L. Krejcova, J. Sochor, N. Cernei, J. Kynicky, V. Adam, L. Trnkova, J. Hubalek, R. Vrba and R. Kizek, International Journal of Electrochemical Science, 7 (2012) 1802.
40. M. Pohanka, M. Hrabinova, J. Fusek, D. Hynek, V. Adam, J. Hubalek and R. Kizek, International Journal of Electrochemical Science, 7 (2012) 50.
41. P. Sobrova, M. Ryvolova, D. Hynek, V. Adam, J. Hubalek and R. Kizek, International Journal of Electrochemical Science, 7 (2012) 928.
42. I. Šestáková and T. Navrátil, Bioinorganic Chemistry and Applications, 3 (2005) 43. 43. S. Sander, T. Navrátil and L. Novotný, Electroanalysis, 15 (2003) 1513.
44. J. Jaklová Dytrtová, I. Šestáková, M. Jakl and T. Navrátil, Electroanalysis, 21 (2009) 573. 45. J. Jaklová Dytrtová, I. Šestáková, M. Jakl, J. Száková, D. Miholová and P. Tlustoš, Central
European Journal of Chemistry, 6 (2008) 71.
46. S. Bubic and M. Branica, Thalassia Jugoslavica (1973) 47.
47. J. B. Fenn, M. Mann, C. K. Meng, S. F. Wong and C. M. Whitehouse, Science, 246 (1989) 64. 48. D. Schröder, J. Roithová, P. Gruene, H. Schwarz, H. Mayr and K. Koszinowski, Journal of
Physical Chemistry A, 111 (2007) 8925.
49. E.-L. Zins, C. Pepe and D. Schröder, Journal of Mass Spectrometry, 45 (2010) 1253. 50. W. Lohmann and U. Karst, Analytical Chemistry, 79 (2007) 6831.
51. T. Zhang, S. P. Palii, J. R. Eyler and A. Brajter-Toth, Analytical Chemistry, 74 (2002) 1097. 52. C. Zettersten, M. Co, S. Wende, C. Turner, L. Nyholm and P. J. R. Sjoberg, Analytical Chemistry,
81 (2009) 8968.
53. A. M. Bond, E. A. McLennan, R. S. Stojanovic and F. G. Thomas, Analytical Chemistry, 59 (1987) 2853.
54. J. Jaklová Dytrtová, M. Jakl and D. Schröder, in T. Navrátil, J. Barek (Editors), Modern Electrochemical Methods XXX, BEST Servis, Ústí nad Labem, Jetřichovice, 2010, p. 89. 55. T. Navrátil, B. Yosypchuk and J. Barek, Chemia Analityczna, 54 (2009) 3.
56. P. Masawat, S. Liawruangrath, Y. Vaneesorn and B. Liawruangrath, Talanta, 58 (2002) 1221.