Techno-economic evaluation of reducing shielding
gas consumption in GMAW whilst maintaining
weld quality
S.W. Campbell1*, A.M. Galloway1 and N.A. McPherson2
1Department of Mechanical and Aerospace Engineering, University of Strathclyde, Glasgow, Scotland
2BAE Systems Surface Ships Limited, Glasgow, Scotland *[email protected]
Abstract
A series of experimental trials have been conducted to investigate the effects of reducing the shielding gas consumption in gas metal arc welding (GMAW). A number of claims have been made as to potential shielding gas savings in the GMAW process when using gas saving devices such as commercially available self-regulating valves. However, the literature and data available on weld quality obtained as a result of reducing the shielding gas flow rate is not readily available.
A number of self-regulating valves have been developed which claim to greatly reduce shielding gas consumption; however, shielding gas consumption can only be reduced without detriment to weld quality. Trials have therefore been conducted from a technical and economical viewpoint to establish and compare the effects of using one such device to reduce shielding gas consumption to that of reducing the flow rate manually using a conventional gas flowmeter.
It has been determined that, in a draft free environment, the shielding gas flow rate can effectively be reduced to 6 L/min without diminishing weld quality, promoting approximately 60% gas saving during continuous welding. However, as anticipated, a lower flow rate is more susceptible to the effects of cross drafts and therefore a higher flow rate is required to produce adequate weld quality when such conditions are present.
An increase in penetration, leg length, distortion and peak temperature suggest that the heat transfer efficiency is increased when implementing a lower shielding gas flow rate potentially encouraging faster travel speeds and greater productivity.
Introduction
There is an on-going drive to improve the efficiency of the GMAW process and/or any other conventional processes that require a gas shield to be present during welding. One area where there is considerable potential to develop cost savings is by reducing the shielding gas consumption.
Shielding gases are fundamental to most welding processes, their primary purpose is to protect the molten weld pool from contamination by atmospheric gases. There are a number of shielding gases commonly used, each with their own specific properties [1-10] and they each have the ability to affect the mode of metal transfer, cleaning action, penetration level and weld geometry. As a result of the shielding gas affecting the geometry of the completed weld profile,
computational modelling [1] can be implemented to optimise the weld parameters and hence the weld geometry.
The correct flow rate is essential for producing adequate protection to the weld metal during the heating, liquid and solidification stages. Hence, there is an optimum flow rate for shielding gases but this is difficult to define and is often decided by rule of thumb. What is known however is that too low a flow rate can lead to inadequate coverage of the weld pool and can lead to porosity and spatter development whilst too high a flow rate can result in poor penetration [11] and can also lead to porosity due to turbulence in the flow resulting in atmospheric gases being drawn into the arc column [12]. Nevertheless, the issues associated with over estimating the optimum flow rate are often preferred to those of
insufficient flow. Consequently, a higher flow rate is normally selected albeit at a substantial and unnecessary cost to the process.
Although it has been reported [2,10,15] that the cost of the shielding gas is
minimal in relation to the overall welding costs, Standifer [16] stated that a typical welding plant with 300 workstations, each operating with a shielding gas flow rate of 45CFH (approximately 21 L/min), at 50% efficiency and 30% arc time will consume more than $1.5 million of argon annually. In addition to this, Standifer also determined that an additional $168,000 is accrued by the initial surge at weld ignition. Furthermore, these calculations are based upon argon shielding gas costs that were generated a decade ago and consequently the unit cost is likely to have increased substantially due to inflation and other economic drivers. Additionally, the calculations assumed ideal conditions, which included each workstation having the recommended gas flow rate pre-set, which is reported [11] to be no more than 12 times the filler wire diameter. As predicted, it was found that less than 20% of workstations did so and the majority were found to exceed the recommended pre-set flow rate.
Various electromagnetic gas saving devices have been developed to regulate the gas flow rate and minimise shielding gas consumption [17-20]. These have been reported to produce gas savings in the region of 60%. Some of these units have been developed, implementing a feedback control loop, to synchronise the flow rate according to a correlation between shielding gas flow rate and the welding current used. A theoretical relationship between welding current and shielding gas flow rate has been derived [13], which, in principle means that, the higher the welding current used, the greater the shielding gas flow required. In doing so, the theoretical optimum flow of shielding gas is continuously supplied to the weld zone. The conventional method of manually setting gas flow rates often becomes a permanent setting regardless of the welding current being used, often accounting for the maximum estimated welding current, thus resulting in a gross over usage of gas.
reduction in porosity has been found in the alternating gas process, which has been attributed to several phenomena combining in the molten pool; one of which is an arc pressure peaking effect, which is also likely to be present when using the gas saving device due to a pressure impulse.
A reduction in shielding gas consumption provides additional benefits, as a
consequence of having less down time due to cylinder changeovers; an increase in productivity is promoted. In addition, cylinders are never completely empty at changeover; however, this is commonly overcome through the use of bulk storage shielding gases negating these issues. Moreover, a reduction in carbon emissions [11] is achieved through a culmination of a reduction in CO2 gas mixture
consumption, and a decrease in energy required for gas production and delivery. However, as a consequence of reducing the shielding gas flow rate, this adversely affects the shielding gas’s ability to protect the weld region from the detrimental effects introduced by a cross draft. A critical ratio of shielding gas flow rate to cross draft velocity has been reported to be approximately 10 [21], and
consequently cross draft velocity in the welding region needs to be taken into consideration when reducing shielding gas flow rates.
In respect of the increasing publicity surrounding these ‘gas saving’ devices and the rising economic costs of acquiring shielding gases, comprehensive trials have therefore been conducted to ascertain the true effects of reducing the shielding gas flow rate to determine the optimum shielding gas flow rate without detriment to weld quality by comparing the following:
• Conventional shielding gas flowmeter
• Electromagnetic gas saving device
Latterly, a gas consumption study was conducted to determine the impact of implementing a mechanical anti-surge device whilst using a conventional shielding gas flowmeter.
Experimental Setup
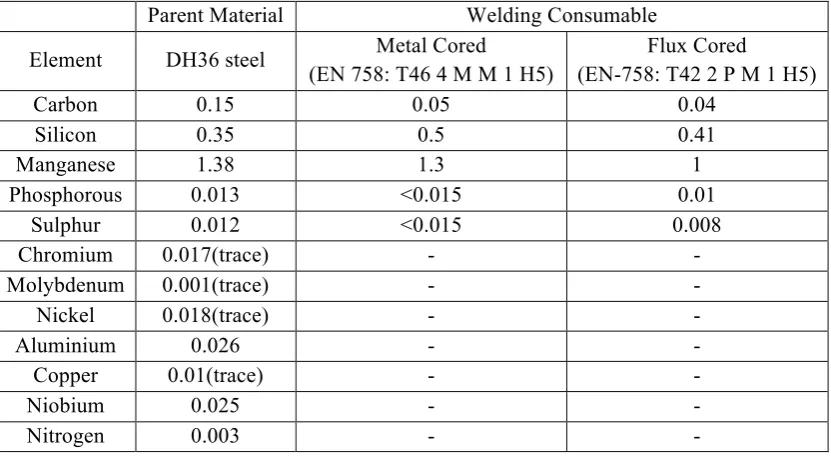
were performed on DH36 grade steel using 1.0 mm metal cored and 1.2 mm flux cored filler wires, with typical chemical compositions shown in Table 1.
Parent Material Welding Consumable Element DH36 steel Metal Cored
(EN 758: T46 4 M M 1 H5)
Flux Cored
(EN-758: T42 2 P M 1 H5)
Carbon 0.15 0.05 0.04
Silicon 0.35 0.5 0.41
Manganese 1.38 1.3 1
Phosphorous 0.013 <0.015 0.01 Sulphur 0.012 <0.015 0.008 Chromium 0.017(trace) - - Molybdenum 0.001(trace) - - Nickel 0.018(trace) - -
Aluminium 0.026 - -
Copper 0.01(trace) - -
Niobium 0.025 - -
[image:5.595.121.537.112.340.2]Nitrogen 0.003 - -
Table 1: Chemical composition of DH36 steel and welding consumables The base case for comparison of each shielding gas flow rate and control method was Argon/CO2 (80/20) shielding gas with a flow rate of 15 L/min, manually set using a conventional flowmeter. In order to draw a direct comparison between the results, trials were performed to evaluate the effects of reducing the shielding gas flow rate both manually, using a conventional flowmeter device, and through the use of a commercially available electromagnetic gas saving device. This unit is marketed to reduce shielding gas consumption through a combination of four methods:
• Gas flow rate is synchronised with the welding current.
• Extremely fast valve (50 Hz) that opens and closes continually throughout
the welding process.
• The pulsing effect of the valve promotes further gas reductions whilst
maintaining optimal flow.
• Elimination of ‘Gas puffs’, i.e. suppressing the initial surge of shielding
gas.
• Reducing the gas surge at weld initiation. • Delivering a controlled flow rate.
The shielding gas flow rate was controlled using a conventional flowmeter and measured by a pre-calibrated welding monitor. A portable arc monitoring system (PAMS) unit was also used throughout experimentation to accurately obtain the welding arc voltage and current. The PAMS unit has a sample frequency of 5 kHz and consequently allowed for an accurate representation of the welding
parameters when using the electromagnetic gas saving device, which had the ability to open a valve at 50 Hz.
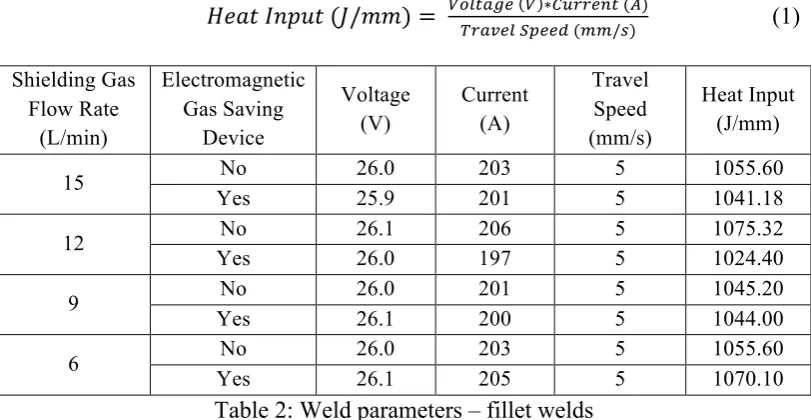
Initial trials took place using 1.0 mm metal cored filler wire on 6 mm thick bar tacked together in the form of an inverted ‘T’ fillet weld. Welds were performed on an automatic welding rig, which moved the tacked bars at a pre-set travel speed beneath a stationary GMAW torch.
The average welding parameters, and consequently heat input, for this section of the investigation are documented in Table 2, the heat input has been calculated throughout according to Equation 1. As can be seen, there is no apparent connection between the shielding gas flow rate and the welding parameters.
𝐻𝑒𝑎𝑡 𝐼𝑛𝑝𝑢𝑡 (𝐽/𝑚𝑚) = !"#$%&'!"#$%& !"##$ (! ∗!"##$%& (!!!/!)) (1)
Shielding Gas Flow Rate
(L/min)
Electromagnetic Gas Saving
Device
Voltage (V)
Current (A)
Travel Speed (mm/s)
Heat Input (J/mm) 15 No 26.0 203 5 1055.60
[image:6.595.125.531.458.668.2]Yes 25.9 201 5 1041.18 12 No 26.1 206 5 1075.32 Yes 26.0 197 5 1024.40 9 No 26.0 201 5 1045.20 Yes 26.1 200 5 1044.00 6 No 26.0 203 5 1055.60 Yes 26.1 205 5 1070.10
Table 2: Weld parameters – fillet welds
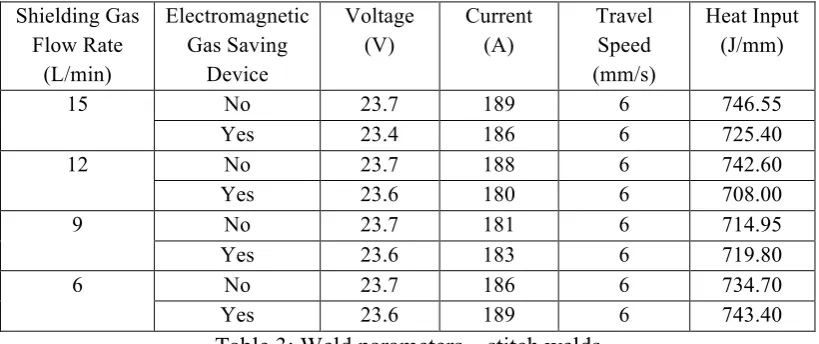
replicate the conditions likely to occur in construction yards, a light cross draft of approximately 0.7 mph was introduced which was measured using a hot-wire anemometer.
The welding parameters for this section of trials are shown in Table 3.
Shielding Gas Flow Rate
(L/min)
Electromagnetic Gas Saving
Device
Voltage (V)
Current (A)
Travel Speed (mm/s)
[image:7.595.123.533.159.331.2]Heat Input (J/mm) 15 No 23.7 189 6 746.55 Yes 23.4 186 6 725.40 12 No 23.7 188 6 742.60 Yes 23.6 180 6 708.00 9 No 23.7 181 6 714.95 Yes 23.6 183 6 719.80 6 No 23.7 186 6 734.70 Yes 23.6 189 6 743.40
Table 3: Weld parameters – stitch welds
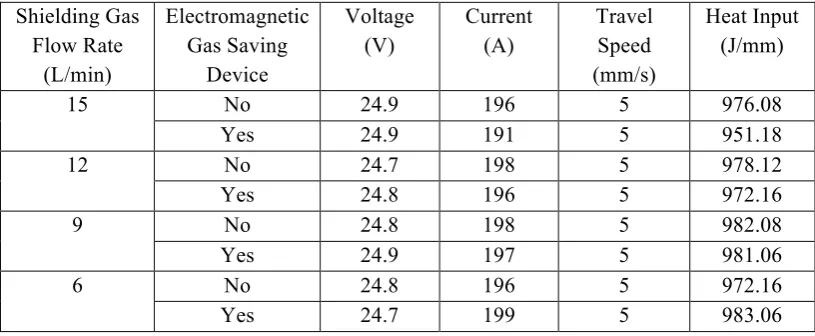
Finally, butt welds were performed using 1.2 mm flux cored filler wire on 4 mm thick plate in the form of 250 x 500 mm plates with square edge prep, a 3 mm root gap and a ceramic backing strip positioned on the underside of the weldment. Several industries are moving towards thinner, stronger material in order to reduce the overall mass of the structure; therefore 4 mm plate was selected in order to accentuate any distortion related effects. Again, an automatic welding rig, which held the plate rigid upon four corner locating points whilst moving at a pre-set speed under a stationary welding torch was used to automate the welding process. The rig also used an optical distance sensor that scanned the plate before welding and after a cooling period, the difference between the measurements being the weld induced distortion. The four corner locating points were calibrated using the optical distance sensor, resulting in zero deformation at each of these locations. Thermal data was captured using K-type thermocouples at the mid-point of the plate, between 10 and 50 mm from the weld centreline, in 10 mm increments. A symmetrical temperature distribution was assumed and therefore thermocouples were located on one side of the weld centre line only.
Shielding Gas Flow Rate
(L/min)
Electromagnetic Gas Saving
Device
Voltage (V)
Current (A)
Travel Speed (mm/s)
[image:8.595.123.531.70.238.2]Heat Input (J/mm) 15 No 24.9 196 5 976.08 Yes 24.9 191 5 951.18 12 No 24.7 198 5 978.12 Yes 24.8 196 5 972.16 9 No 24.8 198 5 982.08 Yes 24.9 197 5 981.06 6 No 24.8 196 5 972.16 Yes 24.7 199 5 983.06
Table 4: Weld parameters – butt welds
Results and Discussion
Fillet Weld Trials
In order to assess any effects the shielding gas flow rate and control method have on the weld quality and geometry, a metallographic analysis was performed on a cross-section from each weld.
The defect percentage was determined through the analysis of numerous images from around the weld metal. Image analysis software (ImageJ) was used to
determine the percentage of the image that exhibited a shade contrast to that of the bulk material and these contrasts were assumed to contain a mixture of micro-porosity, metallic and non-metallic inclusions, therefore allowing the ‘cleanliness’ of the weld to be quantified as a function of the flow rate.
The defect percentage, as determined through image analysis, is depicted in Figure 1. As can be noted, all shielding gas flow rates produced ‘clean’ welds; the defect levels present would not be detrimental to the overall weld quality.
Figure 1: Weld metal impurity level
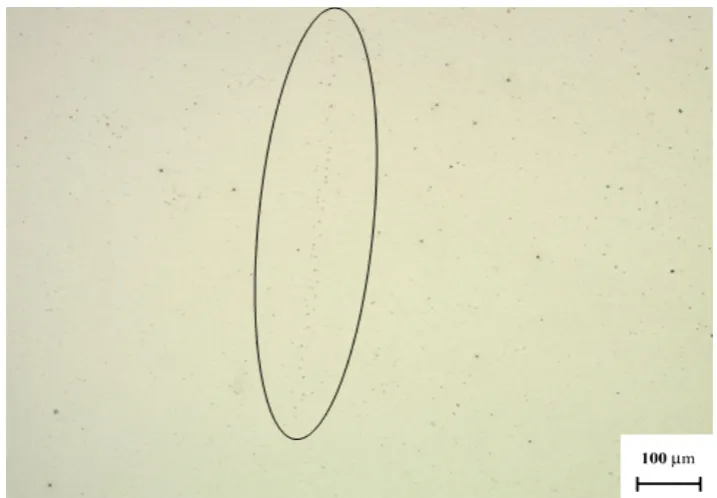
A typical microrgraph is shown in Figure 2, and, as can be noted, all impurities are well dispersed and of the 2-3 µm range and do not generally create issues related to quality. A noticeable feature of the image shown, which has been highlighted, is a line of fine impurities and is indicative of swirling in the molten metal and could be a consequence of the pulsing effect of the electromagnetic gas saving device, explained previously and likened to the alternating shielding gas process.
Figure 2: Weld micrograph produced using electromagnetic gas saving device showing fine line of impurities
0 0.02 0.04 0.06 0.08 0.1 0.12 0.14 0.16 0.18
15 12 9 6
Pe
rc
en
ta
ge
Im
pu
rit
y
(%)
Shielding Gas Flow Rate (L/min)
Impurity level
Conven0onal Flowmeter
[image:9.595.147.506.485.734.2]Micro hardness tests were performed on each sample using a 0.2 kg weight. Measurements were taken on two axes from the weld cap, vertically through the base plate and horizontally through the upright plate, in 1 mm increments in order to ensure local work hardening does not influence the determined hardness. In doing so, a direct comparison between shielding gas flow rate and also the effect of using an electromagnetic gas saving device could be obtained.
The effect of the shielding gas flow rate is insignificant in both the weld metal and heat affected zone (HAZ); the weld metal has a mean hardness of 209.25 Hv and a standard deviation of 5.44 (2.6%) whilst the HAZ has a mean hardness of 215.13 Hv and a standard deviation of 6.01 (2.8%).
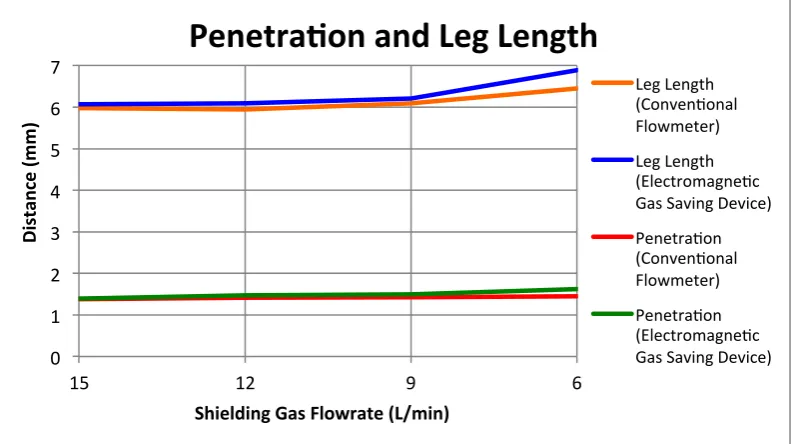
As can be seen in Figure 3, the shielding gas flow rate has very little effect on the depth of penetration or leg length. However, a marginal increase in both is found with a reduction in flow rate, a flow rate of 6 L/min has been shown to increase penetration and leg length by approximately 5% and 8% respectively when compared to the 15 L/min base case. This is in agreement with a similar study [11] in which an excessive shielding gas flow rate resulted in poor weld penetration. This indicates that the shielding gas flow rate influences how
efficiently the heat is transmitted to the weld metal and therefore suggests that the welding travel speed could be increased while maintaining specific weld
[image:10.595.130.526.507.729.2]geometries.
Figure 3: Weld penetration and leg length 0
1 2 3 4 5 6 7
15 12 9 6
Di
st
an
ce (
mm)
Shielding Gas Flowrate (L/min)
PenetraAon and Leg Length
Leg Length (Conven0onal Flowmeter)
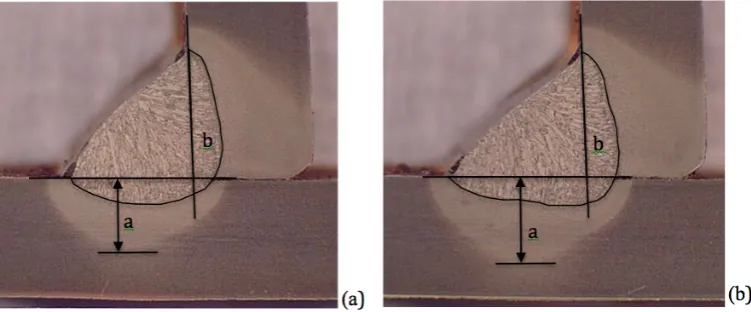
The electromagnetic gas saving device has been shown to increase the level of penetration and leg length when compared to manually setting the gas flow rate with a conventional flowmeter. The penetration has been increased by between 1 and 11%, whilst leg length has been increased by between 2 and 6% when compared to using a conventional flowmeter to control the gas flow rate, a comparison can be seen in Figure 4 and shows a visual difference in penetration. The area of penetration produced using a conventional flowmeter was 13.3 mm2 and increased to 15.0 mm2 when implementing the electromagnetic gas saving device. In addition, the depth of the HAZ in the base plate has increased by approximately 15% when using the electromagnetic gas saving device. Theses increases when compared to a conventional flowmeter could be attributed to the pulsing of the gas supply, which would generate a pressure impulse similar to that seen in the alternating gas method. Again, this could permit an increase in travel speed.
Figure 4: Weld geometry variation using (a) a conventional flowmeter and (b) an electromagnetic gas saving device
Where: a - Depth of HAZ
b - Area of weld metal penetration
shielding gas flow rate using a conventional flowmeter. This saving appears to be primarily linked to the quicker response of the valve at weld termination.
Figure 5: Shielding gas savings – fillet welds
Bead on Plate Stitch Weld Trials
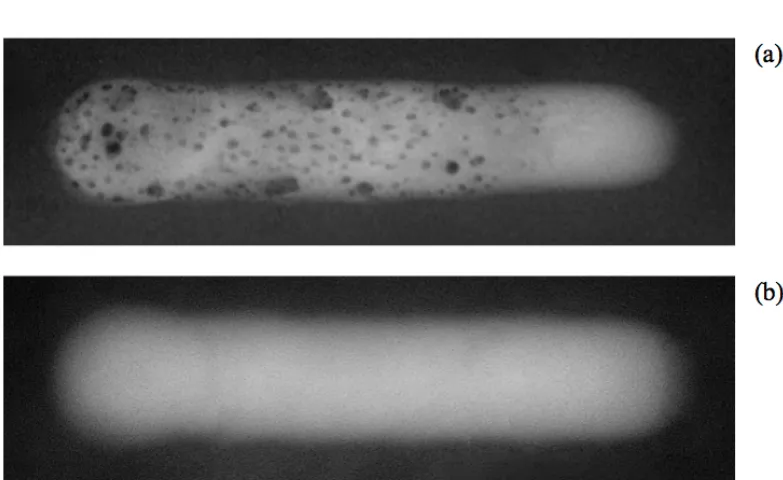
It was assumed that weld visual inspection would not provide sensitive enough results and therefore radiographic examination was performed due to its’ ability to detect discontinuities through the thickness of the weld. A grading system was developed to categorise the quality levels of the weld deposit; the system allowed for clean welds free from imperfections to pass, isolated (free from harmful) imperfections would return a borderline result whilst welds with greater defect levels would fail. The results of the radiographic examinations are shown in Table 5, examples of the radiographic films are shown in Figure 6. As can be seen, all welds with a shielding gas flow rate of 9 L/min or greater produced defect free welds, which would pass industrial testing. The 6 L/min case failed both with and without the electromagnetic gas saving device, this has been attributed to the 0.7 mph induced cross draft. This created a shielding gas flow rate to cross draft speed ratio of 8.5, which is in correlation with the critical ratio of approximately 10 which has been reported to cause failure due to porosity [21].
0 10 20 30 40 50 60
15 12 9 6
Pe
rc
en
ta
ge
S
av
in
g
(%)
Shielding Gas Flow Rate (L/min)
Savings vs. 15L/min base case
Conven0onal Flowmeter
Shielding Gas Flow Rate (L/min)
Electromagnetic Gas
Saving Device X-ray Result 15 No Clear (Pass) Yes Clear (Pass) 12 No Clear (Pass) Yes Clear (Pass)
9 No Clear (Pass)
Yes Clear (Pass) 6 No Heavy Porosity (Fail)
[image:13.595.152.502.70.226.2]Yes Heavy Porosity (Fail)
Table 5: X-ray results
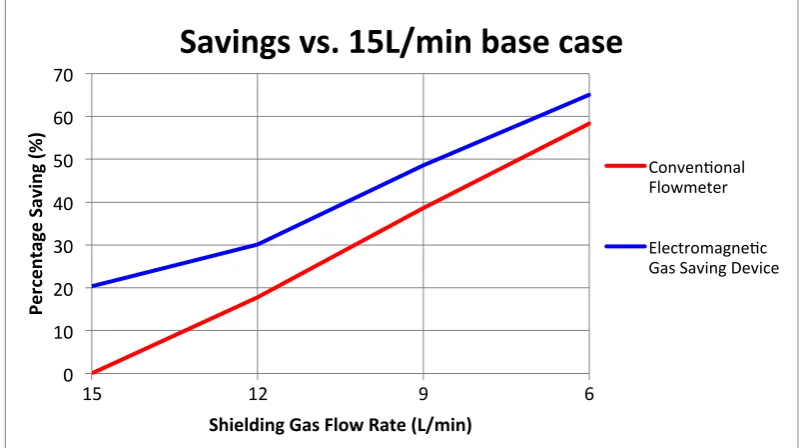
Figure 6: Radiographic film for (a) 6 L/min (fail) and (b) 9 L/min (pass) The potential savings compared to a conventional flowmeter manually set to a flow rate of 15 L/min is depicted in Figure 7. In addition, the electromagnetic gas saving device has been shown to further reduce the shielding gas consumption; savings of approximately 20% have been found whilst maintaining a shielding gas flow rate of 15 L/min compared to the conventional flowmeter supply. Plots of current vs. time and gas flow rate vs. time are shown in Figure 8 (a-c). The periods of time when the current falls to zero (Figure 8 (a)) corresponds to the weld down time between stitch welds, and is a constant regardless of the shielding gas control method. The primary reason for the savings produced using the
electromagnetic gas saving device has again been linked to the more rapid response of the valve. Using a conventional flowmeter (Figure 8 (b)), the
[image:13.595.130.522.247.487.2]consumes unnecessary gas i.e. whilst no welding is taking place. Conversely, with the electromagnetic gas saving device installed (Figure 8 (c)), the rapid response of the valve meant that the unit was able to purge the line ready to start welding again before shutting off completely. The aforementioned mechanical anti-surge device was also subjected to the stitch weld trials and in this case the performance was found to be equivalent to that of the conventional flowmeter, (Figure 8 (b)) in that the shielding gas does not shut off between welds.
Figure 7: Shielding gas savings – stitch welds 0
10 20 30 40 50 60 70
15 12 9 6
Pe
rc
en
ta
ge
S
av
in
g
(%)
Shielding Gas Flow Rate (L/min)
Savings vs. 15L/min base case
Conven0onal Flowmeter
Figure 8: Welding monitor plots of (a) current vs. time, (b) shielding gas vs. time (conventional flowmeter) and (c) shielding gas vs. time (electromagnetic gas
saving device) Butt Weld Trials
detrimental heating affect on the welding torch and nozzle, as the forced convection generated by the shielding gas is responsible for the cooling mechanism of each component.
Shielding Gas Flow Rate (L/min)
Conventional Flowmeter
Electromagnetic Gas Saving Device
15 630 659
12 646 680
9 720 732
[image:16.595.143.503.133.236.2]6 743 789
Table 6: Peak temperatures
As expected, all plates deformed to a classical saddle-like shape due to
longitudinal and transverse shrinkage. Figure 9 shows the longitudinal distortion (averaged for all shielding gas flow rates) along the length of the plate, adjacent to the weld. As can be seen, the distortion experienced by welds carried out with the electromagnetic gas saving device installed have experienced a greater level of longitudinal shrinkage and this is attributed to a greater peak temperature in the plates. A similar relationship has also been found between the longitudinal distortion and shielding gas flow rate; a lower flow rate resulting in greater distortion. Analogous trends have also been produced for transverse distortion, although the distortion difference with and without the electromagnetic gas saving device is not so evident.
Figure 9: Longitudinal distortion -‐8
-‐7 -‐6 -‐5 -‐4 -‐3 -‐2 -‐1 0
Di
st
orAo
n (
mm)
Longitudinal DistorAon
Conven0onal Flowmeter
Electromagne0c Gas Saving Device
[image:16.595.129.527.488.712.2]A correlation can therefore be drawn between the peak temperature and distortion in the butt welds, and the level of penetration in the fillet welds, which show that a reduction in shielding gas flow rate increases peak temperature, distortion and penetration. As a consequence, this implies that the travel speed would need to be increased to obtain an equivalent level of distortion and geometry as the 15 L/min base case. This increase in travel speed would also reduce the exposure time to the extreme temperature of the arc column and therefore bring the peak temperature back into line with the base case.
[image:17.595.126.527.397.621.2]The potential savings compared to a conventional flowmeter manually set to a flow rate of 15 L/min is depicted in Figure 10. Savings of approximately 60% can be obtained by reducing the shielding gas flow rate to 6 L/min. The difference in gas consumption for welds produced with and without the electromagnetic gas saving device has reduced to 3-4%, the increased weld length has meant that the gas used at weld initiation and termination has a lower percentage influence on the overall gas consumption.
Figure 10: Shielding gas savings – butt welds
Conclusions
Experimental trials have shown that the shielding gas flow rate can be effectively reduced, in a draft free environment, to 6 L/min resulting in approximately 50% savings in gas cost in comparison to the 15 L/min base case, and without
detriment to quality. 0
10 20 30 40 50 60 70
15 12 9 6
Pe
rc
en
ta
ge
S
av
in
g
(%)
Shielding Gas Flowrate (L/min)
Savings vs. 15L/min base case
Conven0onal Flowmeter
As expected, a lower flow rate is more susceptible to cross drafts as highlighted in the stitch weld trials. However, even in the presence of a light draft, good quality welds can be produced with shielding gas flow rates down to 9 L/min; reducing shielding gas consumption by approximately 40%. It is anticipated that ‘clean welds’ would have been produced for each flow rate in a draft free environment, as was the case in the fillet and butt weld trials which would further increase the potential savings.
Furthermore, it was found that the electromagnetic gas saving device produced additional savings when compared to a conventional flowmeter; this has primarily been linked to the rapid response of the electromagnetic valve. The shielding gas consumption at weld termination due to the valve response is a constant regardless of the weld length, and consequently the greatest savings are produced over shorter weld lengths, e.g. stitch welds, where shielding gas consumption can be reduced by 20% without reducing the gas flow rate. Concurrently, as the weld length increases, the shielding gas used at shut-off has a diminishing percentage effect on the overall savings.
An increase in penetration, distortion and peak temperature with a decrease in shielding gas flow rate was found which indicates that the heat transfer efficiency is increased for a lower flow rate.
References
1. Campbell, S.W., Galloway, A.M., McPherson, N.A. Artificial Neural Network Prediction of Weld Geometry Performed Using GMAW with Alternating Shielding Gases. Welding Journal, Under Review.
2. Campbell, S.W., Galloway, A.M., McPherson, N.A. Techno-Economic Evaluation on the Effects of Alternating Shielding Gases for Advanced Joining Processes. Proceedings of IMechE Part B: Journal of Engineering Manufacture, In Press.
3. Campbell, S.W., Galloway, A.M., McPherson, N.A., Gillies. A. Evaluation of Gas Metal Arc Welding with Alternating Shielding Gases for use on AA6082T6. Proceedings of IMechE Part B: Journal of Engineering Manufacture, Under Review.
4. Chang, Y. H. (2006) Improve GMAW and GTAW with Alternating Shield Gases.
Welding Journal, 85(2): p41-43.
5. Kang, B.Y., Prasad, Y.K.D.V., Kang, M.J., Kim, H.J., Kim, I.S. (2009)
Characteristics of Alternate Supply of Shielding Gas in Aluminium GMA Welding.
Journal of Materials Processing Technology, 209: p4716-4121.
6. Kang, B.Y., Prasad, Y.K.D.V., Kang, M.J., Kim, H.J., Kim, I.S. (2009) The Effect of Alternate Supply of Shielding Gases in Austenite Stainless Steel GTA Welding.
Journal of Materials Processing Technology, 209: p4722-4127.
7. Marya, M., Edwards, G. R., and Liu, S. (2004) An Investigation on the Effects of Gases in GTA Welding of a Wrought AZ80 Magnesium Alloy. Welding Journal,
83(7): p203-212.
8. Tani, G., Campana, G., Fortunato, A., Ascari, A. (2007) The Influence of
Shielding Gas in Hybrid Laser-MIG Welding. Applied Surface Science, 253:
p8050-8053.
9. Galloway, A.M., McPherson, N.A., Baker, T.N. (2011) An Evaluation of Weld Metal Nitrogen Retention and Properties in 316LN Austenitic Stainless Steel. Journal
of Materials: Design and Applications, 225(2), pp. 61-69.
10. Gillies, A., Galloway, A.M., McPherson, N.A. (2011) Helium Additions to MIG Shielding Gas - An Economic Option? Welding and Cutting, 10(2), pp. 118-121.
11. Loxton Industries. (2010) New Welding Gas Innovation. Australasian Welding Journal, 55(1), pp. 10-11.
12. Uttrachi, G.D. (2007) GMAW Shielding Gas Flow Control Systems. Welding Journal, 86(4), pp. 22-23.
13. Skovfo, J.L., Jørgensen, A.H. (2011) Optimizing Gas Usage in Arc Welding. Presented at JOM 16 Conference, May 2011, Helsingø.
14. Goldsberry, C. (2008) Preventing Shielding Gas Waste can Boost the Bottom Line. Welding Design and Fabrication, 81(1), pp. 22-23.
16. Standifer, L.R. (2000) Shielding Gas Consumption Efficiency. The Fabricator, 30(6).
17. Stauffer, H.V. (1982) Apparatus and Method for Reducing the Waste of Welding Gas. US Patent Number 4,341,237.
18. Hanby, S.K. (2002) Apparatus and Method for Preventing Gas-Surge in a Welding Gas Delivery System. US Patent Number 6,390,134,B1.
19. Uttrachi, G.D. (2003) Welding Shielding Gas Saver Device. US Patent Number 6,610,957,B2.
20. Uttrachi, G.D. (2006) Welding Shielding Gas Saver Flow-Control Device. US Patent Number 7,015,412,B1.