Security Metrics for the Android Ecosystem
Daniel R. Thomas
Alastair R. Beresford
Computer Laboratory University of Cambridge Cambridge, United Kingdom
[email protected]
Andrew Rice
ABSTRACT
The security of Android depends on the timely delivery of updates to fix critical vulnerabilities. In this paper we map the complex network of players in the Android ecosystem who must collaborate to provide updates, and determine that inaction by some manufacturers and network operators means many handsets are vulnerable to critical vulnerabil-ities. We define the FUM security metric to rank the per-formance of device manufacturers and network operators, based on their provision of updates and exposure to critical vulnerabilities. Using a corpus of 20 400 devices we show that there is significant variability in the timely delivery of security updates across different device manufacturers and network operators. This provides a comparison point for purchasers and regulators to determine which device man-ufacturers and network operators provide security updates and which do not. We find that on average 87.7% of An-droid devices are exposed to at least one of 11 known critical vulnerabilities and, across the ecosystem as a whole, assign a FUM security score of 2.87 out of 10. In our data, Nexus devices do considerably better than average with a score of 5.17; and LG is the best manufacturer with a score of 3.97.
Categories and Subject Descriptors
Security and privacy [Systems security]: Operating sys-tems security—Mobile platform security; Security and pri-vacy [Systems security]: Vulnerability management
General Terms
Security, Measurement, Economics
Keywords
Android; updates; vulnerabilities; metrics; ecosystems
Permission to make digital or hard copies of all or part of this work for personal or classroom use is granted without fee provided that copies are not made or distributed for profit or commercial advantage and that copies bear this notice and the full citation on the first page. Copyrights for components of this work owned by others than the author(s) must be honored. Abstracting with credit is permitted. To copy otherwise, or republish, to post on servers or to redistribute to lists, requires prior specific permission and/or a fee. Request permissions from [email protected].
SPSM’15,October 12, 2015, Denver, Colorado, USA.
Copyright is held by the owner/author(s). Publication rights licensed to ACM. ACM 978-1-4503-3819-6/15/10 ...$15.00.
DOI: http://dx.doi.org/10.1145/2808117.2808118.
1.
INTRODUCTION
All large software systems today contain undiscovered se-curity vulnerabilities. Once discovered, these flaws are of-ten exploited, and therefore the timely delivery of security updates is important to protect such systems, particularly when devices are connected to the Internet and therefore can be exploited remotely. Manufactures and software com-panies have known about this issue for many years and are expected to provide regular updates to protect their users. For example, Windows XP could be purchased for a one-off payment in October 2001 and received monthly security updates until support ended in April 2014.
Unfortunately something has gone wrong with the
pro-vision of security updates in the Android market. Many
smartphones are sold on 12–24 month contracts, and yet our data shows few Android devices receive many security updates, with an overall average of just 1.26 updates per year, leaving devices unpatched for long periods of time.
In order to improve our understanding, we need to know more about the Android ecosystem as a whole. It is a com-plex system with many parties involved in a long multi-stage pipeline [18]. We map and quantify the major players in this space who must collaborate to provide updates (§4) and de-termine that inaction (§5.3) by some of the manufacturers and network operators means many handsets are vulnerable to critical vulnerabilities. Understanding this ecosystem is all the more important because device manufacturers have introduced additional vulnerabilities in the past [17].
Corporate and public sector buyers are encouraged to pur-chase secure devices, but we have found little concrete guid-ance on the specific makes and models providing timely se-curity updates. For example, CESG, which advises the UK government on how to secure its computer systems, recom-mends picking Android device models from device manu-factures that are good at promptly shipping security up-dates, but it does not state which device manufacturers these are [5] and so far they have only certified one Android device model [6]. Similarly, we are collaborating with a FTSE 100 company who wish to know which devices are secure and which manufacturers provide updates.
the proportion of running devices free from critical vulner-abilities over time;uthe proportion of devices that run the latest version of Android shipped to any device produced by that device manufacturer; andmthe mean number of out-standing vulnerabilities affecting devices not fixed on any device shipped by the device manufacturer. We then derive a composite FUM score which is hard to game (§5.7).
The FUM score enables corporate and public sector buy-ers, as well as individuals, to make more informed purchasing decisions by reducing the information asymmetry. The FUM score also supports better regulation, and indeed there is on-going legal action to force network operators to ship updates for security vulnerabilities [23]. We will continue to provide updated versions of our FUM scores on our website [25].
In summary, the contributions of this paper are:
• We quantify the Android update process, providing
concrete numbers on the flow of updates and their la-tency (§4).
• We propose the FUM scoring metric to evaluate the
security of different instances of a platform (§5.1).
• We measure the security of Android against our scor-ing metric and compare different device manufactur-ers, device models and network operators to allow de-vice purchasers to differentiate between them based on security (§5.2).
• We determine that the main update bottleneck lies
with manufacturers rather than Google, operators or users (§5.3).
We indicate the uncertainty in our results by presenting them±one standard deviation and give results to 3 s.f., this occasionally results in ‘±0’ when the standard deviation is small. We explore systematic errors in§6.
2.
THREAT MODEL
In this paper we are concerned with vulnerabilities which allow an attacker without physical access to the smartphone to gain significant permissions (such as root-level access) which are not available to a standard app running on the device. We consider three attack vectors which can be used as a starting point to launch an attack on a device.
The installation attack vector is used when a malicious app is installed on the device. Android devices can install apps through marketplaces such as the Google Play Store, email attachments, URLs and via the Android Debug Bridge (ADB). By default, many Android devices will only allow the installation of apps from the Play Store, which auto-matically analyses apps, and quickly takes down apps that are reported as malicious. However, alternative markets are also popular, particularly in countries where the Play Store is not available.
Thedynamic code loading attack vector occurs when an existing app downloads and executes new code at runtime. The most direct method is to upload a seemingly innocent app to a marketplace that then dynamically loads malicious code, either as additional davik bytecode, as a native library, or by embedding an interpreter and executing received in-structions. Neither static nor dynamic analysis of this app will uncover any malicious code, since it does not exist in the app. The marketplace can try to detect explicit use of
dynamic code loading, however there are ways to dynami-cally load code which are hard to detect even on a platform such as iOS, which does not permit dynamic code loading. For example, a Return-Oriented Programming (ROP) at-tack on iOS is relatively easy if the atat-tacker creates an app with carefully crafted flaws [30].
Theinjectionattack vector occurs when the attacker in-jects malicious code directly into existing code already run-ning on the handset. For example, the addJavascriptInter-face vulnerability (CVE-2012-6636) allows an attacker to in-ject JavaScript into HTTP traffic destined for the device and execute arbitrary code with all the privileges of the app. The fix for this vulnerability breaks backwards compatibility and requires a two-sided fix. While the fix was released in De-cember 2012, by June 2015, 25.7% of handsets connecting to the Play Store were still vulnerable to this attack [27].
Security for the Android ecosystem can be deployed at three levels: in an online marketplace, at app installation time on the device, and during app execution. Google pro-vides its users with security in all these places: through analysis of apps by the Play Store, using the Verify Apps feature on the smartphone at installation time, and by an app sandbox on the smartphone during execution. The best place to prevent attacks is by sandboxing the app during execution, since all three attack vectors can be prevented at this level, whereas not all users install apps exclusively via the Play Store or enable Verify Apps. In addition, dynamic code loading and injection attacks cannot be discovered at installation time and can be difficult for a marketplace to detect. Unfortunately, as we shall see, the security sandbox for Android has known critical vulnerabilities on most de-vices. This does not mean these devices are attacked, but that they are vulnerable. The likelihood of a successful at-tack then depends on what apps the user installs and where from, as well as the computer networks the device is con-nected to and the actions the user takes whilst concon-nected.
3.
DATA
We use two sources of data to measure the security of An-droid: (1) information on the critical vulnerabilities found to affect particular versions of Android and (2) information on the distribution of Android versions over time. These two datasets can then be combined to determine the proportion of devices at risk of attack from specific vulnerabilities.
3.1
Critical vulnerabilities
We built a list of critical Android vulnerabilities for our AndroidVulnerabilities.org (AVO) website [25]. The site con-tains 32 critical vulnerabilities such as root vulnerabilities that do not require USB debugging to exploit. We have chosen 11 vulnerabilities as shown in Table 1 for our analy-sis in this paper. We selected these vulnerabilities since they fit the attack vectors introduced in§2 and because they af-fect all Android devices regardless of manufacturer, and as a result our selected vulnerabilities will dominate any se-curity analysis of Android. Hence, with our chosen set of vulnerabilities, our analysis represents a lower-bound on the vulnerability of devices in the Device Analyzer data.
Some critical vulnerabilities are not traditional kernel vul-nerabilities, but exploit the installation attack vector in
our threat model. For example improper verification of
Vulnerability How known Date Categories KillingInTheNameOf Fixed 2010-07-13 sys, kern exploid udev Discovered 2010-07-15 kernel levitator Discovered 2011-03-10 kernel Gingerbreak Fixed 2011-04-18 system zergRush Discovered 2011-10-06 system APK duplicate file Discovered 2013-02-18 signature APK unchecked name Discovered 2013-06-30 signature APK unsigned shorts Fixed 2013-07-03 signature vold asec Fixed 2014-01-27 system Fake ID Fixed 2014-04-17 signature TowelRoot Discovered 2014-05-03 kernel
Table 1: Critical vulnerabilities in Android
with system keys and hence be granted system privileges. On versions of Android below 4.1, malware could then use known system-to-root escalation mechanisms. Regardless of version, this exposed an increased attack area and would also provide the ability for malware to control all user inter-net traffic (via VPNs), brick the phone, remove and install apps, steal user credentials and read the screen. The differ-ent categories in which the vulnerabilities fall are shown in Table 1. The ‘signature’ vulnerabilities require an installa-tion attack, while ‘kernel’ and ‘system’ vulnerabilities can be used together with aninstallation,dynamic code loading
orinjectionattack vector.
3.2
Device Analyzer data
We use historical data collected by the Device Analyzer project [29]. Device Analyzer collects data1from study par-ticipants who install the Android app from the Play Store. Most study participants allow external researchers to access the subset of the device data needed for this analysis.
We extracted the build string and API version for each device each day. The build string is a user-readable version string and the API version is a positive integer that increases when new features are added to the API. Consequently se-curity (bug) fixes do not always result in a change in the API version. Fortunately most (99.9%) entries in these data have a build string of the form ‘x.y.z opaque marker’ and so it is possible to extract the Android version number ‘x.y.z’. On a large proportion of devices ‘opaque marker’ is a well defined build number2however this is not universal.
Device Analyzer has collected data from 20 400 devices with a total of 1 330 000 device days. The majority of devices only contribute data for a short period of time, however 2 110 devices have contributed data for more than 6 months. We verify that the Device Analyzer data is representative in§6.
4.
ANDROID ECOSYSTEM
There is a complex Android ecosystem that creates and distributes updates which fix vulnerabilities. In this section we describe how the Android ecosystem functions and how Android versions are produced, using Device Analyzer data and by analysing the Android source code and upstream projects. We quantify the number of updates shipped by various entities in the ecosystem and the number of entities. To understand how vulnerabilities in Android are fixed
1https://deviceanalyzer.cl.cam.ac.uk/collected.
html
2https://source.android.com/source/build-numbers.
html
Upstream open source projects
other projects (176)
59 6
618
(301) 28
1 270
OpenSSL BouncyCastle
Google Hardware
developer
Device (20 400)
(1 460)
Linux
Device manufacturer
[image:3.612.55.298.52.163.2]Network operator
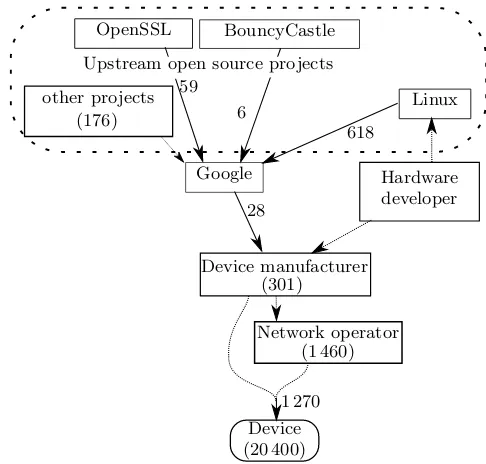
Figure 1: Flow of updates between participants in the
Android ecosystem. Numbers on edges indicate updates
shipped between July 2011 and July 2015, those in brackets represent number of such entities. Dotted arrows indicate flows where we can’t measure because no public data is avail-able.
Project # releases latency (days)
linux 618 137±48
openssl 59 120±55
bouncycastle 6 239±78
Table 2: Flow of updates from upstream projects into An-droid. Number of updates as in Figure 1, latency in days between the upstream release and the release of the first An-droid version containing it, for all pairs of versions we have data on.
we examine the Android update process, which we model in Figure 1. There are five entities or groups that con-tribute towards Android updates: the network operators, the device manufacturers, the hardware developers, Google
and the upstream open source projects. Android builds
on various open source projects, such as the Linux kernel, OpenSSL and BouncyCastle cryptography libraries. Con-sequently Android can include any compatible versions of those projects, including those that fix security vulnerabili-ties. Android also incorporates various drivers for different bits of hardware. The Android platform is then built from these components by Google. The code for each Android re-lease or update is kept secret until after a binary rere-lease has been published.3 Device manufacturers receive advanced access in order to prepare handsets. The network operator may then make or request customisations and perform test-ing before shipptest-ing the update to the device. Sometimes device manufactures ship updates directly to the user with-out involving the network operator. Sometimes the device manufacturer and Google collaborate closely to make a
par-3
[image:3.612.345.525.367.412.2]ticular phone, such as with Nexus devices and so Google ships directly to the device. Sometimes device manufactur-ers incorporate upstream open source project releases di-rectly, and sometimes incorrectly – for example previous work has recorded evidence of broken nightly builds of sqlite in Android releases on some device models [29].
The numbers of devices (20 400), network operators (1 460) and device manufacturers (301) in Figure 1 come from the Device Analyzer data. Device manufacturer and network operator counts were obtained by normalising the results reported by Android to Device Analyzer of the device man-ufacturer and active network operator. This normalisation is a manual task that involves removing invalid values (such as ‘manufacturer’ or ‘airplane mode is on’), collating across company name changes (e.g. ‘lge’ to ‘LG’), normalising punc-tuation, removing extra strings sometimes added such as (‘(2g)’ or ‘communications’) and mapping some incorrectly placed model names back to their manufacturer. This nor-malisation is not perfect so these are likely overestimates on the Device Analyzer data. We believe they nevertheless are likely to underestimate the total number of device manufac-turers and network operators worldwide.
In Figure 1 the number of updates received by devices (1 270) is the number of different full version strings ob-served in Device Analyzer. The number of updates shipped by Google (28) is the number of Android versions reported in Device Analyzer that affected more than 1% of devices for more than 10 days. This significance test is to remove spurious versions recorded in Device Analyzer such as ‘5.2.0’ in 2012 which had still not been released at time of writing. We extracted data on the external projects used in An-droid and have included this and the scripts which generated it in AVO. These scripts analysed the Android Open Source Project’s source tree to examine the source code of each of the external projects to find the project version associated with each Android version tag on the repository. There are 176 external open source projects in Android, contributing 25 Million lines of code. We analysed the top 40 by lines of code (99.7% of the total) and were able to automatically extract the versions of those projects included in different versions of Android for 28 of these (24.9% of the total). We found 72 distinct versions, a median of 2.0 and mean of 2.57±1.84 versions per project. Android rarely changes the version of external projects it includes.
To compute the latency between upstream releases and the release of the first version of Android containing that release we scraped the release pages, to obtain the version numbers and release dates. This allows us to compute the latency between an upstream project being released and it being included in Android; this is shown in Table 2. The versions included in Android were about half a year old when the first version of Android containing it was released.
5.
SECURITY METRICS
To allow buyers of Android devices to purchase those de-vices with the best security, they need to know how different device manufacturers, device models and network operators compare in terms of security. We propose a method to score a device manufacturer, device model or network operator based on its historic performance at keeping devices up-to-date and fixing security vulnerabilities. We find that An-droid as a whole gets a score of 2.87±0.0 out of 10, the
Dec 2011 Jun 2012 Dec 2012 Jun 2013 Dec 2013 Jun 2014 Dec 2014 Jun 2015
0.0 0.2 0.4 0.6 0.8 1.0
Proportion insecure
maybe secure
secure
[image:4.612.322.551.53.173.2]zergRush APK duplicate file vold asec
Figure 2: Proportion of devices running insecure, maybe secure and secure versions of Android. Table 1 lists the 11 vulnerabilities used, the red vertical lines are caused by their discovery and the most important are annotated.
highest scoring device manufacturer isLG (3.97±0.0) and the lowest scoring iswalton (0.272±0.007).
By combining data on critical vulnerabilities in Android and the versions of Android running on devices we can de-termine which vulnerabilities each device was vulnerable to each day. We consider a device isinsecure if it is running a vulnerable version of Android and the device has not re-ceived an update which might fix it; it is maybe secure if it is running a vulnerable version but received an update which could have fixed the vulnerability if it contained a backported fix; and it issecure if it is running a secure ver-sion. This allows us to plot Figure 2, initially all devices are
maybe secure (yellow) since Device Analyzer does not have historical data prior to May 2011. This means we cannot distinguish between devices which are running a version of Android which is known to be vulnerable from one which may have received a backported fix. This demonstrates the importance of a longitudinal study: this type of analysis requires years of data. OncezergRushwas discovered in Oc-tober 2011 then most devices are recorded asinsecure (red) as they were vulnerable. The remaining devices were already running a version of Android which fixed thezergRush vul-nerability and are therefore marked assecure(green). From October 2011 until the discovery of APK duplicate filein February 2013 the graph shows progressive improvement as
devices are upgraded or replaced. This means more and
more devices are marked as secure because they are now
running a secure version of Android, or marked as maybe secure because they received an OS update that did not up-date to a known-good version of Android but which may still have included a backport of a fix, as the update was made available after the vulnerability was disclosed. From Febru-ary 2013 onwards regular discovery of critical vulnerabilities ensures that most devices are vulnerable. Ignoring devices classed asmaybe secure, we find that on average 87.7±0.0% of devices were classed as insecure and 12.3% classified as
secure between July 2011 and July 2015.
5.1
Method: The FUM score
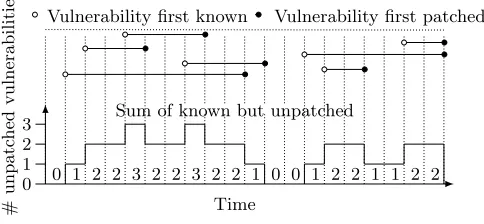
Vulnerability first known Vulnerability first patched
Time
Sum of known but unpatched
0 1 2 3
#
u
n
p
at
ch
ed
v
u
ln
era
b
ili
ties
[image:5.612.56.298.62.174.2]0 1 2 2 3 2 2 3 2 2 1 0 0 1 2 2 1 1 2 2
Figure 3: As vulnerabilities are discovered and patched the sum of known but unpatched vulnerabilities each day varies. From this we can calculatem= (0×3 + 1×5 + 2×10 + 3×2)/20 = 1.55 For comparison VFD = 0.15 and MAV = 2. Example based on the one given by Wright [32].
absence of such data we propose a scheme for assigning a device a score out of ten based on data that can be observed, is based on previous metrics, and that we expect correlates with the actual security of the devices.
The FUM score is computed from three components:
freef The proportion of running devices free from critical vulnerabilities over time. This is equivalent to Acer and Jackson’s proposal to measure the security based on the proportion of users with at least one unpatched critical vulnerability [1] and similar to the Vulnerabil-ity Free Days (VFD) score [32]. Unlike VFD, this is the proportion of running devices which were free from critical vulnerabilities over time, rather than the num-ber of days which the device manufacturer was free from outstanding critical vulnerabilities, as that does not take account of the update process.
updateu The proportion of devices that run the latest ver-sion of Android shipped to any device produced by that device manufacturer. This is a measure of internal up-datedness, so a low score would mean many devices are being left behind. This assumes that newer versions are better with stronger security. Historically, steps have been taken to improve Android security in newer versions so this assumption should generally hold, but sometimes new updates introduce new vulnerabilities.
meanm The mean number of outstanding vulnerabilities
affecting devices not fixed on any device shipped by the device manufacturer. This is related to the Me-dian Active Vulnerabilities (MAV) measure [32] but is the mean rather than the median, since this gives a continuous value. An example is given in Figure 3.
These three metrics f, u and m, together measure the security of a platform with respect to known vulnerabilities and updates.fis a key measure of the direct risk to users as if there is any known but unfixed vulnerability then they are vulnerable. However it does not capture the increased risk caused by there being multiple known vulnerabilities, which gives an attacker more opportunities and increases the likeli-hood of a piece of malware having a matching exploit. This is captured by themscore, which measures the size of the device manufacturers queue of outstanding vulnerabilities
but does not take into account the update process or mea-sure the actual end user security. Neither of these metrics capture whether devices are being left behind and not being kept up-to-date with the most recent (and hopefully most secure) version, which is captured byu.
We want to provide a score out of 10 as many other ratings are given as a score out of 10. Sincefis the most important metric we weight it more highly. Sincemis an unbounded positive real number, we map it into the range (0–1]. This gives us the FUM score:
FUM score = 4·f+ 3·u+ 3· 2
1 +em (1)
We can compute the uncertainty for f, u and m. f is computed by taking the total secure device days and divid-ing it by the total insecure and secure device days. The total secure device days and total insecure device days are both counting experiments and so their measurement error is their square root [24]. uis computed by taking the sum of the proportions of devices running the most recent version each day, both the count of devices running the maximum version and total count have square root uncertainties. mis computed by counting the number of vulnerabilities which affected that entity and which have not yet been fixed on any device we have observed from that entity every day and aver-aging time. However, it could be that the entity has released a fix to some devices but we have not yet observed a device with that fix. So the uncertainty in our measurement is the probability of not having observed a fixed device if a fixed device existed. We assume that if the fix has been released then at least 1.0% of devices have the fix. This represents a trade-off between a proportion so small that the fix has not really been deployed and a reasonable estimate of the error. This gives an uncertainty of 0.99nwherenis the number of devices contributing to that day’s data for each vulnerability
outstanding each day. The Pythonuncertainties library
was used to propagate uncertainties through calculations. This does not capture systematic errors. For example, we do not include manufacturer specific vulnerabilities, however we expect that performance in fixing manufacturer specific vulnerabilities is strongly correlated with performance fixing vulnerabilities affecting all of Android.
5.2
Results: Security scores
On average, between July 2011 and July 2015 we found 0.53±0.0 outstanding vulnerabilities not fixed on any device and 5.23±0.0% of devices to run the most recent version of Android. This gives a security score of 2.87±0.0 out of 10. However there are a wide variety of scores depending on the source of the device. There is anecdotal evidence that Google’s Nexus devices are better at getting updates than other Android devices because Google makes the original up-dates and ships them to its devices.4 Table 3 shows that this is the case with Nexus devices getting much better scores than non-Nexus devices.
Different device manufacturers have very different scores; Table 4 shows the scores for the 10 device manufacturers with a significant presence in our data withLG (3.97±0.0 out of 10) scoring highest and walton (0.272±0.007 out of 10) scoring lowest. Device manufacturers are considered
4http://www.howtogeek.com/139391/
significant if we have data from at least 100 devices and at least 10 000 days of contributions. Additionally, formand
uwe ignore the days with less than 20 devices contributing to that day’s score.
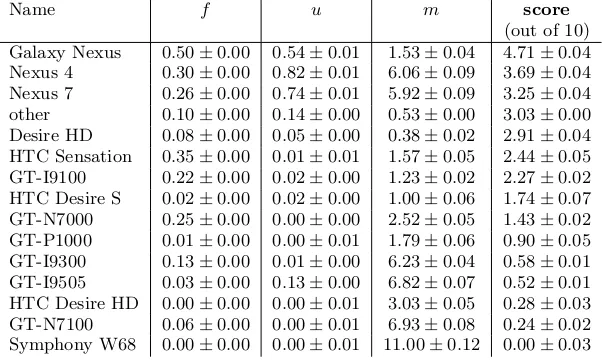
[image:6.612.322.548.53.139.2]Even within device manufacturers, different models can have very different update behaviours and hence security. Table 5 shows the results for the 18 device models which have a significant presence by the same metric withGalaxy Nexus (4.71±0.0 out of 10) scoring highest andSymphony W68(0.0001±0.0273 out of 10) scoring lowest. We can then test whether this seems fair by comparing the version data for the highest and lowest scoring models. Figure 4c shows the full version distribution for Symphony W68, which we only observe running one version. Figure 4b shows the full version distribution forHTC Desire HD A9191, which used to be our worst model and for which we have more historical data; it shows it received one update at the beginning of 2012, which was deployed fairly rapidly to most devices, but received no further updates. Figure 4a shows the same information for Galaxy Nexus which received 49 different versions, some of which were only deployed to small numbers of devices, but the distribution for all devices regularly and rapidly transitions from one version to another before ending
up on ‘4.3 JWR66Y’. BothGalaxy Nexus andHTC Desire
HD A9191device models start off with the full version string of ‘2.3.3 GRI40’ but theGalaxy Nexusreceives many more updates over the same time period. Other models from the same manufacturer with similar model names toHTC Desire HD A9191 do much better such as theDesire HD.
We also analysed the 14 network operators with a signif-icant presence in our data. Table 6 shows the results with
O2 uk (3.87±0.0 out of 10) scoring highest andbanglalink
(0.536±0.018 out of 10) scoring lowest. However, the score of a network operator is affected by the manufacturers of the devices which are in use on its network. This is in turn af-fected by both the device models a network operator offers to users and upon user’s choice of device models. Hence, having a worse score does not necessarily mean that a net-work operator is worse, it could be that its users all pick phones from a worse device manufacturer, for example, be-cause they were cheaper. A network operator could use data from this paper to exclude insecure devices from those
of-fered to consumers. An added value analysis of network
operators, which takes into account the device mix used by users of that network operator, would make it possible to de-termine whether a network operator is making the situation better or worse by the way it ships updates to users. How-ever our sample size is too small to do that because while we have significant numbers of devices for each of the 18 device models (Table 5) and for each of the 14 network operators (Table 6), we would need a significant number of each model in each network operator. Since the distribution of devices is unlikely to be uniformly distributed across device models and network operators we estimate that 100 000 unique de-vices are required each day for at least a year. This is not an unobtainable number but it is two orders of magnitude more than is available in Device Analyzer.
5.3
Update bottleneck
If update delays are due to the delay in manufacturers providing the update rather than in operators supplying the update and users installing the update, we would expect the update behaviour of devices with the same device model to
manufacturer model operator nexus
±σ 0.211 0.169 0.175 0.632
u 0.297 0.804 0.618 1.0
m 0.794 0.593 0.969 -1.0
f 0.83 0.775 0.934 1.0
weightu 0.939 0.996 0.991 1.0
weightm 0.976 0.964 0.996 1.0
equal 1.0 0.996 1.0 1.0
Table 7: Spearman Rank correlation coefficients for different metrics. The uncertainty is constant for each column but does not take into account the uncertainty in the score which produced the ranking.
be similar and rapid. We found that within 30 days of the first observation of a new version on a device, half of all devices of that model have the new version (or a higher ver-sion) installed, and within 324 days 95% of devices have the new version (or a higher version). This compares with the average rates of deployment for Android OS versions of 350 days for half and 1 100 days for 95%. There is a variation between device models, with the update being distributed to most devices quickly and others having a much slower roll out, but since some device models do update quickly the bottleneck is unlikely to be with the user. Perhaps some device models are preferred by users who are more likely to install updates than others, however we do observe updates being rolled out to device models quickly and user behaviour is not beyond the control of the device manufacturer. They could install updates automatically or pester the user into installing them, and at least some of them do pester, silent automatic updates do boost uptake [9].
5.4
Sensitivity of scoring metric
To evaluate whether the ranking of different manufactur-ers is sensitive to the form of the scoring metric we computed the normalised Spearman’s Rank correlation coefficient be-tween the lists ordered using different forms of the scoring metric, this is shown in Table 7. In the table, the ‘equal’ metric weightsf,uandmequally rather than favouring f
and makes little difference. Similarly weightinguormmore highly rather thanf makes little difference. While thef,u
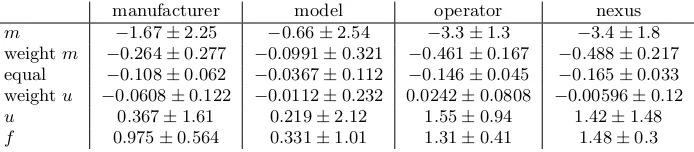
andmcomponents do have some correlation with the over-all FUM score, the rankings produced vary substantiover-ally. Changing the scoring metric also impacts the scores given for each entity Table 8 shows the mean impact on the scores. This shows thatmtends to drag down scores.
5.5
Utilitarianism
Name f u m score (out of 10) nexus 0.39±0.00 0.48±0.00 0.56±0.01 5.17±0.02 notnexus 0.10±0.00 0.02±0.00 0.53±0.00 2.70±0.00
Table 3: Security scores for nexus
Name f u m score
[image:7.612.171.445.57.103.2](out of 10) LG 0.22±0.00 0.33±0.00 0.62±0.01 3.97±0.02 Motorola 0.18±0.00 0.12±0.00 0.71±0.02 3.07±0.02 Samsung 0.13±0.00 0.04±0.00 0.61±0.00 2.75±0.00 Sony 0.14±0.00 0.19±0.00 1.09±0.02 2.63±0.02 HTC 0.14±0.00 0.10±0.00 0.87±0.01 2.63±0.02 asus 0.20±0.00 0.51±0.01 6.01±0.07 2.35±0.02 other 0.06±0.00 0.05±0.00 1.04±0.01 1.97±0.02 alps 0.03±0.00 0.19±0.01 3.99±0.08 0.80±0.02 Symphony 0.00±0.00 0.08±0.00 5.00±0.05 0.30±0.01 walton 0.00±0.00 0.09±0.00 6.00±0.08 0.27±0.01
Table 4: Security scores for manufacturers
Name f u m score
[image:7.612.167.442.132.267.2](out of 10) Galaxy Nexus 0.50±0.00 0.54±0.01 1.53±0.04 4.71±0.04 Nexus 4 0.30±0.00 0.82±0.01 6.06±0.09 3.69±0.04 Nexus 7 0.26±0.00 0.74±0.01 5.92±0.09 3.25±0.04 other 0.10±0.00 0.14±0.00 0.53±0.00 3.03±0.00 Desire HD 0.08±0.00 0.05±0.00 0.38±0.02 2.91±0.04 HTC Sensation 0.35±0.00 0.01±0.01 1.57±0.05 2.44±0.05 GT-I9100 0.22±0.00 0.02±0.00 1.23±0.02 2.27±0.02 HTC Desire S 0.02±0.00 0.02±0.00 1.00±0.06 1.74±0.07 GT-N7000 0.25±0.00 0.00±0.00 2.52±0.05 1.43±0.02 GT-P1000 0.01±0.00 0.00±0.01 1.79±0.06 0.90±0.05 GT-I9300 0.13±0.00 0.01±0.00 6.23±0.04 0.58±0.01 GT-I9505 0.03±0.00 0.13±0.00 6.82±0.07 0.52±0.01 HTC Desire HD 0.00±0.00 0.00±0.01 3.03±0.05 0.28±0.03 GT-N7100 0.06±0.00 0.00±0.01 6.93±0.08 0.24±0.02 Symphony W68 0.00±0.00 0.00±0.01 11.00±0.12 0.00±0.03
Table 5: Security scores for models
Name f u m score
(out of 10) O2 uk 0.27±0.00 0.12±0.00 0.37±0.02 3.87±0.03 T-Mobile 0.21±0.00 0.18±0.00 0.40±0.01 3.81±0.02 Orange 0.22±0.00 0.10±0.00 0.36±0.02 3.65±0.04 Sprint 0.18±0.00 0.11±0.00 0.43±0.02 3.42±0.03 3 0.20±0.00 0.09±0.00 0.47±0.02 3.39±0.03 Vodafone uk 0.14±0.00 0.13±0.00 0.52±0.03 3.17±0.04 AT&T 0.14±0.00 0.08±0.00 0.43±0.02 3.13±0.02 unknown 0.11±0.00 0.20±0.00 0.84±0.01 2.88±0.02 Verizon 0.19±0.00 0.09±0.00 0.82±0.02 2.84±0.02 n Telenor 0.04±0.00 0.12±0.00 1.21±0.02 1.89±0.02 Airtel 0.05±0.00 0.03±0.00 1.47±0.03 1.41±0.03 Grameenphone 0.00±0.00 0.04±0.00 1.88±0.02 0.94±0.01 Robi 0.00±0.00 0.08±0.00 2.07±0.04 0.91±0.03 banglalink 0.00±0.00 0.03±0.00 2.56±0.04 0.54±0.02
[image:7.612.155.456.306.486.2]Aug 2011 Feb 2012 Aug 2012 Feb 2013 Aug 2013 Feb 2014 Aug 2014 Feb 2015
Aug 2011 Feb 2012 Aug 2012 Feb 2013 Aug 2013 Feb 2014 Aug 2014 Feb 2015
0.0 0.2 0.4 0.6 0.8 1.0
P
roportion
2.3.3 GRI40
2.3.5 GRJ90
(b) HTC Desire HD A9191
4.4.4 KTU84Q
other
2.3.4
GRJ22
2.3.6 GINGERBREAD 2.3.7 GRJ22
4.0.1 ITL41F
4.0.2
ICL53F
4.0.3 IML74K 4.0.4 ICL53F
4.0.4 IMM30B 4.0.4 IMM30D
4.0.4 IMM76D
4.0.4 IMM76I 4.0.4 IMM76K
4.1 JRN84D
4.1.1
JRO03C
4.1.1 JRO03L
4.1.1 JRO03O
4.1.1 JRO03R 4.1.1 JRO03U
4.1.2 JZO54K
4.2 JOP40C
4.2.1 JOP40D 4.2.1 JOP40G
4.2.2
JDQ39
4.2.2 JDQ39E 4.3 JLS36G
4.3 JSS15J 4.3 JSS15Q 4.3 JWR66V
4.3 JWR66Y 4.3 JWR67B 4.3.1 JLS36I
4.4.2 KOT49H 4.4.2 KVT49L
4.4.3 KTU84M
4.4.4 KTU84P
(a) Galaxy Nexus
1.0
0.8
0.6
0.4
0.2
0.0
P
roportion
2.3.3
GRI40
Aug 2011 Feb 2012 Aug 2012 Feb 2013 Aug 2013 Feb 2014 Aug 2014 Feb 2015
0.0 0.2 0.4 0.6 0.8 1.0
P
roportion
[image:8.612.87.526.97.661.2]4.2.2 JDQ39 (c) Symphony W68
manufacturer model operator nexus
m −1.67±2.25 −0.66±2.54 −3.3±1.3 −3.4±1.8 weightm −0.264±0.277 −0.0991±0.321 −0.461±0.167 −0.488±0.217 equal −0.108±0.062 −0.0367±0.112 −0.146±0.045 −0.165±0.033 weightu −0.0608±0.122 −0.0112±0.232 0.0242±0.0808 −0.00596±0.12
u 0.367±1.61 0.219±2.12 1.55±0.94 1.42±1.48
[image:9.612.133.480.53.129.2]f 0.975±0.564 0.331±1.01 1.31±0.41 1.48±0.3
Table 8: Mean change in scores for different metrics
5.6
Scores over time
The scoring metric as originally computed, is averaged over the whole history of the device manufacturer, device model or network operator, it gives equal weight to both periods years ago and to the last few months. If instead we take an exponential moving average of the daily score for days with more than 20 devices when there have been at least 100 consecutive days of data with that many de-vices then we can plot how this score has changed over time. Equation 2 shows how the value for a particular day (vi) is
computed from the previous day’s value and the input for the current day (n) with anαof 1/100.
vi=vi−1(1−α) +nα (2)
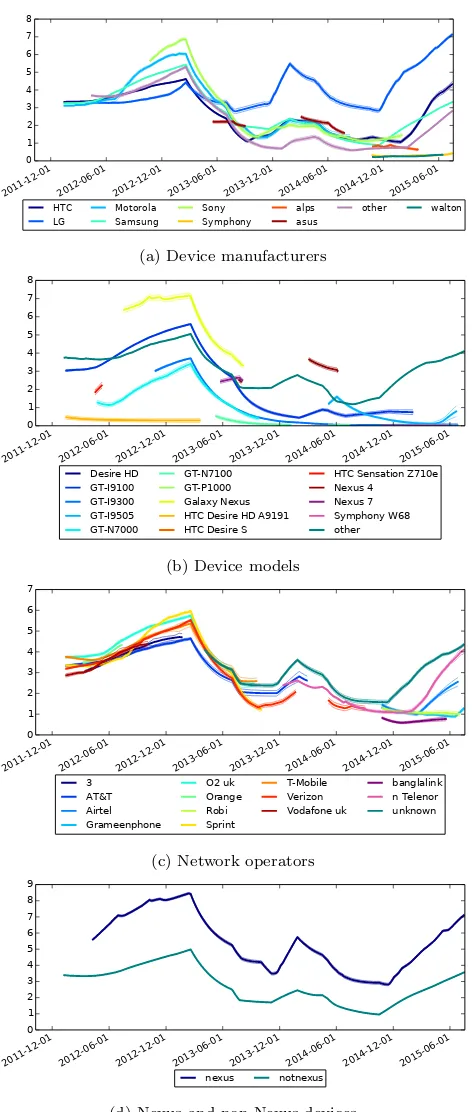
Figure 5 shows this for manufacturers, device models, net-work operators and for Nexus and non-Nexus devices. These show how the scores for different entities are different and change over time, while there is correlated behaviour for different entities (for instance, when new vulnerabilities af-fecting all Android are discovered), these lines still cross due to the different behaviour of the entities. It also shows that we do not have sufficient data for all the entities all of the time, resulting in gaps in the data. The clearest results are for Figure 5d with a large gap between the scores for Nexus and non-Nexus devices across the whole data set.
5.7
Gaming the score
If the comparative data given here is used to influence purchasing decisions then entities in the Android ecosystem might try to game the score rather than genuinely improve security. f is hard to game without doing a good job at security but it doesn’t get any worse if there is already one known vulnerability and another is found. A high value of
ucould be achieved by only ever shipping one version but
that would give low values for f and m (and not be
at-tractive to new customers). A high value of m could be
achieved by focusing on only one device at a time and en-suring that it gets updates but ignoring all others, but that would lowerfandu. One way to influence our scores would be to add additional devices to Device Analyzer, which have good security, these would have to be real end user devices since we could detect fake ones if they deviated from the behaviour of real devices in Device Analyzer. This would increase the size of our data set and would require providing genuinely good security to some users. Some active attacks like blocking access to the Device Analyzer servers from the mobile data network would not be effective as Device Ana-lyzer would retry on Wi-Fi. Other denial of service attacks on the Device Analyzer servers might be effective but ille-gal. Some entities might be able to force the uninstallation of the app from all devices. Therefore, our score is secure against passive gaming attacks which change the measured
distribution, but would require active defence against active gaming attacks, which target the measurement devices.
6.
COMPARISON WITH OTHER DATA
We compare the Device Analyzer data with three other sources of data and find similar distributions which bound the Device Analyzer data, indicating that it is likely to be typical. We have obtained comparable data on 5 290 vices from a multinational FTSE 100 company’s mobile de-vice management database, which includes company and employee owned devices, and from 5 170 000 matching User-Agent headers on all HTTP traffic for 30% of Rwanda for a week. We used the data from the FTSE 100 company for a week in April 2015 and the User-Agent data was collected in February 2015. Figure 6 shows the proportion of devices running each Android OS version in the two comparison data sets and the comparable periods from Device Analyzer. The general pattern this shows is that in the FTSE data newer versions are more popular than in the Device Analyzer data and that in the Rwanda data old versions are more popu-lar. Therefore the Device Analyzer data on OS versions is bounded by these two data sets.
Unfortunately, there is no ground truth of OS version in-formation. However, we have collated the API version infor-mation that Google has published most months since 2009.5 While API versions are too coarse grained to use for secu-rity update detection they are closely related to OS versions. If the Device Analyzer data on API versions are similar to the Google data on API versions then the Device Analyzer data on OS versions should be representative. We compared the data from Google and from Device Analyzer and they are similar. We analysed the difference between the API version data from Device Analyzer and Google Play, nor-malising for days since the API version was released. This shows that the Device Analyzer data systematically overes-timates the prevalence of new API versions and underesti-mates the prevalence of old API versions. This means that the OS version information from Device Analyzer is likely to be overestimating the prevalence of new OS versions and hence our results are likely to be conservative.
7.
RELATED WORK
We assume updates make security better, however the up-date process for apps, security fixes and OS upgrades also needs to be secure. Unfortunately, package management sys-tems designed to provide secure updates have been found to contain vulnerabilities [4] and many software update sys-tems fail to authenticate the connection between the device
5http://androidvulnerabilities.org/play/
2011-12-01 2012-06-01 2012-12-01 2013-06-01 2013-12-01 2014-06-01 2014-12-01 2015-06-01 0
1 2 3 4 5 6 7 8
HTC LG
Motorola Samsung
Sony Symphony
alps asus
other walton
(a) Device manufacturers
2011-12-01 2012-06-01 2012-12-01 2013-06-01 2013-12-01 2014-06-01 2014-12-01 2015-06-01
0 1 2 3 4 5 6 7 8
Desire HD GT-I9100 GT-I9300 GT-I9505 GT-N7000
GT-N7100 GT-P1000 Galaxy Nexus HTC Desire HD A9191 HTC Desire S
HTC Sensation Z710e Nexus 4 Nexus 7 Symphony W68 other
(b) Device models
2011-12-01 2012-06-01 2012-12-01 2013-06-01 2013-12-01 2014-06-01 2014-12-01 2015-06-01 0
1 2 3 4 5 6 7
3 AT&T Airtel Grameenphone
O2 uk Orange Robi Sprint
T-Mobile Verizon Vodafone uk
banglalink n Telenor unknown
(c) Network operators
2011-12-01 2012-06-01 2012-12-01 2013-06-01 2013-12-01 2014-06-01 2014-12-01 2015-06-01 0
1 2 3 4 5 6 7 8 9
nexus notnexus
[image:10.612.318.554.54.251.2](d) Nexus and non-Nexus devices
Figure 5: Security scores for device manufacturers, device models, network operators and Nexus devices. 95% confi-dence intervals indicated.
1.0.0 2.3.3 2.3.4 2.3.5 2.3.6 3.2.0 3.2.1 4.0.3 4.0.4 4.1.1 4.1.2 4.2.1 4.2.2 4.3.0 4.3.1 4.4.2 4.4.3 4.4.4 5.0.0 5.0.1 5.0.2 5.1.0
Version 0.0
0.1 0.2 0.3 0.4 0.5
Proportion
[image:10.612.57.293.82.638.2]ftse ftse_da ua ua_da
Figure 6: Comparison between FTSE, User-Agent and the corresponding Device Analyzer data, error bars indicate 95% confidence intervals.
and the update server or do not authenticate the down-loaded binaries [3]. Android does authenticate update bi-naries and Google Play downloads them over a secure con-nection [28]. In this paper we have analysed four critical vulnerabilities in the Android app update mechanism: APK unsigned shorts, APK unchecked name, APK duplicate file and Fake ID. Other work has demonstrated complex and subtle errors exist in the Android app update process. For example, the process can be exploited to allow apps to gain privilege through ‘Pileup’ vulnerabilities by registering for new permissions before the update which creates that per-mission is installed [33].
We used Device Analyzer to record data on the OS ver-sions of Android installed on devices. Nappa et al. per-formed a similar analysis using WINE to record data on in-stalled versions of Windows client programs and used cleaned NVD data rather than AVO for vulnerability data. They did not assign client applications scores [20].
Our analysis in§5.3 supports this view. Nevertheless it is problematic that an operating system update requires a re-boot. Chrome installs the new version side by side with the old one and switches the next time it is restarted. The same technique would be more difficult on phones with limited storage space (as many cheap Android phones have barely enough space to install just the update) but is a plausible improvement for more high-end devices. Google is deploying the same silent update technique through Google Play Ser-vices,6 which automatically installs updates for core Google components of Android, this bypasses the device manufac-turer and network operator.
As well as supplying security updates promptly, the im-pact of vulnerabilities can be reduced through security in depth. In this regard, iOS provides additional safeguards beyond those used in Android, including a pre-distribution review, mandatory code-signing by the manufacturer, and (with the important exception of ROP-based attacks [30]) the technical prohibition of dynamic code loading by an app. These features, combined with mandatory access controls, has resulted in a lower level of malware affecting iOS when compared to Android [10].
There are continuing efforts to reduce the impact of crit-ical vulnerabilities, both in Android and elsewhere. SE-Android [22], which is included in SE-Android from version 4.1 [14], and fully enforcing from version 5.0 [15] claimed to prevent some root vulnerabilities and to reduce the im-pact of others. Capability based enforcement systems such as Capsicum [31] substantially reduce the capabilities with which an exploit has to try and gain increased privilege and could be included in Linux7 and hence Android.
Rather than fixing critical vulnerabilities, security can be obtained by detecting malicious apps and preventing their installation or execution. Detection strategies include Risk-Ranker, which classified 3 281 out of 118 318 apps (2.8%) as risky of which 718 (22%) were malware and 322 (10%) were previously unknown malware, an infection rate of 0.6% across multiple markets [16]. DroidRanger also analysed apps finding 148 out of 182 823 apps (0.08%) to be mali-cious across multiple markets, of which 29 were previously unknown [35]. A common technique used by attackers is to include malicious code in repackaged popular apps. An-Darwin uses this insight to detect similar apps, and found 169 out of 265 359 of all apps studied (0.06%) were mali-cious clones [7]. Other approaches have made further use of malware dependency graphs [19] or tried to extract fur-ther semantic information to avoid malware being able to avoid detection [34] but simpler approaches based on ex-tracting strings from the binaries can be more effective [2] in terms of false positives and false negatives. There is a lack of ground truth data, a danger in training algorithms based on APK files that other algorithms have already found which might lead to new malware being missed and Droid-Chameleon showed that existing AntiVirus apps could be fooled by simple permutations of malicious APKs [21].
The percentage of Android devices running the current version (5.23%) is much less than the rate (>90%) for Win-dows XP SP2 computers contacting the Microsoft update servers [13]. A simple numerical comparison is unfair be-cause only one major OS version was considered in the
Mi-6
http://lifehacker.com/why-google-play-services-are-now-more-important-than-an-975970197
7
https://github.com/google/capsicum-linux
crosoft analysis, and data was only collected from comput-ers that contacted the update server (this was the default). Later data demonstrates the difficulty of upgrading com-puters between major OS versions, with 27% of Windows computers running Windows XP in July 2014,8 four months after Windows XP stopped receiving security updates.
8.
CONCLUSION
The security of Android depends on the timely delivery of updates to fix critical vulnerabilities. Unfortunately few devices receive prompt updates, with an overall average of 1.26 updates per year, leaving devices unpatched for long periods. We showed that the bottleneck for the delivery of updates in the Android ecosystem rests with the manufac-turers, who fail to provide updates to fix critical vulnera-bilities. This arises in part because the market for Android security today is like the market for lemons: there is infor-mation asymmetry between the manufacturer, who knows whether the device is currently secure and will receive up-dates, and the consumer, who does not.
Consequently there is little incentive for manufacturers to provide updates. To address this issue we developed the FUM security metric to quantify and rank the performance of device manufacturers and network operators, based on their provision of updates and exposure to critical vulner-abilities. The metric enables purchasers and regulators to determine which device manufacturers and network opera-tors provide updates and which do not.
Using a corpus of 20 400 devices we demonstrated that there is significant variability in the timely delivery of secu-rity updates across different device manufacturers and net-work operators. We find that on average 87.7% of Android devices are exposed to at least one of 11 known critical vul-nerabilities and, across the ecosystem as a whole, assign a FUM security score of 2.87 out of 10. In our data, Nexus devices do considerably better than average with a score of 5.17; LG is the best manufacturer with a score of 3.97.
Dataset
Much of the raw and processed data and source code is avail-able, excluding that which might identify individuals [26]. Data from Device Analyzer and AVO used in this paper is already available. The Rwanda and FTSE data cannot be made available.
Acknowledgements
This work was supported by a Google focussed research award; and the EPSRC [grant number EP/P505445/1]. Thanks to Sherif Akoush and Ripduman Sohan for supplying the Rwanda data and to staff at the FTSE 100 company for supplying their MDM data. Thanks to our anonymous reviewers for their insightful comments; Richard Clayton, the mobile security reading group, Anil Madhavapeddy and Oliver Chick for reading early drafts; David Robertson for statistical advice; and Laurent Simon, Thomas Coudray, Adrian Taylor, Justin Case, Giant Pune and Khilan Gudka for reporting vulnerabilities.
8
References
[1] Acer, M.,and Jackson, C. Critical vulnerability in browser security metrics.Web 2.0 Security & Privacy (W2SP)(2010).
[2] Arp, D.,Spreitzenbarth, M.,Malte, H.,Gascon, H.,
and Rieck, K. Drebin: Effective and Explainable Detection of Android Malware in Your Pocket. In:
Network and Distributed System Security (NDSS). Internet Society, San Diego, CA, USA, 02/2014, 23–26.
isbn: 1891562355.
[3] Bellissimo, A.,Burgess, J.,and Fu, K. Secure software updates: disappointments and new challenges. In:
USENIX Hot Topics in Security. USENIX, 2006, 37–43. [4] Cappos, J.,and Samuel, J. Package management
security. Tech. rep. University of Arizona, Computer Science Department, 2008, 1–20.
[5] CESG End User Devices Security Guidance: Android 4.2. 10/2013.url:
https://www.gov.uk/government/publications/end-user-devices-security-guidance-android-42(visited on 2015-07-28).
[6] CESG Samsung Galaxy S6 & S6 Edge - Certification Details. 07/2015.url:
http://www.cesg.gov.uk/servicecatalogue/Product- Assurance/CPA/Pages/Samsung-Galaxy-S6-and-S6-Edge-Certification-Details.aspx(visited on 2015-07-24).
[7] Crussell, J.,Gibler, C.,and Chen, H. AnDarwin:
Scalable Detection of Semantically Similar Android Applications. In:Computer Security–ESORICS. Springer Berlin Heidelberg, 2013, pp 182–199.isbn:
978-3-642-40202-9.
[8] Duebendorfer, T.,and Frei, S. Web browser security update effectiveness.Lecture Notes in Computer Science (LNCS)6027 LNCS (2010), 124–137.issn: 03029743. [9] Duebendorfer, T.,and Frei, S. Why silent updates
boost security. Tech. rep. April. ETH Zurich, 2009. [10] Felt, A. P.,Finifter, M.,Chin, E.,Hanna, S.,and
Wagner, D. A survey of mobile malware in the wild.
Proceedings of the 1st ACM workshop on Security and privacy in smartphones and mobile devices. SPSM ’11 55 (2011), 3.
[11] Forristal, J. Uncovering Android Master Key That Makes 99% of Devices Vulnerable. 03/2013.url:
https://bluebox.com/technical/uncovering-android-master-key-that-makes-99-of-devices-vulnerable/
(visited on 2015-04-08).
[12] Frei, S.,Duebendorfer, T.,and Plattner, B. Firefox (in)security update dynamics exposed.ACM SIGCOMM Computer Communication Review39, 1 (2008), 16–22. [13] Gkantsidis, C.,Karagiannis, T.,and Vojnovi´c, M.
Planet scale software updates.ACM SIGCOMM Computer Communication Review36 (2006), 423.issn: 01464833.
[14] Google Jelly Bean version information. 2015.url:
https://developer.android.com/about/versions/jelly-bean.html(visited on 2015-04-08).
[15] Google,and Ludwig, A. Android Security 2014 Year in Review. 04/2015.url:https:
//source.android.com/devices/tech/security/reports/ Google_Android_Security_2014_Report_Final.pdf.
[16] Grace, M.,Zhou, Y.,Zhang, Q.,Zou, S.,and Jiang, X. RiskRanker: Scalable and Accurate Zero-day Android Malware Detection. In:Mobisys. 2012, 281–293.isbn: 9781450313018.
[17] Grace, M.,Zhou, Y.,Wang, Z.,and Jiang, X. Systematic detection of capability leaks in stock Android smartphones.Network and Distributed System Security Symposium (NDSS)(2012).
[18] HTC The anatomy of an Android OS update. 2013.url:
http://www.htc.com/us/go/htc-software-updates-process/(visited on 2015-06-03).
[19] Lindorfer, M.,Neugschwandtner, M.,
Weichselbaum, L.,Fratantonio, Y.,Veen, V. van der,
and Platzer, C. ANDRUBIS - 1,000,000 Apps Later: A View on Current Android Malware Behaviors. In:Building Analysis Datasets and Gathering Experience Returns for Security (BADGERS). Wroclaw, Poland, 09/2014. [20] Nappa, A.,Johnson, R.,Bilge, L.,Caballero, J.,and
Dumitras, T. The Attack of the Clones : A Study of the Impact of Shared Code on Vulnerability Patching.IEEE Symposium on Security and Privacy (2015), 692–708. [21] Rastogi, V.,Chen, Y.,and Jiang, X. DroidChameleon:
evaluating Android Anti-malware against Transformation Attacks. In:Symposium on Information, Computer and Communications Security (ASIA CCS). March. ACM, 2013, 329–334.isbn: 978-1-4503-1767-2.
[22] Smalley, S.,and Craig, R. Security Enhanced (SE) Android: Bringing Flexible MAC to Android.Network and Distributed System Security Symposium (NDSS)(2013). [23] Soghoian, C.,and Wizner, B. ACLU FTC Android
updates. 2013.url:
http://www.aclu.org/files/assets/aclu_-_android_ftc_complaint_-_final.pdf.
[24] Taylor, J. R. An introduction to error analysis. 2nd ed. University Science Books Sausalito, California, 1997.isbn: 093570275X.
[25] Thomas, D. R.,and Beresford, A. R.
AndroidVulnerabilities.org. 2015.url:
http://androidvulnerabilities.org/.
[26] Thomas, D. R.,Wagner, D. T.,Beresford, A. R.,and Rice, A. Supporting data for: “Security metrics for the Android ecosystem”. 07/2015.url:
https://www.repository.cam.ac.uk/handle/1810/249077
(visited on 2015-07-27).
[27] Thomas, D. R.,Beresford, A. R.,Coudray, T.,
Sutcliffe, T.,and Taylor, A. The lifetime of Android API vulnerabilities: case study on the JavaScript-to-Java interface. In:Security Protocols XXIII. Springer, 03/2015. [28] Viennot, N.,Garcia, E.,and Nieh, J. A measurement
study of Google Play.SIGMETRICS (2014).
[29] Wagner, D. T.,Rice, A.,and Beresford, A. R. Device Analyzer: Large-scale mobile data collection. In:
Sigmetrics, Big Data Workshop. ACM, Pittsburgh, PA, 06/2013.
[30] Wang, T.,Lu, K,Lu, L.,Chung, S.,and Lee, W. Jekyll on iOS: when benign apps become evil.USENIX Security Symposium (2013), 559–572.
[31] Watson, R. N. M.,Anderson, J.,Kennaway, K.,and Laurie, B. Capsicum: practical capabilities for UNIX. In:
USENIX Security Symposium. Vol. 46. 2. USENIX Association, 08/2010, 29–46.
[32] Wright, J. L. Software vulnerabilities: lifespans, metrics, and case study. PhD thesis. University of Idaho, 2014. [33] Xing, L.,Pan, X.,Wang, R,Yuan, K.,and Wang, X.
Upgrading Your Android, Elevating My Malware: Privilege Escalation Through Mobile OS Updating.IEEE Security and Privacy (2014).
[34] Zhang, M.,Duan, Y.,Yin, H.,and Zhao, Z.
Semantics-Aware Android Malware Classification Using Weighted Contextual API Dependency Graphs. In:CCS. ACM, 2014.isbn: 9781450329576.