Rochester Institute of Technology
RIT Scholar Works
Theses Thesis/Dissertation Collections
2011
A Study of poly lactic acid bio-polymer for cereal
packaging
George Tuszkiewicz
Follow this and additional works at:http://scholarworks.rit.edu/theses
This Thesis is brought to you for free and open access by the Thesis/Dissertation Collections at RIT Scholar Works. It has been accepted for inclusion in Theses by an authorized administrator of RIT Scholar Works. For more information, please [email protected].
Recommended Citation
A STUDY OF POLY LACTIC ACID BIO-POLYMER FOR CEREAL PACKAGING
By
George A. Tuszkiewicz
A Thesis
Submitted to the
Department of Packaging Science
College of Applied Science and Technology
in partial fulfillment of the requirements
for the degree of
Master of Science
Rochester Institute of Technology
iii
Department of Packaging Science College of Applied Science and Technology
Rochester Institute of Technology Rochester, New York
CERTIFICATE OF APPROVAL
______________________________
M. S. DEGREE THESIS
______________________________
The M.S. degree thesis of George A. Tuszkiewicz has been examined and approved
by the thesis committee as satisfactory for the thesis requirements for the
Master of Science Degree
Craig Densmore - Advisor
Deanna Jacobs – Committee Member
Dr. Changfeng Ge – Committee Member
iv
I would like to thank Carol Cady from General Mills for her unwavering encouragement and
support of me throughout this research and during my entire graduate program. Carol has
provided continued passion for technical excellence and helped encourage me to pursue and
complete the program.
I would also like to thank Nort Holschuh and Brian Grant from General Mills, Nort for his time
and assistance in working through the statistical approach to this research in addition, for all his
knowledge and guidance on the statistical analysis. Brain for his tireless effort in helping put
together the statistical graphs on all the experimental data.
I want to thank both Jack Vaughan and Robert Meisner at the University of Wisconsin Stout,
Jack for always being there for support and encouragement throughout this journey. Robert for
spending time with me discussing and providing positive insights into the Executive Masters
Packaging Program at RIT.
The faculty at RIT, Don Appleton, Deanna Jacobs, and Craig Densmore, Don Appleton for
providing a career perspective on the Executive Masters Packaging Program which was
instrumental in helping me to make the decision to enroll in the program. I want to thank Deanna
Jacobs for her continued support, encouragement, and positive support throughout this journey.
Craig Densmore my advisor, for his wisdom, unwavering support, and guidance in making the
v
I want to express my appreciation to David Foster, David Streetman, Cynthea Snyder, Marty
Stanley, from the Printpack Company for their pilot line to process all the film candidates and
their technical laboratory analysis of the experimental test materials.
I would like to thank Gary Borges and Don Mallik from the Printpack Company for their
contributions on helping in the test design and insights into the research.
I would like to thank Mark Ocock from Allied Development for his time assisting with the
vi
DEDICATION
This thesis is dedicated to my family: My wife Lisa, and children Nicole, and Paige
Tuszkiewicz, who provided continuous encouragement and had to experience many family
sacrifices while I pursued this career goal. Without their unwavering love, support,
vii
A STUDY OF POLY LACTIC ACID BIO-POLYMER FOR CEREAL PACKAGING
By
George A. Tuszkiewicz
ABSTRACT
The aim of this research has provided a technical framework for evaluating Co-Ex film
structures of Poly Lactic Acid (PLA) and High Density Polyethylene (HDPE) for Read to Eat
(RTE) cereal primary packaging. This was accomplished through increased percentages of PLA
content in each identified film candidate. The foundation for this research is that Bio Polymers
are gaining market popularity as a result of the increasing world demand on plastics. As a result
of plastics high market volatility and the strain on fossil fuel it has created focused research on
Bio Polymers. However, it is widely known there are intrinsic performance deficiencies with Bio
Polymers that have been developed over the last decade that specifically, compete with
polyolefin’s. PLA a hydrophilic polymer is one of the most widely evaluated and
commercialized of the renewable polymers. In order for PLA to shift demand from polyolefin’s
and be widely used as a RTE cereal packaging film there are economic barriers and market
dynamics that need to be overcome. The study provided technical learning’s on the critical
moisture and oxygen barrier, physical, mechanical material performance properties and the
impact on environmental sustainability for RTE cereal film. Presented are the key findings for
1
TABLE OF CONTENTS
Page
1.0 INTRODUCTION……….3-4
1.1 Petroleum Based Polymers for cereal ………5-6
2.0 BRIEF REVEW OF FILM PROCESSING………...7
2.1 Blown Co-Ex Films……...…..……….………..…………...…..8-9
2.2 Biaxial Orientated Co-Ex Films……...….………....….10-11
2.3 Cast Co-Extrusion Films………...………...12-13
3.0 COMMOM BIO POLYMERS FOR FILMS……….14-19
4.0 CEREAL PROPERTIES………..………...…...20-21
4.1 Textual Changes..….………...…..………...………...21-22
4.2 Rancidity and Off Flavors.……….22-23
4.3 Nutritional Change.………23-24
4.4 Aesthetic Compromise………...24-25
4.5 Degradation of Flavor………25
5.0 DEFINITION OF TERMS ………..…………..26-28
6.0 RESEARCH METHODOLOGY……….…………..29-30
7.0 TEST METHODS AND INSTRUMENTATION ………31
8.0 MATERIAL SELECTION………..…...……..……..32
8.1 Material Variables……..………...………...….……….32-33
8.2 Extruder Conditions...………34-36
2
9.1 Clarity..………...………37-39
9.2 Haze..………..…40
9.3 Coefficient of Friction (Inside).………..………41-42 9.4 Coefficient of Friction (Outside).………..………..………...…43
9.5 Tear Resistance (Notched)………...………..44-45 9.6 Tear Resistance (UN-Notched)……….………...……..………46
9.7 Puncture Resistance...………….………..……..47
9.8 Secant Modulus (MD)……….………...48
9.9 Secant Modulus (CD)……….………49-50 9.10 Tensile Strength (MD)……….……….50-52 9.11 Tensile Strength (CD)……….……….……….53-55 9.12 OTR Permeation………...….………..………..56
9.13 WVTR Permeation……….………..….57
9.14 Summary of Properties…………..……….………...…....59
10.0 SUSTAINABILITY………..60
10.1 Energy………...60-64 10.2 Green House Gas………..64-67 11.0 CONCLUSIONS.……….………68
11.1 Impact on the Cereal Industry..………..…..69-71 12.0 FUTURE RESEARCH..………..………...……….72
13.0 REFERENCES.………...73-74 14.0 LIST OF TABLES....………75
3
1.0 INTRODUCTION
RTE cereal packaging has changed over the last 100 years and so has the importance of
packaging. Packaging needs to provide product protection, containment, identification,
marketing, and the distribution of the product to consumers. The packaging system consists of
the primary, secondary and tertiary package. The typical primary package is a plastic film pouch
that provides the following:
Contains the product
Isolates the product from contamination
Functional barrier ( moisture and oxygen) and mechanical properties for the
product requirements
The secondary package which is normally a paperboard folding carton provides the following:
Structure for the consumer package
Contains graphics for labeling of nutritional and brand information
Provides structural integrity for the primary package contents
The tertiary package which is normally a corrugated container provides the following:
Means to consolidate secondary packaged product
Provides efficient distribution of the packaged product through the supply chain
4
The majority of RTE cereal packaging consists of the primary, secondary and tertiary
packaging system components. However, there are a few market introductions of RTE cereal
products that have eliminated the secondary package in the case of the folding carton. The
primary package is produced using one of several film making processes: Blown Co-Extrusion,
Biaxial Cast Orientated Co-Extrusion and or Cast Co-Extrusion. Co-Extruded films are
engineered with as few as two up to thirteen layers to achieve the desired performance
properties. The various layers can consist of different types of polymers, varying percentages of
the polymers in each distinct layer, tie layers to provide appropriate bond strength between each
layer, and unique polymer sealants depending on the specific application for sealing the package.
Bio Polymers in which the feedstock comes from a renewable source have become increasingly
important with the gaining of consumer advocacy. However, it is widely known there are
intrinsic performance deficiencies with Bio Polymers which have been developed over the last
decade specifically, hydrophilic Bio Polymers that compete with the polyolefin’s that are
hydrophobic. PLA which accounts for approximately 43% of the total Bio-Polymer volume is
one of the most widely evaluated and commercialized of the Bio Polymers. The aim of this
research will provide a technical framework for evaluating the Co-Ex structure of Bio-Polymer
PLA combined with HDPE the most common petroleum based polymer, in the primary
packaging film for RTE cereal. Specifically, the study will focus on the critical barrier, physical
material performance properties and the impact on environmental sustainability for RTE cereal
as the percentages of HDPE and PLA for each structure is varied. The sealant layer was not
5
1.1 Petroleum Polymers for cereal film
Petroleum based Polyolefin’s are the most commonly used polymers for RTE packaging.
Polyethylene (PE) chemical backbone is made of Hydrogen and Carbon atoms with an infinite
monomer chain length and variation of multiple densities. HDPE and Low Density Polyethylene
(LDPE) are two of the most common petroleum based polymers used for the primary packaging
film for RTE cereals. HDPE is a nonpolar, linear branched thermoplastic that posses a much
more linear structure than LDPE. It has up to 90% crystallinity, whereas LDPE exhibits
crystallinity as low as 50%.1 HDPE as result does not exhibit a lot of perpendicular branching
and thus greater packing of chains can occur providing for an increased polymer density of 0.941
g/cc. LDPE does exhibit greater perpendicular branching and less packing of chains can occur
providing for a reduced polymer density to 0.910–0.940 g/cc. The branching produces tensile toughness for LDPE and the reduced branching produce greater stiffness for HDPE which makes
for an excellent combination for multilayer Co-Extruded film structure. The morphology of
HDPE of the chain packing and increased density has provided for its excellent moisture barrier
properties.
Source: Society of Plastic Engineers
6
Consumer Product Goods Companies (CPG’s) are seeking Bio Polymer packaging films
that are viable alternative solutions to non renewable petroleum based polymer films which
reduce the dependency on fossil fuels. Crude oil and natural gas are the main feedstock’s used to
produce Polyolefin’s. There is a direct relationship to the feedstock and the economic
relationship on packaging films. Polyolefin’s have been optimized over many decades of
commercial experience which is the major packaging film consumables. CPG’s are turning to
Bio Polymers with the issue of escalating cost of crude oil, market sensitivity, long term
availability, environmental impact of pollution, and social economic concern of increasing
packaging waste of petroleum based polymer films. The economic affect on petroleum polymers
that stem from political unrest, conflicts, natural disasters, as well as, supply and demand
fluctuations is well documented. This continues to present questions for CPG’s to accelerate the
assessment and development renewable Bio Polymer films that have the ability to negate these
7
2.0 BRIEF REVIEW OF FILM PROCESSING
There are many different processing methods to produce films and film structures. It is
important to recognize that there are two distinct categories for consideration. The first method is
laminated films which are composed of multiple individual films that are brought together
through a variety of laminating processes. The second method is the extrusion process whereby
the complete film is made up of many layers through a combination of polymers.
The laminated film process may include an adhesive and or a molten extrusion polymer
to join the films. Lamination adhesives can consist of solvent, water based, solventless - 100%
solids and or bio based formulations. Lamination by extrusion is the process of bonding two or
more films with a polymer web which is produced by the extrusion process.
The extrusion film making process consists of one or more layers of polymers that are
extruded through the use of a common die. The resultant film can consist of multiple polymer
types with varying thicknesses and polymer tie layers for inner layer bonding. The extrusion film
process can consist of different approaches which include blown Co-Extrusion single and double
bubble, cast Co-Extrusion and biaxial Co-Extrusion film.
Laminated films are acknowledged as an important approach to producing packaging
film structures but this research will be focused on the extrusion film making process. The films
that have been produced and tested have been constructed with the cast Co-Extrusion process.
However, for high volume RTE cereal film the commonly preferred method to produce the film
8
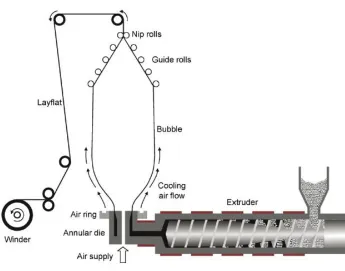
2.1 Blown Co-Ex Films
Blown Co-Extrusion film method is a common manufacturing process to produce
primary packaging film structures.
[image:16.612.149.494.181.452.2]
Source: Process in Polymer Science
Figure 2. Diagram of the blown film converting process
Blown Co-Extrusion film structures are engineered with as few as two up to eleven layers
to achieve the desired performance properties. The function of the various layers can have
different types of polymers, varying percentages of the polymers in each distinct layer, tie layers
to provide bond strength between each layer, and unique polymer sealants depending on the
9
resin is heated to a molten state and extruded to form a tube using an annular multilayer die. By
blowing air through the die head, the tube is inflated into a thin tubular bubble. The tube is
greatly orientated in the machine direction (MD) and partially in the cross direction (CD) and
then cooled. The tube is then flattened by nip rolls and taken up by the winder. The ratio of the
bubble diameter to the die diameter is called the blow up ratio (BUR). BUR ratios of 2:1-4:1 By
varing the BUR, screw speed, air pressure,and winder speed, films of different thicknesses
(10-150 µm) and degree of orientation can be achieved.2 Collapsing the roll in the nip can pose a
challenge of producing winkles in the finished film. Calcium Carbonate (CaCO₃) in small
amounts can be added in the process to reduce the anti adhesion of the film when winding the
film.
Blown Film Co-Extrusion Process Material Advantages
Controlled MD and CD orientation means the film will have good tensile and
elongation strength.
Orientation process yields slow cooling, higher molecule alignment and
controlled crystal growth. This influences higher moisture barrier, gas and higher
stiffness properties.
Lower clarity due to greater crystalline structure.
The rotating die on a blown film extruder distributes any gauge variations evenly
across the width of the roll to avoid gauge bands.
Blown film can be the most economical method for producing films from 0.001”
– 0.010” thick.
10
2.2 Biaxial Orientated Co-Ex Films
Biaxial Orientated Cast Co-Extrusion film method is common manufacturing process to
produce primary packaging film structures.
Source: Process in Polymer Science
Figure 3. Diagram of the biaxial cast orientated tenter frame film converting process
The polymer resin is feed into an extruder which is heated to become molten and
extruded through a multilayer die to reach its glass transition temperature. The extrusion film is
stretched in longitudinal (MD) and transverse (CD) direction to attain a required film dimension.
Typically film is stretched 4X in the MD to 8X in the CD. The film is then processed either
sequentially or simultaneously in order to obtain a very thin highly orientated film. Sequential
11
achieved by different speeds between groups of rollers. The film then enters the tenter oven like
device, which uses two endless chains to grip and stretch the web in CD direction on driving
rails. The simultaneous process is a combination converting where the film is stretched in both
directions at the same time. After the film is stretched the polymer orientation is fixed. The film
is then quenched to room temperature and wound onto the master roll. The films typically
produced using the biaxial orientation process is often laminated to other print or barrier films
which then complete the total film structure.
Biaxial Orientated Tenter Frame Co-Extrusion Film Process Material Advantages
High levels of orientation both MD and CD yield strongest mechanical properties
puncture, tensile and modulus possible of film processes.
Highly organized crystalline structure creates higher moisture and gas barrier properties.
Cost competitive only at high utilization rates typically 15-20 million pounds annually
and higher.
Excellent gauge consistency possible on long production campaigns.
Heat setting process for highly crystalline films with dimensionally stable up to 150° C.
Ability to producer flatter films.
12
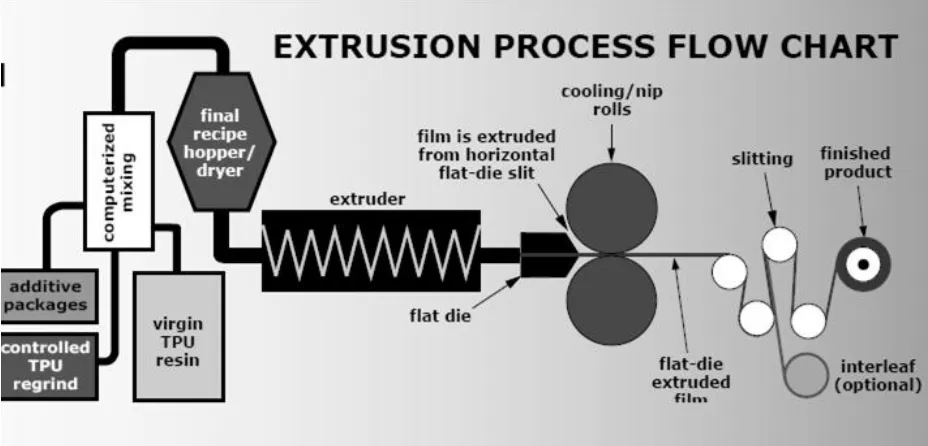
2.3 Cast Co-Ex Films
Cast Co-Extrusion film method is common manufacturing process to produce primary
packaging films. The cast Co-Extrusion film includes the following processing equipment.
Extruder
Feed block
Flat sheet die
Chill roll unit
Thickness gauge instrumentation
Winder
[image:20.612.73.537.377.600.2]
Source: www.Argotec.com
13
The resin is feed into an extruder which is mixed by the rotation of the extruder screw and heated
to become molten. The resin is extruded through a feed block die. The feed block die provides
the proper layering of polymers for the film structure. The film is extruded onto the chill roll
which quenches the film instantaneously. This instantaneous quenching of the polymer structure
provides outstanding film clarity and dimensional consistency. After the chill rolls the material is
wound onto to large rolls for further processing as needed.
Cast Co-Extrusion Film Process Material Advantages
Highly cost effective film processing due to rapid cooling of structure.
Higher amorphous and lower crystalline structure which provide higher moisture, gas
permeation.
Less stiffness properties.
Ability to easily incorporate additives for processing and performance.
Higher levels of orientation in machine direction MD and low CD direction.
Excellent gauge consistency possible with long extended campaigns.
Ability to produce very clear and glossy films due greater amorphous regions.
14
3.0 COMMON BIO POLYMERS FOR FILMS
Bio Polymers in which the feedstock comes from a renewable source have become
increasingly important with the gaining of consumer popularity. The current demand for Bio
Polymers is very low compared to the petroleum based polymer films. While currently only
representing 2% of the total petroleum based polymer volume Bio Polymers are expected to
rapidly expand capacity and increase in demand over the next decade. As a result of the
increasing world demand on fossil fuels, and the high volatility, Bio Polymers are of great
interest to researchers. They provide an alternative packaging solution to a highly volatile and
sensitive petroleum based polymer market. The market for renewable plastics has been
experiencing rapid growth. From 2003 to the end of 2007 the global annual growth rate was
38%. The growth rate in Europe was 48% as compared in the same period. The world wide
average growth rate is expected to be 19% through 2020. The starch based polymers in particular
are predicted to enjoy significant growth in the immediate future. The potential substitution
opportunity for Polyethylene petroleum based polymers is quite high at a level of 90%. This
presents a significant market opportunity. There are technical issues with scale up with Bio
Polymers and consistent availability of feedstock. However, the opportunity cost for growth and
share switching from the petroleum based polymer films remain high with a projected growth of
15
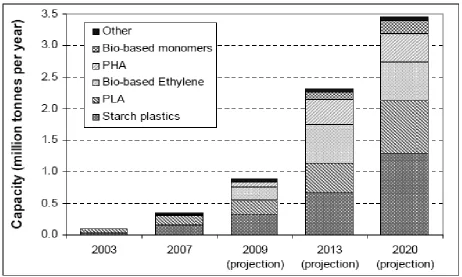
[image:23.612.78.540.77.354.2]Source: 2009 European Science and Technology Observatory
Figure 5. Projected worldwide supply of renewable polymers
Starch based plastics, PLA and renewable based PE, and polyhydroxyalkanoate (PHA)
are anticipated to lead the renewable polymer surge in growth. “Starch based polymers are
projected to grow at a rate of 38%, PLA 24%, bio based PE 18%, and PHA13%, bio based
monomers 6%, and 2% respectively.” 3
The uncertainty of the amount of fossil fuel for
petroleum based films lends a favorable opportunity to renewable films. Unlike the petroleum
feedstock which has many global factors which are outside of the supply and demand of the
market for films do not present the same market dynamic for renewable polymers. For Bio
Polymers there still is a dependency on the petroleum industry including growing the feedstock,
16
availability and volatility is not driving force. The packaging film cost to the CPG’s should be
void of wide swings in feedstock market price fluctuations.
In the last decade PLA has made significant inroads into various markets while
competing with well established commodity based petroleum polymers. Specifically, Bio
Polymers in the polyester family have been developed over the last decade.
There are many challenges associated with Bio Polymers as well, from market availability,
economics, infrastructure capacity, impact on the food supply, and its ability to deliver against
demanding material properties. In order for PLA as a polymer to be more commercially viable as
a packaging film the material performance and barrier properties need to be improved. Balancing
all these challenges within an emerging polymer technology can pose great difficulty as well as
present market opportunities. The major focus area that is of particular interest of food
companies is the material performance. Compared to Polyolefin polymers PLA does not provide
comparable moisture, and oxygen barrier performance. In order for PLA to become a viable
option for food packaging films there needs to be additional technologies considered to enhance
the barrier properties. Increasing world population and providing longer shelf life products to
reach more consumers are compelling to accelerate the rate of the basic research. With this goal
in mind CPG’s have the responsibility as providers to participate in leading the industry research
and helping the commercialization of the technology.
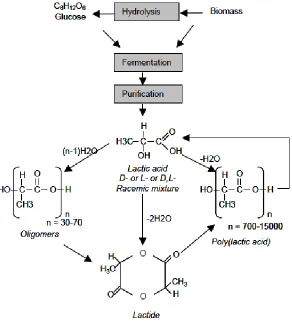
PLA is synthesized from L-and D-lactic acid, which are produced from fermentation of
sugar and (poly) saccharides such as sugar feedstock and corn, wheat, rice and other starch
sources, either by ring-opening polymerization or by condensation polymerization.4 In the future
17
from wood , straw, corn stover and sugarcane byproducts – will become a viable pathway
through technological advances (enzymatic processes), together with the pressure on resources
driving the increased utilization of agricultural waste.3 The feed stocks are abundant and
renewable which makes PLA an attractive packaging film.
Figure 6. PLA molecule 700 – 15000 Dalton
PLA was discovered over 150 years ago however as a result of low cost well established
petroleum polymers and technical properties that had inferiority there was no immediate
application until in the 1960’s were then medical applications became possible. During the
1980’s and 1990’s DuPont, Coors Brewing (Chronopol), and Cargill were focused on the
commercialization of the polymer as a low cost commodity resin. The efforts of DuPont and
Chronopol soon failed as significant research dollars were committed. However, Cargill did
finally develop a continuous process for high purity PLA production using the distillation
reactive process.
18
[image:26.612.155.447.87.411.2]
Source: Utrecht University
Figure 7. Shows the Nature Works LLC PLA production process from bio mass
Nature Works PLA resin uses a continuous process of a ring opening polymerization
(ROP) of lactide. Condensation of aqueous lactic acid produces low molecular PLA pre-polymer
(<5000 Dalton). The pre-polymer is then depolymerized by increasing the polycondensation
temperature and lowering the pressure, resulting in a mixture of lactide stereoisomers. As
organometallic catalyst tin octoate, is used to enhance the rate and selectivity of the
19
distillation. In the final step, high molecular weight PLA (>100,000 Dalton) polymer is produced
by catalyzed ring-opening polymerization in the melt. Any remaining monomer is removed
under vacuum and recycled to the start of the process. By controlling the rate of polymerization
(ROP) process chemistry it is possible to select the stereoisomer of the lactide intermediates and
thereby also the properties of the resulting PLA. Usually, high purity L.L-lactide is the desired
20
4.0 CEREAL PROPERTIES
RTE cereals continue to gain in popularity due to their convenience, economical,
nutritional health benefits. The increasing need for high fiber, lower fat and whole gains in our
diets makes for a high market demand for RTE cereal. In addition, to the documented nutritional
benefits RTE breakfast cereal studies have shown to positive cognitive benefits for adults and
children. The diversity and product forms present for some interesting technical challenges
concerning product preservation. For CPG’s that produce RTE cereal they rely heavily on the
packaging system to help provide the best possible quality product for their consumers. The
packaging system comprises of many functions from the production of the product, packaging,
storage and warehousing, distribution to customers, and the overall consumer experience. Once
the product has been manufactured and packaged the shelf life has commenced. Shelf Life is
defined as the amount of available days the product meets all physical and organoleptic quality
requirements by the CPG’s. The objective of defining the shelf life is to optimize the
performance parameters of the package to improve the quality of the product offering, and to
extend the consumption time in a cost effective manner. The shelf life of RTE cereal depends to
a large extent on the content and quality of the oils contained in them. Thus, cereal products
made with low oil content such as wheat, barley, rice, and maize grits (oil content: 1.5% to 2.0%)
have a longer Shelf Life than products made from oats (oil content: 4% to 11%, average 7%).
Although whole corn has high oil content (4.4%), most of the oil is contained in the germ, which
21
When considering the appropriate packaging materials for RTE cereal there are five
[image:29.612.69.541.181.393.2]modes of product failure which are listed as follows:
Table 1.1.
Modes of failure for RTE cereal
Product Characteristics Resulting Affect
Textural Change of Crispness Moisture Gain or Loss
Rancidity Off Flavors Lipid Oxidation
Nutritional Change Vitamin Loss
Aesthetic Compromise in Physical Appearance
Product Breakage
Degradation of Flavor Aroma Loss
4.1 Textural Changes
Packaging of RTE cereal is traditionally packaged in a secondary package which is
typically a paperboard folding carton which provides structural integrity, nutritional content and
consumer product information about the product. The primary package which is normally a
plastic film liner or pouch has direct contact with the cereal and has the greatest impact on the
modes of product failure. In a few cases where the cereal product is not hydroscopic or retains a
satisfactory texture when in equilibration with the ambient atmosphere, a liner may not be
needed for moisture protection and may even serve to entrap rancid aromas. Where this is the
22
cereal is hydroscopic and requires a primary package such as a plastic liner for extending the
Shelf Life. During the distribution and storage of the product , due to the difference between the
water activity inside and outside the package, water molecules permeate through the package
leading to an increase of the internal water content. This causes an increase of the water content
of the packaged product and consequently a decrease of its quality.7 The lower the water activity
(aw)of a product the greater likely hood that the product will gain moisture over the shelf life
period. The resulting product is some way has been compromised in its final texture. The
consumer perception of this textural change can lead to an undesirable eating quality such as
chewy, sticky, soggy or staling of the product. When fruit particulates are incorporated with
cereal the aw of the cereal needs to be manipulated in order for the cereal to remain crisp and the
fruit to remain succulent. In some cases the cereal may have a different starting aw and it
continues to equilibrate closer to the fruit aw over time through the shelf life of the product. This
is a moisture management of the internal environment to the plastic liner.
4.2 Rancidity and Off Flavors
Plant based lipids contain hydrocarbon chains of fats typically unsaturated which are
susceptible oxidation. The primary mode of chemical deterioration in dry cereal is lipid oxidation
and two reasons have been advanced for this. First the aw of dry cereals is at or below the
monolayer, which essentially stops all other types of deteriorative reactions. Second, unsaturated
fats are required in lipid oxidation, and the grains used in breakfast cereals have a high ratio of
unsaturated to saturated fats.8 Oxidation of lipids creates rancidity and off flavor in RTE cereal
however, most do not develop rancidity at an accelerated rate. Generally for off-odors to be
23
temperatures during storage conditions with an extended shelf life to develop rancidity.
Temperature and relative humidity are the extrinsic factors having greatest effect on the oxygen
permeability of packages.9 The critical function of the primary package is to reduce or prevent
oxygen permeation during shelf life. Thus to prevent resulting lipid oxidation as an essential
attribute for providing desirable product. Excluding oxygen may be of limited assistance in
extending shelf life although oxygen is almost never rate limiting.5 There are circumstances
where some products need to breathe due to the out gassing of volatile compounds during the
cooking of the grains. In some extreme cases although not typical where there can be ingress of
odors into the package due to outside aromatic content which would require some oxygen
barrier. For this reason most CPG’s do not require an ultra high oxygen barrier packaging plastic
liner. Noted but generally not a major concern is the light transmission of the primary package.
The secondary package since it is typically a paperboard this provides a significant light barrier
for the product and this is usually not a concern for the product. However, where there are
packaging designs in which the secondary package has been eliminated then primary package
incorporates a high level opacity for reduced light transmission.
4.3 Nutritional Change
Vitamin fortification is a common practice in the RTE cereal category. This
micronutrient strategy is part of the production of the cereal where vitamins are incorporated
through a variety of methods into the product during processing. This allows CPG’s to enhance
the nutritional content of the cereal in delivering vital nutrients as well as target vitamins that
may be deficient in some diets. In some cases this can prove to be an important product
24
specific in several countries including the United States. For this reason it is important to
preserve nutritional value and maintain the compliance with the nutritional content on the
declaration of the label. In some cases depending on the sensitivity of the vitamin there may be
an overage used to minimize problems with label claims. There are two major factors in vitamin
loss which are the temperature of the product, in particular to the storage conditions and oxygen
permeation. One hypothesis is due to the kinetics of permeation. As the storage temperature
raises the permeation rate increases thus accelerating the ingress of oxygen to deteriorate oxygen
sensitive vitamins. The second hypothesis is related to the effects of temperature which are the
change or delta T, and length of time. A temperature change of 10°C has a two -three fold kinetic
change on the rate of oxidation. The packaging cannot prevent the temperature change however,
it must perform under the know storage and distribution conditions. In a product study conducted
on the effects of micronutrient loss during processing and storage it was concluded that the affect
on shelf life was not significant. It was noted however, the possible exception of vitamin A and
to a slight extent, vitamin C. Vitamin A survived for 6 months (average distribution of time) at
room temperature with no measureable loss.8 For this reason the distribution and storage of the
finished product is handled in ambient conditions.
4.4 Aesthetic Compromise
Physical properties of cereal include product fragility, abrasiveness, its ability to flow and
the density. The product appearance is tied to several factors one which is not related to the
primary package or the plastic liner. The secondary package however, plays a vital role in
maintaining product integrity. The compression strength and impact resistance of the paperboard
25
product. Product breakage in RTE cereal is not a significant concern and the insignificant
amount of product finds (broken pieces of cereal) due to handling is acceptable to consumers.
The packaging liner plays an insignificant role in product breakage.
4.5 Degradation of Flavor
The loss of aroma can be a challenge with certain RTE cereals where they have a high
aromatic flavor. This is typical of some of the fruiter type cereals where the strong aroma is
precursor to an intense flavor. These typically have volatile compounds that are difficult to
maintain in the plastic liner. In some cases consumers perceive the loss of flavor with an out of
date product and in fact opposite is also perceived by the same consumers. A study evaluating
two typical cereal liner materials (HDPE and glassine) found that the permeability coefficients of
d-limonene (a common flavor component in citrus products) in the HDPE liner were three to
four orders magnitude higher than that in glassine. It was also found that the solubility of d
-limonene in the glassine liner was substantially lower than in the HDPE liner for the same vapor
pressures.10 The sealant layer of the plastic film which is in direct contact with the cereal can
have a significant effect on the scalping kinetics of the volatile flavors. It should be noted there
are barrier strategies that can be developed to prevent the scalping of volatile compounds. Where
26
5.0 DEFINITION OF TERMS
Polymers
BUR – Blow Up Ratio
Biax – Bi-Axial
Co-Ex – Co-Extrusion
CD – Cross Direction
CaCO₃ – Calcium Carbonate
EVA – Ethylene Vinyl Acetate
I/O – In to Out
O/I – Out to In
LDPE – Low Density Polyethylene
LLDPE – Linear Low Density Polyethylene
HDPE – High Density Polyethylene
MD – Machine Direction
PE – Polyethylene
PHA – Polyhydroxyalkanoate
PLA – Poly Lactic Acid
PLLA – Poly-L-Lactide Acid
ROP – Ring Opening Polymerization
Cereal Terms
CPG’s – Consumer Package Goods Company
RTE – Ready to Eat
27
Test Methods and Instrumentation
> – Greater Than
< – Less Than
C – Celsius
COF – Coefficient of Friction
ASTM – American Society for Testing and Materials
DOE – Design of Experiment
DSC – Differential Scanning Calorimetry
Gms - Grams
MVTR – Moisture Vapor Transmission Ratio
Mills - .001”
T– Temperature
Tensile Strength
MD/CD Secant Modulus
Notched and Un-Notched Tear Resistance
In and Out Puncture Resistance
PSI – Pounds per Square Inch
OTR – Oxygen Transmission Ratio
ROP – Rate of Polymerization
µm – Micron
Software
28
Savvy Pack® – Sustainability Software (Allied Development™)
Sustainability
CO₂ – Carbon Dioxide Emissions
GHG’s – Green House Gases
MSI – One thousand square inches
29
6.0 RESEARCH METHODOLGY
Methodology
The methodology used was both quantitative and qualitative research methods. The sample
size was set at five for each analytical test due to economic constraints of cost of analytical time.
Additionally there was a low standard deviation of each sample set which provided additional
confidence. However, Water Vapor Transmission Ration (WVTR), Oxygen Transmission Ratio
(OTR) sampling was limited to two samples due to normal industry sampling practices and as
well as low standard deviation of results.
1. Design of Experiment consisted of the following:
a. Controls – included 100% HDPE and 100% PLA as respective resin films.
b. Six structure variables – included progressively increasing percentages of
PLA and reducing percentages of HDPE resins in the films.
2. Mean and standard deviation were determined for each viable sample set and film
test.
3. Comparative means from two or more samples for each film test variable.
4. Mean values were plotted with a progression trend line for each film test variable.
The procedure
1. Samples were TAPPI conditioned at 73 ° F and 50% RH for 48 hours.
2. Samples were taken from the beginning middle and end of the 200 ft of film that was
30
3. All films samples were prepared in accordance per ASTM standard methodology for each
31
[image:39.612.69.551.125.700.2]7.0 TEST METHODS & INSTRUMENTATION Table 1.2.
ASTM test methods performed on test film
Test Units Method Equipment
Coefficient of Friction
Static – I-I/O-O Kinetic – I-I/O-O
uS,uK ASTM D1894 Testing Machines Inc
32-06
Clarity % ASTM D1003 Byk-Gardner
Haze-Gard Plus
Haze % ASTM D1003 Byk-Gardner
Haze-Gard Plus
Density gms/cc ASTM-D1505
Gauge mils or .000" Micrometer - Emveco
210A
High Speed Puncture Multiaxial Impact
ft/lb
Newton’s- Peak Load Joules- Energy
ASTM D3763 Instron- Dynatup
OTR cc/100 in²/24 hr ASTM D3985 MOCON OX- TRAN
2/20 Propagation Tear
Resistance
Notched/Un Notched MD/CD
gms ASTM D1922 Thwing-Albert
Elmendorf
Secant Modulus MD /CD
psi ASTM D882 Instron - 5566
Tensile Strength
@ Break MD/CD
% ASTM D882 Instron - 5566
Tensile Elongation
@ Break MD/CD
% ASTM D882 Instron - 5566
Melting Point ºC ASTM E 794-98 Seiko - RDC 220
WVTR gms/100 in²/24 hr ASTM F1249 MOCON
32
8.0 MATERIAL SELECTION
The following polymers were used in this body of research:
Polymer: PLA - 4042D (NatureWorks®)
Polymer: HDPE - MarFlex® 9608XD (Chevron Phillips)
Impact Modifier: Biomax® 120 (DuPont®) added 10% by weight to the PLA
Tie Layer: ADMER® SF600 (Mitsui Chemicals America)
Test structures consisted of a 3 layer Co-Ex: Resin A /Tie/ Resin B without the sealant layer
Film thickness .002”
8.1 Material Variables
33
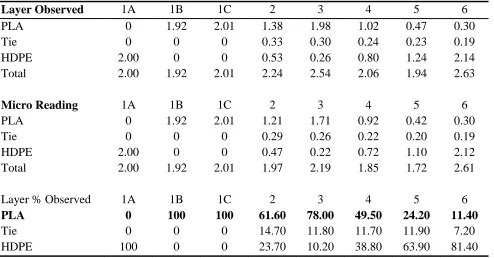
Table 1.3.
Film structure observed measurements vs. actual physical materialmeasurements
Units - Mils =.001”
Layer Observed 1A 1B 1C 2 3 4 5 6
PLA 0 1.92 2.01 1.38 1.98 1.02 0.47 0.30
Tie 0 0 0 0.33 0.30 0.24 0.23 0.19
HDPE 2.00 0 0 0.53 0.26 0.80 1.24 2.14
Total 2.00 1.92 2.01 2.24 2.54 2.06 1.94 2.63
Micro Reading 1A 1B 1C 2 3 4 5 6
PLA 0 1.92 2.01 1.21 1.71 0.92 0.42 0.30
Tie 0 0 0 0.29 0.26 0.22 0.20 0.19
HDPE 2.00 0 0 0.47 0.22 0.72 1.10 2.12
Total 2.00 1.92 2.01 1.97 2.19 1.85 1.72 2.61
Layer % Observed 1A 1B 1C 2 3 4 5 6
PLA 0 100 100 61.60 78.00 49.50 24.20 11.40
Tie 0 0 0 14.70 11.80 11.70 11.90 7.20
HDPE 100 0 0 23.70 10.20 38.80 63.90 81.40
The test material was run on a pilot lab scale Cast Co-Ex film line. The Cast line was
chosen due to the ability to run Co-Ex material with multiple die layer capabilities. In
preparation the PLA was dried down to 250 ppm in moisture content prior to feeding the resin
into the hopper. The Biomax® 120 (DuPont®) was added 10% by weight to the PLA to provide
34
8.2 Extruder Conditions
[image:42.612.70.553.428.569.2]Figure 9. Single extruder design
Table 1.4.
Extruder operating conditions
Extruder Zone 1 – Temp
F°
Zone 1 – Temp
F°
Zone 1 – Temp
F°
Barrel Pressure
PSI
A – HDPE 400 450 450 1000
B – PLA 350 440 450 500
35
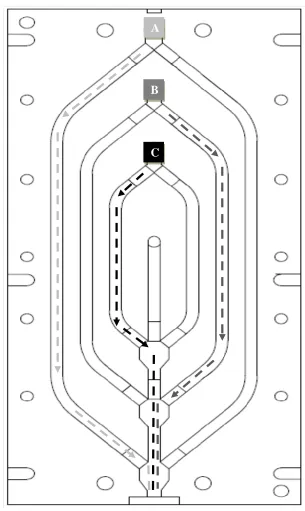
The pilot Cast Co-Ex line is composed of three extruders each with a resin hopper that
processes each material individually. The three extruders used in the test are the following:
2- 1 ¼” extruders are model KTS-125 24:1 L/D, barrier screws w/ Maddox
mixers, 10 Horse Power DC Drive
1- 1” extruder is a Killion (Davis Standard) model KTS-100, 24:1 L/D, general
purpose screw, 5 Horse Power DC Drive.
The individual extruders consist of a barrel and screw, three heating zones, and a screen pack
shown in Figure 9. The two 1 ¼” A/B extruders (HDPE and PLA) respectively are fitted with a
melt pump to control the flow of resin. The barrel pressure was monitored before and after the
melt pump for fluctuations. The flow of resin was metered by the melt pump that was controlled
by a variable speed DC motor with controller. The melt pump provides for a uniform and
consistent resin flow that is independent of extruder fluctuations. Once the resin reached the
screen pack and fee of debris, the molten resin flows into the feed block. The feed block
maintains the resin laminar flow to the coat hanger die which prevents resin mixing shown in
Figure 10. The coat hanger die maintains the laminar flow and laterally spreads the resin from
the inlet of 3/4" to 14" through the die lip. The extruded Co-Ex film is metered onto a quenching
chill roll which sets up the crystallization structure of the film. The film was then wound onto a
master roll for material analysis.
36
[image:44.612.178.483.93.604.2]Feed Block Diagram
Figure 10. Feed block die resin flow
Extruder A – PLA, Extruder B – HDPE, Extruder C – Tie Layer
A
B
37
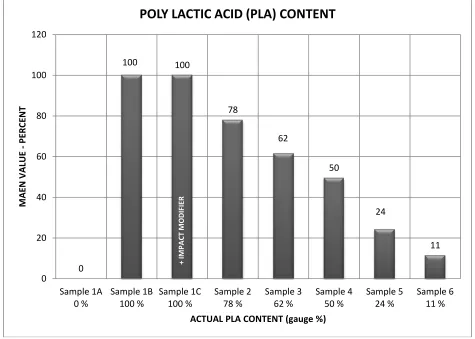
[image:45.612.70.545.140.479.2]9.0 ANALITICAL RESULTS AND FINDINGS
Figure 11. Poly Lactic Acid percent content in film structure
In Figure 11 it is noted that the PLA content of each film structure variable is expressed
as a percentage of the total thickness of the film. The percentage of PLA content was determined
by two methods. The first method determined the percentage content by microtoming the sample
and then viewing it under a microscope. The software (Image Pro Plus) was used to derive the
measurements from the microtome samples. The second method used a micro gauge reading
0
100 100
78 62 50 24 11 0 20 40 60 80 100 120 Sample 1A 0 % Sample 1B 100 % Sample 1C 100 % Sample 2 78 % Sample 3 62 % Sample 4 50 % Sample 5 24 % Sample 6 11 % M A EN VALU E - PE R CE N T
ACTUAL PLA CONTENT (gauge %)
POLY LACTIC ACID (PLA) CONTENT
38
which is the actual overall thickness determined when measuring the sample with a micrometer.
Both measurement techniques were used to provide the greatest level of accuracy since the film
was highly compressible. It is noted the actual measured percentage of PLA content per film
structure variable is slightly different than the DOE test plan in Figure 8.
[image:46.612.96.506.242.591.2]9.1 Clarity
Figure 12. Percent light transmission in film structure
Clarity
PLA Content (Gauge %)
0 20 40 60 80 100
C lar ity P er c ent T rans m is s ion 80 82 84 86 88 90 92 94 96 98 100 Sample 1A Sample 6 Sample 5
Sample 4 Sample 3
Sample 2 Sample 1C
IM
Sample 1B
w/o IM
1B
39
In Figure 12 the film structures were tested for percent clarity in accordance with ASTM
D1003 method using a Byk-Gardner Haze-Gard Plus lab tester. The percentage of narrow angle
light transmission through the film of sample 1A which is 100% HDPE allowed for the greatest
light transmission of all the sample structures. Sample 1B which is 100% PLA had demonstrated
less light transmission through the film compared to sample 1A and was statistically significant.
Samples 2-6 showed no significant difference in light transmission through the film compared to
sample compared to 1A and 1C. A trend showed as the percentage of PLA content was increased
and HDPE content reduced the light transmission level reduced linearly. Sample 1C with the
10% impact modifier added did show a statistically significant difference in light transmission
compared to sample 1B. Sample 1C demonstrated an increase in the amount of light
transmission through the film. PLA without an impact modifier is a highly crystalline structure
which contributes to the scattering of light in the polymer. It was anticipated when adding the
impact modifier that it created an increased amorphous polymer matrix. This created smaller and
fewer crystalline sites which reduced diffraction of light contributing to the increase in
40
[image:48.612.103.504.166.456.2]9.2 Haze
Figure 13. Percent haze in film structure
In Figure 13 the film structures were tested for percent haze in accordance with ASTM
D1003 method using a Byk-Gardner Haze-Gard Plus lab tester. The percentage of wide angle
light transmission through the film with sample 1A which is 100% HDPE allowed for the
greatest percent haze of all the sample structures. Sample 1B which is 100% PLA had
demonstrated the least amount of percent haze which was statistically significant compared to
sample 1A. Samples 2-5 showed a statistically significant difference in haze compared to sample
Haze
PLA Content (Gauge %)
0 20 40 60 80 100
H az e - P er c ent T rans m is s ion 0 10 20 30 40 Sample 1A Sample 6 Sample 5 Sample 4 Sample 3 Sample 2 Sample 1C IM Sample 1B w/o IM Sample 1A - 0% PLA
Sample 1B - 100% PLA Sample 1C - 100% PLA + IM
41
1A. The trend showed as the percentage of PLA content was increased and HDPE content
reduced the percentage of haze reduced linearly.
[image:49.612.103.511.251.543.2]9.3 Coefficient of Friction (Inside/Inside)
Figure 14. Inside COF of film structure variables
In Figure 14 the film structures were tested for static and kinetic inside COF in
accordance with ASTM D1894 method using the Testing Machines Inc 32-06 lab tester. No slip
Coefficient of Friction - I/I
PLA Content (Gauge %)
0 20 40 60 80 100
I/
I
COF
0 1 2 3 4
Sample 1A Sample 6
Sample 5
Sample 4 Sample 3
Sample 2 Sample 1C
Sample 1B
w/o IM
IM Sample 1A - 0% PLA
Sample 1B - 100% PLA Sample 1C - 100% PLA + IM
1B
• Static
• Kinetic
42
additives were incorporated into the film structure. As expected, there was a difference between
the static and kinetic COF within each film structure variable. The static COF was higher in all
cases compared to the kinetic COF. Sample 1A which is 100% HDPE showed the overall lowest
static and kinetic COF of all film structure variables. Sample 1B which was 100% PLA
demonstrated the highest both static and kinetic COF values that was statistically significant
compared to all samples. Samples 2-4 showed a trend that as the PLA content was increased the
COF values both static and kinetic both slightly increased. However, sample 5-6 showed just the
opposite trend. It may be noted that the COF results were somewhat inconclusive and there
would need to be additional testing particularly when lower percentages of PLA were used in the
43
[image:51.612.106.497.107.423.2]9.4 Coefficient of Friction (Outside)
Figure 15. Outside COF of film structure variables
In Figure 15 the film structures were tested for static and kinetic outside COF in
accordance with ASTM D1894 method using the Testing Machines Inc 32-06 lab tester. No slip
additives were incorporated into the film structure. As expected, there was a difference between
the static and kinetic COF within each film structure variable. The static COF was higher in all
cases compared to the kinetic COF. Sample 1A which is 100% HDPE showed the overall lowest
static and kinetic COF of all film structure variables. Sample 1B which was the 100% PLA
demonstrated slightly higher both static and kinetic COF values but was not statistically
significant compared to all samples. Samples 2,3,5,6 showed a trend that as the PLA content was Coefficient of Friction - O/O
PLA Content (Gauge %)
0 20 40 60 80 100
O/ O C OF 0.2 0.4 0.6 0.8 1.0 Sample 1A Sample 6 Sample 5 Sample 4 Sample 3
Sample 2 Sample 1C
Sample 1B
1B
w/o IM IM
Sample 1A - 0% PLA Sample 1B - 100% PLA Sample 1C - 100% PLA + IM
• Static
• Kinetic
44
increased the COF values both static and kinetic remained consistent to each other. However,
sample 4 showed just the opposite trend. Sample 4 was 50% PLA and it demonstrated the
highest static and kinetic COF of all film structure variables.
[image:52.612.88.494.267.595.2]9.5 Tear Resistance (Notched)
Figure 16. CD & MD notched tear resistance of film structure variables
Notched Elmendorf Tear Force
PLA Content (Gauge %)
0 20 40 60 80 100
T ear For c e (g ) 0 20 40 60 80 100 Sample 1A Sample 6 Sample 5 Sample 4
Sample 3 Sample 2
Sample 1C
Sample 1B
1B
w/o IM IM
Sample 1A - 0% PLA Sample 1B - 100% PLA Sample 1C - 100% PLA + IM
• CD
• MD
45
In Figure 16 the film structures were tested for notched CD and MD tear resistance in
accordance with ASTM D1922 method using the Thwing-Albert Elmendorf lab tester. Sample
1A which was 100% HDPE showed consistent tear resistance force both MD and CD. Sample
1B which was 100% PLA showed consistently low tear resistance force both MD and CD. This
was to be expected with the crystalline structure of PLA the polymer once the tear propagation
was initiated it facilitated propagation to tear. This was validated in Sample 1C with a less
crystalline film structure when the impact modifier was added and the tear resistance force
increased significantly in both but particularly in the CD direction. However, with the exception
of sample 6 when the PLA content was increased and the HDPE content reduced the tear
resistance force remained similar. Once the film structure is notched it takes on the tear
46
[image:54.612.94.501.132.471.2]9.6 Tear Resistance (Un-Notched)
Figure 17. CD & MD un-notched tear resistance of film structure variables
In Figure 17 the film structures were tested for unnotched CD and MD tear resistance in
accordance with ASTM D1922 method using the Thwing-Albert Elmendorf lab tester. Sample
1A which was 100% HDPE demonstrated high tear resistance force both MD and CD. Sample
2-5 which showed un-notched tear resistance force both MD and CD to be similar and lower. This
Un-Notched Elmendorf Tear Force
PLA Content (Gauge %)
0 20 40 60 80 100
T ear For c e (g ) 40 60 80 100 120 140 160 Sample 1A Sample 6 Sample 5 Sample 4 Sample 3 Sample 2 Sample 1C Sample 1B 1B w/o IM IM
Sample 1A - 0% PLA Sample 1B - 100% PLA Sample 1C - 100% PLA + IM
• CD
• MD
47
was to be expected as the PLA content was increased the tear resistance to force reduced. This
was due to the more non crystalline structure of HDPE polymer that is more resistance to tear.
[image:55.612.102.511.244.552.2]9.7 Puncture Resistance
Figure 18. Maximum puncture resistance of film structure variables
In Figure 18 the film structures were tested for maximum puncture resistance in
accordance with ASTM D3763 method using the Instron- Dynatup lab tester. Sample 1A like
Sample 6 both showed the highest resistance to puncture compared to the rest of the samples.
Puncture Resistance
PLA Content (Gauge %)
0 20 40 60 80 100
P unct ure Res is tance (f t/ lbs) 0 2 4 6 8 Sample 1A Sample 6 Sample 5
Sample 4 Sample 3
Sample 2 Sample 1C Sample 1B 1B w/o IM IM
Sample 1A - 0% PLA Sample 1B - 100% PLA Sample 1C - 100% PLA + IM
• In to Out
• Out to In
48
The trend demonstrated was as the PLA percent content increased the puncture resistance
reduced. Conversely as the HDPE content increased the puncture resistance increased.
[image:56.612.85.506.191.530.2]9.8 Secant Modulus (MD)
Figure 19. Machine direction secant modulus of film structure variables
In Figure 19 the film structures were tested for 1%-3% MD modulus in accordance with
ASTM D882 method using the Instron – 5566 lab tester. Sample 1A like Sample 6 both showed
Secant Modulus - MD
PLA Content (Gauge %)
0 20 40 60 80 100
M
D S
ecant
M
odu
lus (P
S
I)
0 100000 200000 300000 400000 500000
Modulus 1% MD Modulus 2% MD Modulus 3% MD
1B
49
the lowest MD modulus compared to the rest of the samples. The trend demonstrated as the PLA
content increased the MD modulus increased proportionally. PLA is a more crystalline polymer
and as expected the stiffness which directly impacted the increased modulus.
[image:57.612.83.510.197.571.2]9.9 Secant Modulus (CD)
Figure 20. Cross direction secant modulus of film structure variables
In Figure 20 the film structures were tested for 1%-3% CD modulus in accordance with
ASTM D882 method using the Instron – 5566 lab tester. Sample 1A like Sample 6 both showed
Secant Modulus - CD
PLA Content (Gauge %)
0 20 40 60 80 100
C
D
S
ec
ant
M
odulus
(
P
S
I)
0 100000 200000 300000 400000 500000
Modulus 1% CD Modulus 2% CD Modulus 3% CD
1B
50
the lowest CD modulus compared to the rest of the samples. The 1% modulus trend was
inconclusive however, the trend of 2%-3% modulus demonstrated as the PLA content was
increased the CD modulus increased proportionally. This was to be expected as PLA is a more
crystalline polymer which would directly affected the modulus. There was a noted difference
between the MD and CD modulus with the MD modulus having slightly higher values overall
which resulted from the cast film orientation process.
9.10 Tensile (MD)
Figure 21. Machine direction peak percent elongation of film structure variables Peak Elongation % - MD
PLA Content (Gauge %)
0 20 40 60 80 100
Peak
Elon
g
ation
(
%
)
0 200 400 600 800 1000 1200 1400
1B
Sample 1A
Sample 6
Sample 5
Sample 4 Sample 3 Sample 2 Sample 1C Sample 1B
51
Figure 22. Machine direction peak load of film structure variables
Peak Load - MD
PLA Content (Gauge %)
0 20 40 60 80 100
Peak Load
(g
)
0 2000 4000 6000 8000 10000
Sample 1A Sample 6
Sample 5
Sample 4 Sample 3
Sample 2
Sample 1C
IM Sample 1B
w/o IM
Sample 1A - 0% PLA Sample 1B - 100% PLA Sample 1C - 100% PLA + IM
52
Figure 23. Machine direction tensile strength at break of film structure variables
In Figure 23 the film structures were tested for MD tensile load in accordance with
ASTM D882 method using the Instron – 5566 lab tester. Sample 1A like Sample 6 both showed
the highest MD peak elongation compared to the rest of the samples. The samples that contained
higher percentages of PLA demonstrated very low levels of peak elongation. The film samples
rather than elongating failed at high levels of peak load and load at break. When the PLA content
was increased the peak load and load at break increased respectively. Sample 2 which was a high
percentage of PLA showed the highest of level of peak at load and load at break of all film
structure candidates.
Tensile Strength at Break - MD
Sam ple 1
A - 0 %
Sam ple 1
B - 1 00%
Sam ple 1
C 100
% + IM
Sam ple 2
- 7 8%
Sam ple 3
- 6 2%
Sam ple 4
- 5 0%
Sam ple 5
- 2 4%
Sam ple 6
53
9.11 Tensile Strength (CD)
Figure 24. Cross direction peak elongation of film structure variables
Peak Elongation % - CD
PLA Content (Gauge %)
0 20 40 60 80 100
P
eak
E
long
at
ion (%
)
0 10 20 30 40 50 60 70
Sample 1A - 0% PLA Sample 1B - 100% PLA Sample 1C - 100% PLA + IM
1B
Sample 1A Sample 5 Sample 4 Sample 3 Sample 2 Sample 1C
IM
Sample 1B
54
Figure 25. Cross direction peak load of film structure variables
Peak Load - CD
PLA Content (Gauge %)
0 20 40 60 80 100
Peak
Lo
ad
(
g
)
0 2000 4000 6000 8000
Sample 1A Sample 6
Sample 5
Sample 4 Sample 3
Sample 2
Sample 1C
IM
Sample 1B
w/o IM
Sample 1A - 0% PLA Sample 1B - 100% PLA Sample 1C - 100% PLA + IM
55
Figure 26. Cross direction tensile strength at break of film structure variables
In Figure 26 the film structures were tested for CD tensile load in accordance with ASTM
D882 method using the Instron – 5566 lab tester. All samples demonstrated low peak CD percent
elongation with the exception of sample 6. This was likely a result to the low CD film orientation
in the cast film process. The film samples rather than elongating failed at high levels of peak load
and load at break. As PLA content increased the peak load and load at break increased
respectfully. Sample 1B which was the 100% PLA did show the highest CD peak to load of any
of the film structure variables. Samples 2, 3, and 6 showed unusually high standard deviation due
to small size and single data points that were significant different from the group.
Tensile Strength at Break - CD
Sam ple 1
A - 0 %
Sam ple 1
B - 1 00%
Sam ple 1
C - 1 00%
+ IM
Sam ple 2
- 7 8%
Sam ple 3
- 6 2%
Sam ple 4
- 5 0%
Sam ple 5
- 2 4%
Sam ple 6
56
[image:64.612.103.504.125.462.2]9.12 OTR Permeation
Figure 27. Oxygen transmission permeation rate of film structure variables
In Figure 27 the film structures were tested for oxygen transmission in accordance with
ASTM D3985 method using the MOCON OX- TRAN 2/20 lab tester. Sample 1B that is a 100%
PLA film structure demonstrated the lowest level of permeation of all the film structure
variables. Sample 1C with the impact modifier actually had a negative impact on barrier as it
reduced the amount of PLA as a percentage in the overall total thickness. As expected, HDPE
Oxygen Transmission Rate
PLA Content (Gauge %)
0 20 40 60 80 100
OTR ( c c /100 in 2 /24 hour s ) 0 20 40 60 80 Sample 1A Sample 6 Sample 5 Sample 4 Sample 3 Sample 2
Sample 1C Sample 1B IM
w/o IM
1B
57
polymer is a non polar and oxygen gas is a non polar molecule. The polymer polarity of HDPE
readily absorbs non polar molecules such as oxygen. Demonstrated as the HDPE content
increases the oxygen permeability increases. PLA polymer is polar polymer and the polymer
demonstrates a reduction in permeability of oxygen as a non polar gas.
[image:65.612.89.520.306.608.2]9.13 WVTR Permeation
Figure 28. Water vapor transmission rate of film structure variables
Water Vapor Transmission Rate
PLA Content (Gauge %)
0 20 40 60 80 100
W V T R ( g /100 in 2 /24 hour s ) 0.0 0.2 0.4 0.6 0.8 1.0 1.2 1.4 Sample 1A Sample 6
Sample 5 Sample 4
Sample 3
Sample 2
Samples 1B and 1C Failed
58
In Figure 28 the film structures were tested for moisture transmission in accordance with
ASTM F1249 method using the MOCON PERMATRAN-W® Model 3/33 lab tester. Sample 1B
and 1C that is 100% PLA and 100% PLA plus impact modifier respectfully failed since the
moisture permeation was elevated for the testing apparatus. PLA is a polar hydrophilic polymer
which inherently has infinity to moisture. Sample 1A and 6 both demonstrated the lowest
moisture permeation performance of all film structure variables. As expected, HDPE is a non
polar hydrophobic polymer which provides a reduction in permeation to the polar water
molecule. The trend demonstrated moisture permeation decreases as the percent of HDPE