City, University of London Institutional Repository
Citation
:
Stumpf, S., Rajaram, V., Li, L., Wong, W-K., Burnett, M., Dietterich, T. G., Sullivan, E. and Herlocker, J. (2009). Interacting meaningfully with machine learning systems: Three experiments. International Journal of Human Computer Studies, 67(8), pp. 639-662. doi: 10.1016/j.ijhcs.2009.03.004This is the accepted version of the paper.
This version of the publication may differ from the final published
version.
Permanent repository link: http://openaccess.city.ac.uk/12417/
Link to published version
:
http://dx.doi.org/10.1016/j.ijhcs.2009.03.004Copyright and reuse:
City Research Online aims to make research
outputs of City, University of London available to a wider audience.
Copyright and Moral Rights remain with the author(s) and/or copyright
holders. URLs from City Research Online may be freely distributed and
linked to.
City Research Online: http://openaccess.city.ac.uk/ [email protected]
Interacting Meaningfully with Machine Learning Systems:
Three Experiments
1
Simone Stumpf, Vidya Rajaram, Lida Li, Weng-Keen Wong,
Margaret Burnett, Thomas Dietterich, Erin Sullivan, Jonathan Herlocker
Oregon State University
School of Electrical Engineering and Computer Science
Corvallis, OR 97331 USA
1-541-737-3617
{stumpf,rajaramv,lili,wong,burnett,tgd,sullivae,herlock}@eecs.oregonstate.edu
ABSTRACT
Although machine learning is becoming commonly used in today’s software, there has been little research into how end users might interact with machine learning systems, beyond communicating simple "right/wrong" judgments. If the users themselves could work hand-in-hand with machine learning systems, the users’ understanding and trust of the system could improve and the accuracy of learning systems could be improved as well. We conducted three experiments to understand the potential for rich interactions between users and machine learning systems. The first experiment was a think-aloud study that investigated users’ willingness to interact with machine learning reasoning, and what kinds of feedback users might give to machine learning systems. We then investigated the viability of introducing such feedback into machine learning systems, specifically, how to incorporate some of these types of user feedback into machine learning systems, and what their impact was on the accuracy of the system. Taken together, the results of our experiments show that supporting rich interactions between users and machine learning systems is feasible for both user and machine. This shows the potential of rich human-computer collaboration via on-the-spot interactions as a promising direction for machine learning systems and users to collaboratively share intelligence.
1. INTRODUCTION
A new style of human-computer interaction is emerging, in which some reasoning and intelligence reside in the computer itself. These intelligent systems and user interfaces attempt to adapt to their users’ needs, to incorporate knowledge of the individual’s preferences, and to assist in making appropriate decisions based on the user's data history. These approaches use artificial intelligence to support the system’s part of the reasoning. One increasingly common approach being brought to intelligent systems and user interfaces is machine learning, in which the system learns new behaviors by examining usage data.
Traditionally, machine learning systems have been designed and implemented off-line by experts and then deployed. Recently however, it has become feasible to allow the systems to continue to adapt to end users by learning from their behavior after deployment. Interactive email spam filters, such as in Apple’s Mail system, are prime examples.
Although machine learning is often reasonably reliable, it is rarely completely correct. One factor is that statistical methods require many training instances before they can reliably learn user behavior. Sometimes correctness is not critical. For example, a spam filter that successfully collects 90% of dangerous, virus-infested spam leaves the user in a far better situation than having no spam filter at all. But sometimes overall correctness or even correctness for certain types of data (such as data from a specific class or data with a particular combination of features) is important. For example, recommender systems that recommend substandard suppliers or incorrect parts, language translators that translate incorrectly, decision support systems that lead the user to overlook important factors, and even email classifier algorithms that misfile important messages could cause significant losses to their users and raise significant liability issues for businesses. Further, too much inaccuracy in "intelligent" systems erodes users’ trust.
When accuracy matters, allowing the user to help could make a crucial difference. Therefore, approaches have begun to emerge in which the user and the system interact with each other, not just to accomplish the goal of the moment, but also to improve the system's accuracy in its services to the user over the longer term. Our work falls under the general category of mixed initiative user interfaces, in which users collaboratively interact with intelligent systems to achieve a goal (Horvitz 1999).
As Section 2 explains, this direction is still in its infancy: the norm for the few machine learning systems that communicate with users at all is to allow the user to indicate only that a prediction was wrong or to specify what the correct prediction should have been. This is just a glimpse of the rich knowledge users have about how to make the correct prediction. We began to consider whether end users might be able to provide rich guidance to machine learning systems. We wondered whether enabling them to provide this guidance could substantially improve the speed and accuracy of these systems, especially early on in training when machine learning does not possess a lot of knowledge.
Many questions arise from this possibility. Will users be interested in providing rich feedback to machine learning systems? If so, what kind of advice will they give? Will their feedback be usable by machine learning algorithms? If so, how would the algorithms need to be changed so that they could make use of this feedback? In this paper, we begin an exploration of these questions. The overall premise we explore is that, if the machine learning system could explain its reasoning more fully to the user, perhaps the user would, in return, specify why the prediction was wrong and provide other, rich forms of feedback that could improve the accuracy of machine learning.
There are implications for both directions of the communication involved in this premise. First, the system’s explanations of why it has made a prediction must be usable and useful to the user. Second, the user’s explanations of what was wrong (or right) about the system’s reasoning must be usable and useful to the system. Both directions of communication must be viable for production/processing by both the system and the user.
As a first step to investigate possibilities for both directions of communication, we conducted three studies. The first was a think-aloud study with email users, to inform the design of future machine learning systems aiming to support such communications. In this first study, machine learning algorithms sorted email messages into folders and explained their reasoning using three different explanation paradigms: Rule-based, Keyword-based, and Similarity-based. The participants were asked to provide feedback to improve the predictions. No restrictions were placed upon the form or content of participants’ feedback. We then conducted two follow-up experiments, in which we changed our machine learning algorithms to make use of some of what the users advised in the first study, evaluating the results. In both of these experiments, we conducted off-line experiments to investigate how some of the user feedback could be incorporated into machine learning methods and to evaluate the effectiveness of doing so.
Thus, our research questions were:
RQ 1. How canmachine learning systems explain themselves such that (a) end users can understand the system’s reasoning, and (b) end users are willing to provide the system rich, informative feedback with potential to improve the system’s accuracy?
RQ 2. What types of feedback will end users give? That is, how might we categorize the nature of their feedback from the perspective of machine learning, and what sources of background knowledge underlie users’ feedback?
RQ 3. Can these types of user feedback be assimilated by existing learning algorithms? If so, exactly how could some of these types of user feedback be incorporated into machine learning algorithms, and does doing so actually improve the performance of algorithms?
2. RELATED WORK
2.1 Explanations
(Lieberman and Kumar 2005). There is some evidence that transparency via explanations is a major factor towards establishing trust in adaptive agents (Glass et al. 2008; Pazzani 2000).
As a first step the learning system itself needs to be capable of producing a comprehensible explanation of its results. The bulk of the literature on explaining intelligent systems has focused on explaining expert systems based on deductive logic or rules (Swartout 1983; Clancey 1983; Wick and Thompson 1992; Johnson 1994). In contrast, much less attention has been given to explaining learning systems. Although some learning algorithms such as decision trees (Quinlan 1993) are capable of readily providing explanations of the underlying reasoning, the majority of learning algorithms employ a statistical or mathematical approach, which is much more challenging to explain than a logic-based system. Prior work has focused on linear additive models that associate a weight with each feature and produce a result by summing up these weighted features. These linear additive models, such as naïve Bayes, logistic regression and linear support vector machines, can be explained through showing how the weight on each feature contributes to the overall prediction and a graph or chart can be used for visualization (Becker et al. 2001; Kononenko 1993; Mozina et al. 2004; Poulin et al. 2006, Ridgeway et al. 1998). Apart from linear additive classifiers, explanation methods have also been developed to explain the computation of posterior probabilities for Bayesian networks. These computationally expensive explanation algorithms for Bayesian networks consist of finding the subset of evidence that most influences the posterior probability and visualizing the flow of evidence through the network during inference (Suermondt 1992; Chajewska and Draper 1998; Lacave and Diez 2002).
These existing explanation techniques are helpful to machine learning experts who understand the underlying algorithms but they are typically not reasonable for an end user with no background in machine learning. Another explanation strategy is to create a more comprehensible representation of the learned model. This approach balances the issues of fidelity and comprehensibility (Craven 1996; vand de Merckt and Decaestecker 1995). Examples of these approaches include pruning to simplify decision trees (Bohanec and Bratko 1994; Cunningham et al. 1996) and inducing comprehensible models, such as decision trees (Craven 1996), from neural networks, which are notoriously difficult for a human to understand. These approaches to explanation are purely intended to illustrate the system's behavior to the end user and abstract away from the actual details of the underlying algorithm. All of the explanation techniques mentioned thus far are static presentations to the end user. In our approach, we require the explanations to be interactive such that changes to the explanations made by the user can be incorporated back into the machine learning algorithm.
2.2 Incorporating User Feedback
We also require end users to provide corrective feedback to these explanations and this feedback needs to be incorporated into the machine learning algorithm. Different methods for gathering user feedback have been investigated, along a spectrum of formality and richness. An obvious way to gather user feedback is to allow interactions in natural language (Blythe 2005). Semi-formal types of feedback that have been shown to be preferred by users make use of editing feature-value pairs (McCarthy et al. 2005; Chklovski et al. 2005). A large body of work employing user feedback falls under the topic of
programming by demonstration, which enables a system to learn a procedural program interactively from user demonstrations (Cypher 1993; McDaniel and Myers 1999; Lieberman 2001). For example, the process might be ordering an item from an on-line web-site. With some exceptions (Oblinger et al. 2006), the user is not usually given the opportunity to provide feedback about the reasoning behind the learned program. So far there has been a lack of research that integrates an investigation into the understanding of machine learning systems’ explanations with an analysis of the content of the rich feedback users give when they have an unconstrained opportunity to do so.
Once the user feedback has been obtained, it needs to be incorporated into the machine learning algorithm. One of the simplest techniques for incorporating a user’s feedback is to allow the user to interactively generate additional training examples. This technique is employed in the CRAYONS system (Fails and Olsen 2003), in which the user interactively selects foreground and background pixels in an image. In machine learning, one of the most common approaches for interacting with an end user is active learning (Mackay 1992; Cohn et al. 1996; Tong and Koller 2002). An active learning algorithm operates in a loop in which the first step is to ask the user to label a training instance that would provide the most information regarding the classification task. Once the label is provided by the user, the active learning algorithm updates its parameters with the new training instance and the loop continues if the accuracy of the classifier is still unsatisfactory. All of the approaches mentioned thus far interact with the user through labels on the training examples. While labels are typically easy for a user to provide, the user may need to provide a large number of labels before the desired level of accuracy is reached. A potentially more efficient way to incorporate user feedback is to provide feedback that extends beyond just providing class labels. This feedback, which we will call rich feedback, involves incorporating more expressive forms of corrective feedback which can cause a deeper change in the underlying machine learning algorithm.
learning algorithm. There is a vast body of literature on incorporating domain knowledge into learning (eg. Towell and Shavlik 1994, Haddawy et al. 2003, Langseth and Nielsen 2003, Yu 2007). Some recent work has allowed richer expressions of domain knowledge to be included into learning algorithms. Examples of this rich domain knowledge include qualitative monotonicities, which allow statements such as "higher values of X are more likely to produce higher values of Y" (Altendorf et al. 2005), and polyhedral knowledge sets (Fung et al. 2002), which describe regions of the input space that are known to contain certain classes of data points. Maclin and Shavlik (Maclin and Shavlik 1996) allow the user to interactively provide advice to a reinforcement learner using an imperative programming language. This rich domain knowledge is often incorporated using a constraint-based approach. Since most learning algorithms involve an optimization problem either during training or during inference, this domain knowledge is added to the model by incorporating these constraints during the optimization (Altendorf et al. 2005; Fung et al. 2002).
However, the incorporation of rich feedback has several key characteristics that distinguish it from much of the existing work on incorporating domain knowledge. First, domain knowledge is typically elicited from a domain expert and then encoded in the machine learning algorithm by the algorithm designer; this step occurs before the machine learning system is deployed. In contrast, our paper investigates rich feedback provided by an end user after the machine learning system is deployed. This is for situations in which the system cannot begin learning until after it is deployed as it needs to customize itself to the end user, who will have a different set of preferences than the algorithm designer. Second, in our problem setting, the end user, unlike the algorithm designer, is not an expert in machine learning. Consequently, the end user needs to be able to express his or her corrective rich feedback in a form that can be integrated into the learning algorithm without requiring the end user to have a deep understanding of the details of the learning algorithm. Finally, rich feedback is provided in an interactive setting, which requires learning algorithms that can be re-trained quickly with the newly acquired knowledge and also requires learning algorithms to be responsive to the corrective feedback in order to encourage user interaction.
In this interactive, rich feedback setting, constraint-based approaches are also frequently used. CueTIP (Shilman et al. 2006) uses user corrections as constraints for handwriting recognition. In Culotta et al. (Culotta et al. 2006), constraints are used to aid in information extraction. Huang and Mitchell (Huang and Mitchell 2006) use user feedback as constraints to refine a clustering algorithm. Other approaches include learning a similarity metric from the rich user feedback (Fogarty et al. 2008), clustering documents using a set of user-selected representative words for each class (Liu et al. 2004), allowing the user to directly build a decision tree for the data set with the help of visualization techniques (Ware et al. 2001). In Experiment #2 and Experiment #3, we propose two additional approaches for incorporating rich user feedback into machine learning that are viable in this interactive setting.
2.3 Email Classification by Learning Systems
Our research takes place in the domain of email classification by a learning system. Various learning algorithms, trained by end users, have been developed to predict the set of categories or folders defined by users associated with email messages (Brutlag and Meek 2000; Cohen 1996; Shen et al. 2006; Segal and Kephart 1999; Segal and Kephart 2000). Furthermore, there have been some efforts to automatically classify emails, unsupervised by a user (Kushmerick et al. 2006; Dredze et al. 2006). Email classification shares a number of issues and problems with machine learning in general. The reported accuracy of all these algorithms indicates that email classification is a very challenging problem. The challenges stem from numerous factors, such as imbalanced categories, incomplete information in the email messages, and the fact that the categories (folders) set up by the users are often idiosyncratic and non-orthogonal. With the given low accuracy, some research has been directed at helping users understand how these classifications have been made (Pazzani 2000; Crawford et al. 2002a, 2002b) but these approaches do not allow explanations from users back to the system to improve subsequent prediction. All these challenges further motivated our interest in studying rich user feedback and its potential in improving machine learning algorithms.
3. EXPERIMENT #1: EXPLAINING SYSTEM BEHAVIOR AND GETTING FEEDBACK FROM
USERS
Experiment #1 was a formative study. Its purpose was to investigate RQ 1 and RQ 2, namely how machine learning systems should explain themselves to end users, and what kinds of improvement feedback end users might give to the machine learning systems.
3.1 Design, Participants and Procedure
dataset (Klimt and Yang 2004). The original Enron user had categorized these email messages into four email folders: Personal (36 messages), Resumé (27 messages), Bankrupt (23 messages) and Enron News (36 messages).
We employed a qualitative "think-aloud" design in order to extract the richest possible data from the participants. We observed and videotaped their activities and comments throughout the experiment, as well as collecting their work products. As the first step of our procedure, learning algorithms classified each email message. Then, three explanations of each result were generated: a Rule-based, a Keyword-based, and a Similarity-based explanation. The application of the classification algorithms and the generation of explanations, described in the next section, were all done off-line prior to the experiment. We used the outcomes of these two steps to make the participants’ interactions with our low-fidelity prototype possible. To allow as thorough investigation of users’ potential as possible, it was important to encourage participants to express feedback freely. Because low-fidelity prototypes do not implement full functionality and avoid the impression of a "finished" product, paper-based low-fidelity prototypes are often used to encourage participant feedback (Rettig 1994). Thus, we used printouts of emails instead of an on-line display. A second advantage to this set-up was that it allowed for flexibility and ease of feedback. Using pens, printouts, and a big table to support spatial arrangements (Figure 1), participants could move papers around to compare them, scratch things out, draw circles, or write on them in any way they chose (Figure 2).
The participants were 13 graduate and undergraduate students (7 females, 6 males). All had previous experience using computers but did not have computer science backgrounds. All were native English speakers. An overview of participant backgrounds is given in Appendix A. The experiment followed a within-subject design, in which each participant experienced all three explanation paradigms. We counterbalanced learning effects in our design by randomizing the order of explanation paradigms that each participant experienced.
The experiment was conducted one participant at a time with a facilitator interacting with the participant and an observer taking additional notes. First, the participant was familiarized with thinking aloud. Next, he or she looked through 40 sample pre-classified email messages to become familiar with the folders and to develop an intuition for how new email messages should be categorized; this sample was kept the same across participants. At this point, the main task began, divided into three 15-minute blocks (one per explanation paradigm) of processing the remainder of email messages from the dataset. For the main task, we randomized assignments of emails to explanation paradigms to avoid exclusive association of an email with just one paradigm. For each message, the facilitator handed a new printout to the participant, who decided whether the predicted folder classification was correct, reclassified the message if needed, and gave feedback to improve the classification if needed. The participants were told that an evolving "virtual email assistant" had been implemented, and that we wanted their help "in order to get these predictions working as well as they possibly can."
[image:6.612.331.547.517.703.2]After each paradigm’s 15-minute block, participants provided subjective self-evaluations of mental effort, time pressure, overall effort, performance success, and frustration level, based on standard NASA TLX questions (Hart and Staveland 1988). They also took a comprehension test for that paradigm. Finally, at the end of the study, they compared and ranked all three explanation paradigms in terms of overall preference, ease of understanding, and ease of feedback.
Figure 1: Lo-fi prototype set-up with pens, printouts,
[image:6.612.82.265.555.691.2]3.2 Materials: Explanations of the Learning Algorithms
We generated three different explanations to explore aspects underlying their respective understandability (RQ 1) and their impact on user feedback (RQ 2). We generated the explanations under the following three principles:
(Principle 1) Common algorithms: We focused on standard implementations of machine learning algorithms found in Weka (Witten and Frank 2005) that were viable for (a) generating explanations and (b) good performance in the email domain.
(Principle 2) Comprehensible but faithful explanations: It does not seem reasonable to provide end users with an explanation that requires a mathematical or statistical background. Instead, we sought to develop explanations that would be informal, yet accurate enough to engender useful mental models of this reasoning, analogous to "naïve physics" descriptions of qualitative physics.
(Principle 3)Concrete explanations: The explanations were required to be in terms of specific features that were visible in the current email message. In machine learning terms, each feature is an attribute that helps describe an email. In a bag-of-words approach, which is characteristic of our algorithms, the bag-of-words that appear in emails are considered to be individual features.
3.2.1 Learning Algorithms and Training
We chose two learning algorithms to satisfy Principle 1: the Ripper rule-learning algorithm (Cohen 1996) and the Naïve Bayes algorithm (Mitchell 1997). These algorithms have been widely applied for email classification (e.g., Cohen 1996; Dalvi et al. 2004; Shen et al. 2006). Additionally, these algorithms can easily produce explanations of their results, which satisfies Principles 2 and 3. To obtain a prediction for each of the 122 email messages, we performed a stratified 5-fold cross-validation.
Prior to training, each email message was preprocessed to remove headers and common "stop" words. The remaining words were stemmed by Porter’s method to remove word endings (Porter 1980). Each email message was then represented as a Boolean vector with a Boolean feature for each observed email sender (the From field), one Boolean feature for each observed set of email recipients (the union of the From, To, CC, and BCC fields, in essence identifying the "team" of people to which the message relates (Shen et al. 2006)), and one Boolean feature for each distinct word observed in the Subject and Body fields.
Ripper learns a set of classification rules. The rules are ordered by class but unordered within class. Hence, to make a prediction, Ripper first applied the rules for the least frequent class (Bankrupt in our dataset). If one of these rules matched the email message, it was classified as Bankrupt. Otherwise, Ripper moved on to the rules for the next most frequent class (Resume), and so on. There were no rules for the most frequent class (Enron News); it was treated as the default if none of the rules for the other classes matched.
Naïve Bayes estimates the probability of each folder given the email message. Let the random variable
}
,...
,
{
f
1f
2f
mF
∈
represent a folder that the email message can be filed under. The variable F can take on m possible values, corresponding to the m folders. Additionally, let the vectorW
=
(
w
1,
w
2,...
w
n)
be an email message where each componentw
irepresents a feature of the email. More precisely, eachw
i is a Boolean variable indicating the presence or absence of a particular word in the email. The goal of the Naïve Bayes algorithm is to calculate the posterior probability)
|
(
F
f
W
P
=
k . The Naïve Bayes algorithm simplifies the calculation of this posterior probability by making the assumption that probability of the each featurew
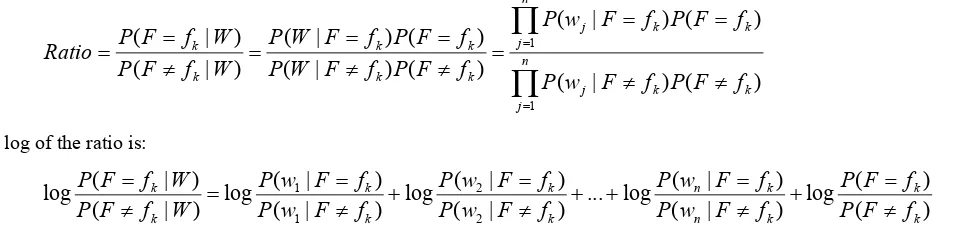
i is conditionally independent given the folder F. The mathematical details of the Naïve Bayes algorithm are shown in Figure B1 in Appendix B.The overall accuracy of the predictions was not particularly high: 60% for Naïve Bayes and 75% for Ripper when used to classify the entire set of emails. We would have preferred higher accuracy and equal accuracy between algorithms. Still, high accuracy was not required to answer our experiment’s research questions, and our analysis takes accuracy differences into account.
3.2.1 Generating Explanations
We generated the Keyword-based and Similarity-based explanations from the learned Naïve Bayes classifier algorithm, as follows.
Consistent with our third design principle ("visible words only"), the Keyword-based explanations (Figure 4) listed and highlighted up to five words present in the email message having the largest positive weights as well as up to five words
present in the email message having the most negative weights. (As we will discuss later, users found this latter set of "negative" words counter-intuitive. They are the words whose presence in the message reduces the certainty of the classifier in the sense that the classifier would be more confident if these words did not appear.)
The Similarity-based explanations (Figure 5) showed the training email message that, if deleted from the training set, would have most decreased the score. This was typically the training example most similar to the email message being classified. This example was displayed and up to five words with the highest weights that appeared in both the example and the target email message were outlined to draw them to the attention of the user.
3.3 Analysis Methodology for Qualitative Data
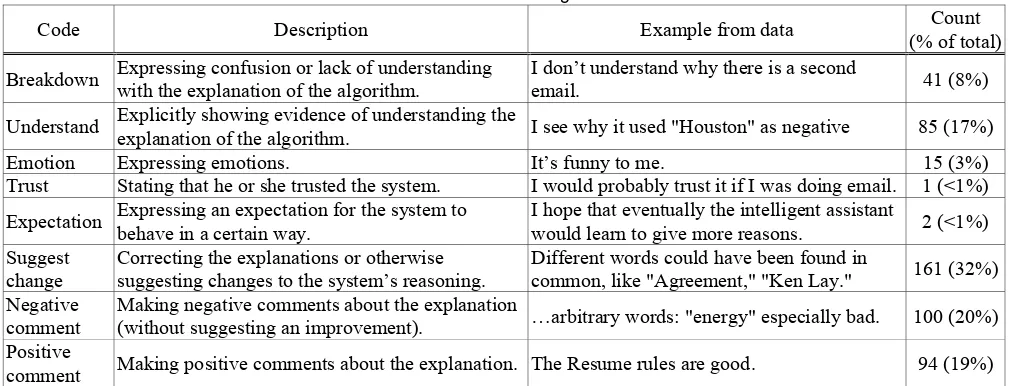
We analyzed the think-aloud data and questionnaire comments using two coding schemes. In the first coding scheme, we coded all user utterances with the goal of determining the reaction of users to the explanations to answer research question RQ 1. In the second coding scheme, we performed a more detailed analysis of only the utterances that constituted negative comments about the explanations or suggested changes to the learning algorithms. The goal of the second coding scheme was to classify the users’ feedback with respect to requirements for machine learning algorithms and the background knowledge required for the algorithms to be able to incorporate the feedback, in order to answer research question RQ 2. The first set of codes, along with a description and example are shown in the first three columns of Table 1. The second coding scheme is discussed in Section 3.4.4.
For both schemes, to ensure consistency in interpretation of the codes and when to use them, two researchers independently coded a small subset. They then iterated on this subset, further refining the codes and developing norms about how to apply them. After each iteration, agreement figures were calculated to test for coding reliability.
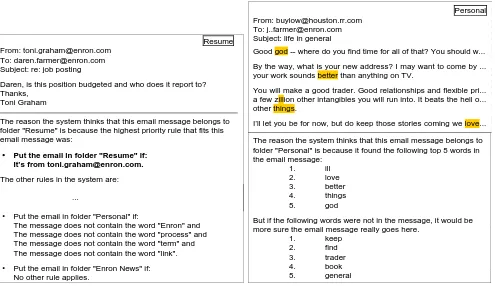
Resume From: [email protected]
To: [email protected] Subject: re: job posting
Daren, is this position budgeted and who does it report to? Thanks,
Toni Graham
The reason the system thinks that this email message belongs to folder "Resume" is because the highest priority rule that fits this email message was:
• Put the email in folder "Resume" if: It’s from [email protected].
The other rules in the system are:
...
• Put the email in folder "Personal" if:
The message does not contain the word "Enron" and The message does not contain the word "process" and The message does not contain the word "term" and The message does not contain the word "link". • Put the email in folder "Enron News" if:
No other rule applies.
Personal From: [email protected]
To: [email protected] Subject: life in general
Good god -- where do you find time for all of that? You should w... By the way, what is your new address? I may want to come by ... your work sounds better than anything on TV.
You will make a good trader. Good relationships and flexible pri... a few zillion other intangibles you will run into. It beats the hell o... other things.
I’ll let you be for now, but do keep those stories coming we love... The reason the system thinks that this email message belongs to folder "Personal" is because it found the following top 5 words in the email message:
1. ill
2. love
3. better
4. things
5. god
But if the following words were not in the message, it would be more sure the email message really goes here.
1. keep
2. find
3. trader
4. book
5. general
Figure 3: (Top): Email.
(Bottom): Rule-based explanation excerpt.
[image:8.612.54.549.75.361.2]Resume Message #2
From: [email protected] To: All ENW employees
Subject:enron net works t&e policy From: Greg Piper and Mark Pickering
Please print and become familiar with the updated ENW T&E Policy, which is attached. Changes to the policy include business-first travel, with supervisor approval, for international flights over 4 hours in duration (excluding Canada and Mexico). Supervisors will be responsible for making the decisions and bearing the expense for business-first travel.
If you have any questions about the policy or an expense not covered under the policy, please contact Tina Spiller or Lisa Costello. Wow! The message is really similar to the message #3 in "Resume" because #2 and #3 have important words in common.
_________________________________________________ Message #3
From: [email protected]
To: [email protected], [email protected], [email protected]
CC: [email protected] Subject: confirming requisitions
Confirming the open requisitions for your group. If your records indicate otherwise, please let me know.
Lisa Csikos 104355, 104001 Rita Wynne 104354
Daren Farmer 104210 Mike Eiben 104323 Pat Clynes 104285
The posting dates have all been updated to reflect a current posting date.
Thanks for your support!! Toni
Figure 5: (Top): Excerpt from email. (Bottom): Its Similarity-based explanation.
We calculated agreement in two ways. During the iterations, we used the Jaccard similarity index (Jaccard 1901) as a simple agreement measure. The Jaccard similarity index is calculated as the percentage of intersection of the codes divided by the union of all codes applied. For example, if one researcher gave the codes {Breakdown, Suggest Change} for one email and another researcher gave the codes as {Emotion, Suggest Change} for the same email, then the agreement was calculated as 1/3 (33%) as follows:
| } , { } , { | | } , { } , { | nge SuggestCha Emotion nge SuggestCha Breakdown nge SuggestCha Emotion nge SuggestCha Breakdown ∪ ∩
For the first coding scheme, the total agreement value was 81% for the first subset at the end of these iterations, which indicates high coding reliability. For the second coding scheme, the agreement was 82% after the iterations. At this point, the schemes were deemed robust enough, and the remaining data were then coded.
We also calculated the ending rater agreement using an extension of the Kappa statistic (Mezzich et al. 1981), which covers the non-exclusive application of codes. (Cohen's and Fleiss' Kappa in our situation are inappropriate as they assume mutually exclusive application of codes.) The results were consistent with the final Jaccard calculations: For the first coding scheme, Kappa was 0.80, for the second coding scheme Kappa was 0.86.
3.4 Results Of Experiment #1
[image:9.612.173.439.61.463.2]Table 1: The first coding scheme.
Code Description Example from data (% of total)Count
Breakdown Expressing confusion or lack of understanding with the explanation of the algorithm. I don’t understand why there is a second email. 41 (8%)
Understand Explicitly showing evidence of understanding the explanation of the algorithm. I see why it used "Houston" as negative 85 (17%)
Emotion Expressing emotions. It’s funny to me. 15 (3%)
Trust Stating that he or she trusted the system. I would probably trust it if I was doing email. 1 (<1%) Expectation Expressing an expectation for the system to behave in a certain way. I hope that eventually the intelligent assistant would learn to give more reasons. 2 (<1%) Suggest
change Correcting the explanations or otherwise suggesting changes to the system’s reasoning. Different words could have been found in common, like "Agreement," "Ken Lay." 161 (32%) Negative
comment
Making negative comments about the explanation
(without suggesting an improvement). …arbitrary words: "energy" especially bad. 100 (20%) Positive
comment Making positive comments about the explanation. The Resume rules are good. 94 (19%)
3.4.1 Explaining to Users: Understandability
3.4.1.1 Which Paradigms Did They Understand?
According to the participants’ responses to the questionnaires, the Rule-based explanation paradigm was the most understandable (Table 2). This was corroborated by their verbal remarks: Rule-based explanations generated three times as many remarks indicating understanding and less than a tenth the remarks indicating breakdowns as either Keyword-based or Similarity-based explanations.
Differentiating between shallow and deep understanding reveals further insights. "Shallow understanding" in this context means that participants were simply able to make the classification decision the same way as the explanation paradigms. To gather data needed to assess this aspect, the questionnaires included an email without a classification or explanation, and asked the participants to categorize it to a folder based on what the paradigm would predict. Nearly all participants categorized it correctly in the case of Rule-based explanations and Keyword-based explanations, but only 4 of the 13 participants categorized the email correctly in the Similarity-based case.
"Deep understanding" implies understanding the reasoning behind the classification decision of the explanation paradigms. The questionnaires included an email with a classification but without the explanation, and participants were asked why the paradigm would classify an email the way it did. For the Rule-based explanation paradigm, a majority of participants answered by giving a rule, and some even managed to reconstruct a close version of the actual rule that was applied. For Keyword-based explanations, nearly all participants answered with keywords, even managing to identify correctly some of the keywords used in the actual example. However, only three participants answered even close to correctly for the Similarity-based case.
The combined evidence, from the participants’ opinions and their inability to explain or reproduce the Similarity logic, is thus quite strong that the Similarity-based explanations had a serious understandability problem.
Table 2: Participants’ rankings from the written questionnaires. (Rank 1 is "understood the most.") Explanation Rank 1 Rank 2 Rank 3
Rule-based 9 2 2
Keyword-based 3 6 4 Similarity-based 1 5 7
3.4.1.2 What Factors Affected Understanding?
keyword list, and appropriateness of word choices.
Regarding understanding of the algorithm, some participants expressed understanding of the algorithm by describing the essential strategy, as in the following two quotes. This enabled them to predict system behavior.
P6 (on Rule-based): "I understand why it would just default to Enron, since that’s what the rule is."
P1 (on Similarity-based): "I guess it went in here because it was similar to another email I had already put in that folder."
In the case of the Keyword-based paradigm, some problems in understanding were caused by the negative keyword list. Nobody had anything positive to say about the inclusion of negative keywords in the explanation:
P6 (on Keyword-based): "So what does this mean (referring to 2nd set of words)?"
P8 (on Keyword-based): "I guess I really don’t understand what it’s doing here. If those words weren’t in the message?"
Finally, appropriateness of the word choices seemed to have an effect on understanding, especially if they were felt by participants to be common words or topically unrelated:
P1 (on Similarity-based): "‘Day’, ‘soon’, and ‘listed’ are incredibly arbitrary keywords."
3.4.1.3 Discussion: Understanding
In addition to the clear evidence of understandability problems for Similarity-based explanations, we would like to point out three results of particular interest.
First, although Rule-based explanations were consistently understandable to more than half the participants and, at least for this group of participants, seemed to "win" over the other two paradigms, note that about one-third of the participants preferred one of the other explanation paradigms. This implies that machine learning systems may need to support multiple
explanation paradigms in order to effectively reach all of their users.
Second, Keyword-based explanations seemed to be reasonably understandable except for the negative keyword list, which our results suggest was a problem. There are several potential remedies. One possibility is that the negative keyword list could be explained in some different way to give users a better understanding of how the algorithm works. For example, instead of drawing attention to words with negative weights that are present in the email, the explanation could make use of the strongest negative weights associated with words that are absent from emails, since their absence increases the confidence of the learning algorithm. Another possibility is that the negative keyword list should be omitted from the explanation altogether.
Third, the topical appropriateness of word choices seemed particularly critical to participants’ ability to predict and understand system behavior. This knowledge is too complex to be learned from only 122 email messages, but it could be possible in larger document collections; we will return to this point in Section 3.4.4.2.
3.4.2 Explaining to Users: Preferred Paradigms and Why
Following the understanding trends, participants’ rankings favored the Rule-based explanations over the other two (Table 3). Still, nearly 50% of the participants chose a paradigm other than Rule-based as their favorite, so the Rule-based paradigm did not receive a clear mandate.
We expected preference to closely follow understanding trends, but analysis of the Positive Comments, the positive Emotion codes, and the questionnaire responses provided additional useful insights into factors that seemed to affect participants’ preferences in positive ways. These remarks fell into four categories, three of which (approval of reasoning soundness, clear communication of reasoning, and perceived accuracy) tie at least somewhat to understandability.
Participants’ approval of soundness of reasoning was remarked upon often. Also, clear communication of reasoning, which is distinctly different from the mere presence of sound reasoning, mattered to a number of our participants. For example, Participant 1’s comment below is fairly representative of several about the reasoning itself, whereas Participant 10’s comment exemplifies several comments specifically about communication of the reasoning:
High accuracy, as perceived by the participants, was remarked upon often. (We will return to the influence of actual
accuracy in Section 3.4.3). For example:
P11 (on Rule-based): "I think this is a really good filter. Put in Resume if it’s from toni.graham"
P2 (on Similarity-based): "Similarity was my favorite - seemed the most accurate, and took email addresses into account."
The fourth category was unexpected: Several participants appreciated Similarity-based explanations’ less technical style of expression, a characteristic we inadvertently introduced in our wording that emphasizes similarity ("Wow!"). This introduction of informality in the form of slang produced a number of Positive Comments for that explanation paradigm, pointing out possible benefits from relaxing the language style used in explanations. For example:
P1 (on Similarity-based): "I also appreciate how the computer is excited about its decision... It’s funny to me ... Told you, in conversational form, why it was similar."
P10 (on Similarity-based): "This is funny... (laughs) ... This seems more personable. Seems like a narration rather than just straight rules. It’s almost like a conversation."
Table 3: Participants’ rankings from the written questionnaires. (Rank 1 is "preferred the most.") Explanation Rank 1 Rank 2 Rank 3
Rule-based 7 4 2
Keyword-based 3 4 6
Similarity-based 3 5 5
3.4.3 Accuracy
As we have mentioned, the algorithms performed at different accuracy rates, with Ripper outperforming Naïve Bayes. (We define "accurate" as being in agreement with the original Enron user who owned the email.) This suggests that Ripper may be a better choice than Naïve Bayes for accuracy in this type of situation. As to our experiment, accuracy rate was not statistically predictive via linear regression of any of the ratings provided by participants, did not result in differences in participants’ willingness to provide feedback, and did not affect their accuracy in doing so.
When the participants disagreed with the machine (28% of the time), participants were usually right (22%), but not always (6%). Also, both the machine and the participants disagreed with the original user 22% of the time, suggesting some knowledge possessed only by the original user and perhaps even some misfiling by the original user. Ultimately, the participant corrections brought the accuracy rates for all paradigms to almost identical levels: 71-72%, a surprising result suggesting that the performance of the algorithms did not matter to accuracy in the end.
As the preceding paragraph also points out, the participants were not perfect oracles. The error rate is consistent with earlier findings regarding end-user programmers’ accuracy in serving as oracles when debugging, which have reported error rates of 5-20% (e.g., Phalgune et al. 2005). This range of error rates has been robust across studies, and suggests a similar level of "noise" that users’ judgments would introduce into the learning algorithm’s data. How to deal with this level of noise is an open research topic for machine learning.
3.4.4 The Users Explain to the System
What did participants think machine learning algorithms should change? For all three paradigms, we coded participants’ feedback (Negative Comment and Suggest Change) along two dimensions. The rows of Table 4 identify the type of change and the columns identify the knowledge needed to handle the change.
KB-English KB-commonsense KB-domain KB-other Total %
1. Select different features (words) 70 64 25 16 175 53%
2. Adjust weight 11 11 4 13 39 12%
3. Parse or extract in a different way 7 17 10 0 34 10%
4. Employ feature combinations 9 5 2 1 17 5%
5. Relational features 0 9 5 0 14 4%
6. Other 3 12 4 33 52 16%
Total 100 118 50 63 331
% 30% 36% 15% 19%
3.4.4.1 Participants’ Suggestions by Type
The rows of Table 4 categorize the participants’ suggestions into six types. The types of feedback were not independent of the explanation paradigms: some paradigms seemed to encourage participants to think along the lines of particular types of feedback. We will point out these influences along the way whenever a paradigm represents at least 50% of a category. The first type, selecting different features, was the most widespread type of feedback, for all three explanation paradigms. Words that appear in an email are considered to be individual features by the machine learning algorithms. Each feature has a weight that influences its contribution to determining a particular classification. More than half of all feedback referred to either adding a new feature for the algorithm to consider or removing a feature from consideration, such as:
P13 (on Rule-based): "It should put email in ‘Enron News’ if it has the keywords ‘changes’ and ‘policy’. I put down some keywords that I noticed."
The second type was comprised of suggestions in which participants agreed that a particular feature was worthy of note, but wanted to change its weight or importance. Participants’ reactions to Keyword-based explanations generated 69% of the feedback of this type, perhaps because of the feature-focused nature of the Keyword-based paradigm. Some participants’ suggestions for changing feature weight or importance involved adjusting the weight on features in a general sense, such as P8’s below. Other participants, such as P7 and P1, flipped a weight from negative to positive (or vice versa), or focused on the frequency of the word occurrence in the email, akin to term weighting in information retrieval. Finally, participants such as P4 made other adjustments to ordering of relative importance.
P8 (on Keyword-based): "The second set of words should be given more importance."
P7 (on Keyword-based): "Keyword ‘include’ is not good for the second set. It should be in the first set of words." P1 (on Rule-based): "‘Bankruptcy’ is here over and over again, and that seems to be the obvious word to have in here." P4 (on Keyword-based): "I think that ‘payroll’ should come before ‘year’."
The third type of feedback concerned parsing the text or extracting features from the text in a different way. Some participants suggested a different form of text parsing, such as P1 below. In the simplest case, this could be achieved by an improved stemming procedure (Porter 1980). In some cases, however, the suggested extraction operates on a structure such as a URL, such as P6. In this case, either the system would already need to know about URLs or else the user would need to define them (perhaps by giving examples). Participants such as P13 also suggested using the structure of the email to extract features, such as the "From" and "Subject" field. Finally, some participants such as P6 suggested new kinds of informative cues.
P1 (on Similarity-based): "Different forms of the same word must be looked at." P6 (on Similarity-based): "I think it would be good to recognize a URL."
P13 (on Rule-based): "Yea, I mean it has ‘job’ in the subject line (for sorting into Resumé folder)"
P6 (on Keyword-based): "I think that it should look for typos in the punctuation for indicators toward Personal."
Feature combinations were the fourth type of user feedback. Participants pointed out that two or more features taken together could improve the prediction, especially when they were working with Similarity-based explanations, which generated 63% of the suggestions of this type:
P12 (on Keyword-based): "I would think like ‘authorize signature’ or ‘w-2 form’."
The fifth type of participant feedback suggested incorporating the use of relational features. In these cases, the participants used relationships between messages (threading) or organizational roles (chairman of Enron) to define a new feature. For example:
P6 (on Rule-based): "I think maybe it should use the response and automatically put it in the folder with the message that was responded to."
P8 (on Keyword-based): "This message should be in ‘EnronNews’ since it is from the chairman of the company."
The remaining feedback by users did not fall into the types above and we coded these as "Other". Most of this kind of feedback concerned changes to the learning algorithm itself. These included suggestions such as adding logical NOT to the rule language, eliminating the default rule in Ripper, requiring an equal number of positive and negative keywords in Keyword-based explanations.
There were also cases in which the real problem lay with the way the explanation was constructed, rather than with the learning algorithm:
P13 (on Similarity-based): "Having ‘points’ being the only keyword, I mean that kind of sucks."
Although the algorithm actually used all of the keywords in the messages, the explanation only highlighted the shared words with the top weights. This suggests that an automated method for assimilating user feedback would need a component that could diagnose whether the perceived problem is due to approximations in the explanation or design decisions in the learning algorithm.
3.4.4.2 Participants’ Suggestions by Knowledge Source
Table 4’s columns categorize the participants’ suggestions into four knowledge sources: knowledge of English, commonsense knowledge, domain-dependent knowledge, and other.
Almost a third (30%) of the participations’ suggestions relied on knowledge of English (KB-English). We coded feedback in this category if the necessary knowledge could be learned from analysis of large document collections or obtained from other online resources (e.g., Wordnet (Miller 1995) or named-entity recognizers (Zhou and Su 2002)). For example:
P8 (on Rule-based): "Does the computer know the difference between ‘resumé’ and ‘resume’? You might have email where you’re talking about ‘resume’ but not in a job-hiring sense."
P5 (on Keyword-based): "Last names would be better indicators."
P1 (on Similarity-based): "‘day’, ‘soon’ and ‘listed’ are incredibly arbitrary keywords."
Some knowledge might need to be manually encoded, but it could then be reused across many different organizations and applications (KB-Commonsense). For example, participants indicated that there are "families" of words that are work- or business-related, and also suggested topic-related words:
P4 (on Rule-based): "‘Policy’ would probably be a good word that would be used a lot during business talk."
P1 (on Keyword-based): "‘Qualifications’ would seem like a really good Resume word, I wonder why that’s not down here."
Some knowledge is domain-dependent (KB-Domain). Some participant suggestions relied on knowledge specific to Enron. For example, in the following example, the machine learning system would need to know that Ken Lay was the CEO of Enron and that as such he carries special importance to Enron employees, would need to know the implications of being an Enron employee, and so on. Such knowledge would need to be encoded separately for each organization.
P11 (on Similarity-based): "Different words could have been found in common like ‘Agreement’, ‘Ken Lay’."
All remaining feedback was coded KB-Other. This usually occurred when a participant’s comment was not specific enough to suggest the underlying knowledge source.
3.5 Issues Raised By Experiment #1 for Investigation by Experiments #2 and #3
require investigation. For example, one issue is that our participants were not perfect, and sometimes their feedback was erroneous; introducing such errors into the system’s reasoning might make the algorithm perform worse rather than better. To shed light upon these issues, which are expressed by RQ 3, we conducted two off-line follow-up experiments, Experiment #2 and Experiment #3.
Specifically, consider how the user feedback reported in Experiment #1 might be incorporated directly into the algorithms, i.e., how machine learning algorithms might be changed permanently to do as the users suggested in those comments without complex in situ reasoning advice from users. Consider Ripper and Naïve Bayes, the widely used algorithms that we used in Experiment #1. For these two algorithms, Type codes 1, 2, and 4 (features, weights, and feature combinations) as supported by KB-English are conducive of direct assimilation. These types of user feedback accounted for 27% of the 331 suggestions. Similarly, supporting these three type codes by KB-Commonsense rather than solely by KB-English is also possible but is more challenging, due to the difficulty of obtaining the relevant common sense topic models. Type codes 1, 2, and 4 that relied on KB-Commonsense accounted for an additional 24% of the suggestions. In contrast, the remaining type codes appear to require substantial additional machine learning research in feature extraction, relational learning, and user interfaces for providing application-specific feature specifications. Thus, a little over half of the participants’ suggestions appear potentially viable for incorporation into these two particular algorithms.
Now consider the second issue, whether incorporating this feedback would improve accuracy. To make consideration of this issue tractable, we narrowed our focus to two of the feedback types, namely weight and keywords changes, without regard to knowledge source. Thus, we assumed that either the knowledge sources would be available, or else that the users themselves would serve as the knowledge source and would enter the changes interactively during reasoning.
We implemented the changes necessary for these two feedback types in the algorithms of Experiments #2 and #3, thereby covering 65% of the user feedback given. We used Naïve Bayes instead of Ripper as the underlying machine learning algorithm for Experiments #2 and #3. This choice was due to two main reasons. First, in Section 3.4.1.3, we highlighted the need to support multiple explanation paradigms. Naïve Bayes is capable of supporting all three of our explanation paradigms. Ripper, on the other hand, is most suited for a rule-based paradigm. Second, 64% of the user feedback in Table 4 (from type codes 1 and 2) correspond to feedback about keywords. Incorporating keyword-based feedback is much more natural for Naïve Bayes than for Ripper as automatically modifying the scoring functions for feature selection and pruning in Ripper is substantially more complex than for Naïve Bayes. We followed two approaches for incorporating the rich feedback into machine learning algorithms, namely, a constraint-based approach (Experiment #2) and a co-training approach (Experiment #3).
Our new algorithms allowed empirical exploration of the last part of our research question RQ 3, namely whether incorporating rich user feedback would actually improve accuracy. We evaluated both approaches retroactively using as inputs the keyword-based and similarity-based feedback our Experiment #1 participants had provided using a low-fidelity prototyping approach. In Sections 4 and 5, we report our results of the constraint-based and user co-training approaches, respectively, with accuracy comparisons against two baseline algorithms. Participant-by-participant details of the evaluations are given in Appendix C.
4. EXPERIMENT #2: USING USER FEEDBACK AS CONSTRAINTS
One possible approach is to incorporate rich user feedback of type codes 1 and 2 into existing algorithms as user constraints (e.g., "there should be a positive weight on feature X"). From the constraints, the corresponding weights can be automatically modified in the Naïve Bayes classifier.
4.1 The Constraint-Based Algorithm
We implemented the following three types of constraints:
Constraint type 1 (hard): If the participant reduced the weight or removed the word proposed in the explanation, the proposed word was considered vague or unimportant. The word was removed from the feature set. Constraint type 2 (soft): If the participant increased the weight of a word, regardless of whether it was proposed in the
explanation or not, the proposed word was assumed to be a strong indicator as to the email’s folder. We incorporated this form of feedback by adding a constraint that forces the weight on the word to be positive, which made the word more important for the user-assigned folder than for other folders. In our implementation, we also increased the effect of this constraint by requiring the weight of the word to hold above some amount
δ
≥
0
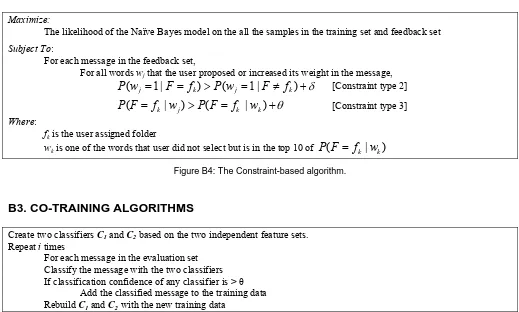
. Figure B2 in Appendix B illustrates the mathematical details of this second constraint type.Constraint type 3 (soft): For the third constraint type, we assumed that words that had their weights increased by the user were more significant indicators of the user-assigned folder than other words appearing in email messages in that folder. In order to describe this constraint at a high level, we need to quantify the
predictiveness of a word for the user-assigned folder. This predictiveness is defined as the probability of the email being assigned to the user-specified folder given that the word is present in the email message. We require that there should be a gap between the predictiveness of a user-selected word and the predictiveness of the most informative words for that folder that were not selected by the user. Thus, for each user-selected word, we added a set of 10 constraints to force the user-selected words to exceed by some amount
θ
≥0 the predictiveness of the top 10 most informative words not selected by the user. The formal notation for constraints of type 3 are shown in Figure B3 in Appendix B.The δ and θ parameters above control the hardness of the constraint and can take on any value between 0 and 1. The lower the value of these parameters, the softer the constraint. We varied these values in order to investigate the influence of the constraint parameter values on the accuracy of the classification. However, in this experiment, we observed very little difference in classification accuracy for different δ and θ values. As a result, we report results using parameter values of (δ =0,θ=0), (δ=0.4,θ=0), (δ =0,θ=0.4), (δ =0.4,θ=0.4), and (δ=0.8,θ=0.8) which are representative of the parameter values we tried. We chose not to investigate values over 0.8 as there was a danger of making the constraints too aggressive. (With θ values over 0.8, the risk was too high of over-generalizing spurious constraints over all the data, resulting in a problem in machine learning known as overfitting.)
Constraints of type 1 were incorporated into Naïve Bayes by simply excluding the feature from the classifier. The remaining two constraints types were incorporated into the parameters of the Naïve Bayes classifier. The standard method for setting the parameters for Naïve Bayes is to calculate the parameters from the training data using a process known as maximum likelihood estimation. We were able to incorporate the constraints by converting the maximum likelihood estimation procedure into a constrained optimization problem as shown in Figure B4 in Appendix B. In our experiment, this optimization was performed by the non-linear programming solver in Lindo (Lindo 2007).
4.2 Design, Procedure, and Data Sets
To evaluate the constraint-based approach, we compared it against a baseline approach representing the traditional way user feedback is incorporated into machine learning: a simple Naïve Bayes algorithm that takes into account only the corrected folder assignments provided by users in a training set ("this should be in Personal"), but not the suggestions’ rich content ("because it’s from Mom"). We refer to this simple Naïve Bayes algorithm as the "simple online training algorithm". For the email data, we divided the emails from the Enron farmer-d dataset into three sets: the training set, the feedback set
to the Enron News and Personal folders. Second, this two-folder restriction was necessary to allow a head-to-head comparison between the constraint-based approaches in this section with the training approaches in Section 5. The co-training approaches in Section 5 require a large amount of unlabeled data; hence we needed the evaluation set to have a large amount of unsorted emails from all folders. We addressed this problem in Section 5 through the two-folder restriction. With the two-folder restriction in place, the training set contained 50 messages, the feedback set contained 11 messages2, and the
evaluation set contained 371 messages (88 emails in Enron News, 283 in Personal).
For the feedback data itself, we harvested the rich feedback participants gave in Experiment #1, and applied it to our new algorithms. We used their keyword-based feedback and their similarity-based feedback as inputs into our algorithms. (We did not use their rule-based feedback, since we did not build a rule-based algorithm, as we have already explained.) Participants were constrained by time, and since some participants were faster than others, some were able to provide feedback on more emails than others did. (See Appendix C1 for the exact number of emails for which each participant gave feedback.)
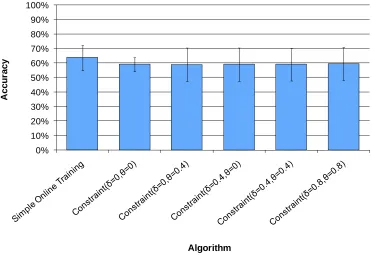
[image:17.612.125.500.348.603.2]4.3 Results of Experiment #2
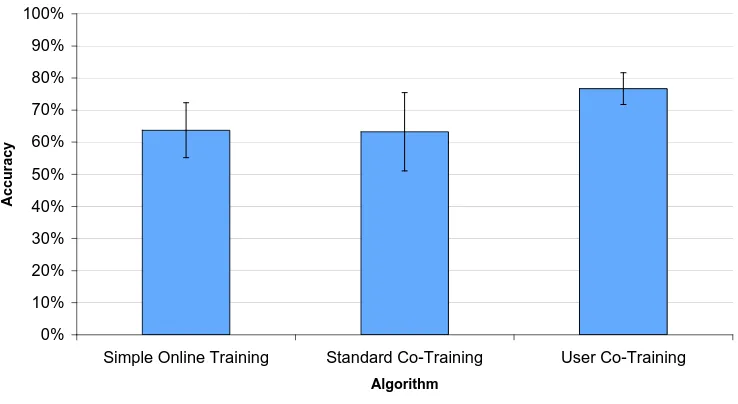
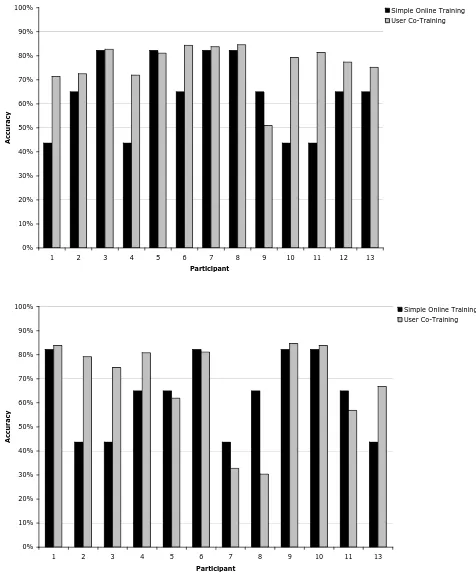
Figure 6 summarizes how the various algorithms fared using the participants’ keyword-based feedback. Figure 7 shows a similar graph of how the algorithms performed using the participants’ similarity-based feedback. (Full details of the evaluation are given in Appendix C). As the graphs show, there was little difference in accuracy between the various constraint parameters applied. On average, the constraint-based approach performed worse than the simple online training approach on both the keyword-based and similarity-based participant feedback.
0% 10% 20% 30% 40% 50% 60% 70% 80% 90% 100%
A
c
cur
a
cy
Algorithm
Figure 6: Percentage of emails the constraint-based algorithm (using different "softness" settings) sorted correctly after incorporating participants’ rich feedback that they had given in Experiment #1 with keyword-based explanations. For comparison purposes, the simple online training algorithm (leftmost) uses participants’ label feedback only, not their rich
feedback. (Bars indicate standard error).
2 Note that Appendix C1 lists the number of email messages out of the four Enron folders of Bankrupt, Resume, Enron News
0% 10% 20% 30% 40% 50% 60% 70% 80% 90% 100%
A
c
cur
a
cy
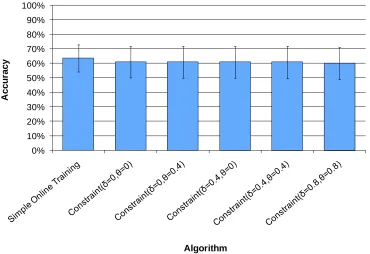
[image:18.612.129.499.93.347.2]Algorithm
Figure 7: Percentage of emails the constraint-based algorithm ((using different "softness" settings) sorted correctly, after incorporating Experiment #1 participants’ rich feedback that they had given in Experiment #1 with similarity-based explanations. For comparison purposes, the simple online training algorithm (leftmost) uses participants’ label feedback
only, not their rich feedback. (Bars indicate standard error).
4.4 Discussion of Experiment #2
The user’s willingness to invest time providing information to an intelligent system can be viewed in terms of a cost-benefit-risk judgment by users, drawing on Attention Investment theory (Blackwell 2002). According to this theory, in weighing up whether to provide feedback, users’ perceptions of costs, benefits, and risks each play key roles. One of the charges of a good user interface is to provide the user with the information needed to make assessments of costs, benefits, and risks that are reasonably close to actual costs, benefits, and risks. For example, some costs can be controlled through careful design of the intelligent interfaces to explain the system's reasoning and to accept feedback. Risk can arise due to the intelligent system’s inability to make profitable use of the user’s suggestions, because the feedback in some circumstances actually makes accuracy worse. Benefits can be gained by the system's ability to make effective use of the user’s suggestions to improve its accuracy.
Results of Experiment #2 provide some evidence as to the amount of potential actual costs, risks and benefits to users in providing feedback to machine learning systems. Experiment #2’s results were that the constraint-based approach had a lower accuracy on average than the simple online training approach by 5% in the keyword-based paradigm and approximately 3% in the similarity-based paradigm. As Appendix C4 details, the accuracy for the constraint-based variants was lower than that of the simple online training algorithm for all participants—except for participants 1, 6, and 11 for keyword-based user feedback and participants 5, 8, 11 and 13 for similarity-based feedback.