Damage stability requirements for passenger ships –
Collision risk based cost benefit assessment
Rainer Hamann, DNV GLRainer.Hamann@dnvgl.com
Odd Olufsen, DNV GLOdd.Olufsen@dnvgl.com
Henning Luhmann, Meyer Werft Henning.Luhmann@meyerwerft.de
Apostolos Papanikolaou, National Technical University Athens papa@deslab.ntua.gr
Eleftheria Eliopoulou, National Technical University Athens eli@deslab.ntua.gr
Dracos Vassalos, University of Strathclyde d.vassalos@strath.ac.uk
ABSTRACT
Currently built passenger ships have to comply with SOLAS 2009 probabilistic damage stability requirements. There are, however, serious concerns regarding the sufficiency of these requirements with respect to the Required Subdivision Index R, which should properly account for the risk of People On Board (POB) and ship’s inherent survivability in case of loss of her watertight integrity. In recent years extensive research on determining the appropriate level of R using risk-based methods has been carried out. The urgency of the matter was reinforced by the quite recent Costa Concordia
(2012) accident, even though this accident was not related to a collision event. This paper outlines the objectives, the methodology of work and first results of the ongoing studies funded by EMSA (EMSA III project) focusing on risk-based damage stability requirements for passenger ships. In compliance with IMO Formal Safety Assessment process a collision risk model is further developed based on the results of EU GOALDS project and a new required index shall be suggested by means of cost-benefit assessment. The updated collision risk model uses information from the most recent analysis of casualty reports of databases considering the period 1990 to 2012.
Keywords: Collision, Risk Model, Damage Stability, Passenger Ship Safety, Formal Safety Assessment, Cost Benefit Analysis
1. INTRODUCTION
In January 2009 the SOLAS 90
deterministic damage stability requirements for passenger ships were replaced by the new
harmonised SOLAS 2009 probabilistic
requirements, which were to a great extent based on research work of the HARDER project. However, that time when IMO Sub-Committee SLF was in the process of developing SOLAS 2009, it was mandated by IMO Marine Safety Committee not to raise the safety level. At that time this was considered satisfactory, except for the Ro-Ro cargo and car carriers ships in general, for which the required survivability level was significantly raised. Therefore, for the majority of ship
types, including the passenger ships, the required damage stability index (R-Index) was adjusted to represent on average the safety level of a representative sample of ships of the particular ship type with satisfactory survivability regarding the likely collision damages. A review of related developments can be found in Papanikolaou and Eliopoulou (2008).
Since then, extensive research on
(Papanikolaou et al., 2013). One of the key contributions of GOALDS (2009 – 2012) was the risk-based derivation of a new damage stability requirement for passenger ships, which was supported by conducting a series of concept design studies for sample RoPax and
cruise ships, including their formal
optimisation with respect to technical, economic and safety (risk) criteria. Key results of this project were submitted to IMO for consideration in the rule-making process (SLF 55/INF.7, SLF 55/INF.8, SLF 55/INF.9) and were positively reviewed by IMO FSA expert group (MSC 93/6/3, 2013).
Despite of all the above research efforts there were still some unanswered questions and the objectives of the EMSA III study are to cover the specific knowledge gaps that were identified after the finalisation of the previous EMSA projects and GOALDS. These knowledge gaps are the effect of (open left) watertight doors, the consideration of grounding and raking damages the in damage stability evaluation as well as the consolidation of the collision risk model. This paper is focusing on the consolidated collision risk model.
The EMSA III study uses a risk-based cost-benefit assessment for derivation of new damage stability requirements. In context of IMO rule making procedures this process is specified in the Guidelines for Formal Safety Assessment (FSA, MSC-MEPC.2/Circ.12 2013). In risk-based cost-benefit assessment the impact of risk reducing measures in relation to their costs and monetary benefits (Cost of Averting a Fatality, CAF) is quantitatively compared to well specified thresholds (value of preventing a fatality). These thresholds are accepted by regulator and in accordance with the FSA Guidelines, and were based on a Life Quality approach. Therefore, this assessment requires the development of a risk model and a cost model for the aspect under consideration.
The focus of the work outlined in this paper is on damage stability requirements as covered
by current regulations of SOLAS 2009. Accordingly, the collision risk model is particularly developed for this purpose and consequences focus on damage stability related casualties (fatalities due to sinking).
2. FLEET AT RISK
The risk model developed in section 4 was quantified using initial accident frequencies that were calculated determining accidents and fleet at risk for a sample complying with the characteristics specified already in GOALDS project:
• Ship types: cruise, passenger ships, Ro-Pax and RoRo-PaxRail;
• GT ≥ 1,000 – most ships below GT 1,000 operate on non-international voyages;
• ≥ 80 m length (LOA) - most ships below 80 m in length operate on non-international voyages;
• Built ≥ 1982;
• Accidents in the period 1994-01-01 and 2012-12-31;
• IACS class at time of accident – to reduce the potential effect of under reporting;
• IACS class for determination of ship
years;
• Froude No. ≤ 0.5 – to eliminate High Speed Craft (HSC) from the study.
For the further analysis two basic ship categories were considered and the different samples merged accordingly:
• Cruise, comprising cruise and passenger ships with accommodation for more than 12 passengers in cabins;
• RoPax, comprising Ro-Pax and Ro-Pax-Rail vessel with accommodation for more than 12 passengers.
Figure 1 Fleet size per year for ship categories Cruise and RoPax
3. COLLISION CASUALTIES
Initial raw casualty data were retrieved from the IHS Fairplay database. The particular records were inserted in the newly developed database allowing for more detailed statistical investigation. Before inserted records were reviewed and enhanced by additional information to the extent available; the data in hand were re-analysed and post-processed in the way to produce input to the pre-developed collision risk model.
All captured accidents occurred during the ship's operational phase and were assigned to one of the predefined main incident categories according to the last “accidental event”. Regarding the definition of each accident event, the relevant IMO descriptions were adopted (MSC/Circ.953, 2000).
In the post 2000 period, a total of 67 serious collision events occurred involving IACS classed Cruise and RoPax ships, see Table 1.
Focusing on Cruise ships, 17 accidents were assigned as collision events (Table 1); the vast majority of them; 88% (15 accidents out of 17) occurred in terminal areas. Heavy weather conditions were reported in 7 cases, good weather in 2 cases whereas there was no weather report concerning the remaining accidents.
In 43% of the collision accidents, the Cruise vessel was the struck one. In cases where the Cruise ship was the struck one, striking ships are: another Cruise ship (2 cases), a barge (1 case), a Chemical/Oil Tanker (1 case), a Bulk Carrier (1 case) and a
Containership (1 case). Finally, no ship total loss and no fatalities were reported within the study period.
Regarding RoPax ships, in total 50 serious collision events occurred involving IACS classed RoPax ships, ref. Table 1. About 57% of the particular collision events occurred in Terminal areas, 39% in limited waters and 2% in Open Sea during en-route operation. Heavy weather conditions were reported in 9 cases, good weather in 3 cases, under poor visibility in 5 cases, under freezing conditions in 2 cases whereas there was no weather report concerning the remaining accidents.
[image:3.595.66.283.102.223.2]In 58% of the collision accidents, the RoPax ship was the struck vessel. In cases where the RoPax ship was the struck one, striking ships are: another RoPax ship (9 cases), a Ro-Ro Cargo ship (3 cases), a General Cargo (3 cases), a Bulk Carrier (2 cases), a Chemical/Oil Tanker (1 case), a Containership (1 case), a tug (1 case) and a Fishing vessel (1 case). Finally, no ship total loss and no fatalities were reported within the study period.
Table 1: Number of casualties for ship categories Cruise and RoPax as well as related initial accident frequencies for periods 1994 to 2012 and 2000 to 2012
Time Period
1994 - 2012 2000 - 2012
No of
casualties1
1/ship
year2
No of
casualties1
1/ship
year 3
Cruise
19 5.78E-03 17 6.36E-03
RoPax
52 7.72E-03 50 9.38E-03
Table 2 presents the calculated frequencies used for input to the collision risk model. The previous analysis carried out in GOALDS project started with year 1994 and therefore the focus for collecting and investigating casualty reports was put on the period 1994 to 2012. For the current analysis the time period covers year 2000 to 2012 due to higher annual accident
1 serious cases, IACS ships at the time of incident 2 Calculated considering IACS classed ships and the selection criteria specified: 3290 ship years 3 Calculated considering IACS classed ships and the selection criteria specified: 2673 ship years
[image:3.595.302.545.479.597.2]frequencies compared to 1994 to 2000. Anyway, the same constrains with GOALDS project are adopted as described in the previous section.
4. COLLISION RISK MODEL
The collision risk model in EMSA III project was developed on basis of the risk model developed for GOALDS incorporating newly available information. Starting point for the risk model was the high-level collision event sequence considering main influences on the development of consequences (Figure 2), i.e. considering whether the ship was struck or striking (initiator), the location of the accident (operational area), the possibility of water ingress and in case of water ingress the possibility of sinking including the velocity.
Collision Initiator
Water Ingress
Consequences Operational
Area
Level 1 Level 2 Level 3 Level 4 Level 5
[image:4.595.58.287.377.501.2]Sinking
Figure 2 High-level event sequence for collision casualties of passenger ship
The developed collision risk model is shown in Figure 5 for the example of ship type Cruise. The main differences to the GOALDS collision risk models are:
• Merging scenarios “en route” and
“limited waters” because in both branches the same dependent probabilities were used;
• Reduced fatality rate for sinking in terminal area of 5% considering the effects of limited water depth and good SAR;
• Estimate dependent probabilities for the events “initiator”, “operational area” and “water ingress” on basis of a sample received by merging the reports for Cruise and RoPax.
Initial accident frequencies are summarised in Table 2 above. Dependent probabilities for initiator (struck/striking), operational area (terminal/limited waters-en route) and water ingress were estimated on basis of the casualty reports collected for the period 1994 to 2013. As this risk model is dedicated to damage stability the probability of sinking was estimated on basis of SOLAS 2009 damage stability requirements. Hence, the probability of sinking is equal to 1-A.
[image:4.595.312.527.408.575.2]For consider the uncertainty in the initial accident frequencies, the dependent probabilities as well as the consequences with respect to Person On Board distributions were estimated for the nodes in the risk model and risk was calculated in terms of PLL by means of Monte Carlo simulation. Distributions were estimated on basis of the confidence intervals that were calculated using the approach suggested by Engelhardt (1994). Figure 3 shows exemplarily the used log-normal distribution for a Cruise ship being struck
Figure 3 Log-normal distribution for Cruise ship being struck with 90% confidence interval.
The collision risk for Cruise ships and RoPax were calculated considering typical occupancy rates. For Cruise ships the occupancy rate was 90%, i.e. 90% of certified passenger and crew capacity. For RoPax three different occupancy rates for passengers were defined approximating seasonal variation of people on board over the year:
• 100% for 12.5% of the year (high
season);
• 75% for 25% of the year (medium
• 50% for 62.5% of the year (low season). Number of crew was kept constant using nominal value.
[image:5.595.309.547.567.738.2]Table 2 summarises the collision risk in terms of PLL for six reference ships. These collision risk values were calculated for the damage stability index attained for the original design.
Table 2 Collision risk in terms of Potential Loss of Lives (mean values) calculated for ship types considered in cost benefit analysis
Ship type and size
PLL (fatalities per ship year)
Number of Persons
(POB)
large cruise 6.32E-02 6730
small cruise 9.67E-03 478
ropax baltic 1.04E-01 3280
ropax Med 6.80E-02 1700
ropax ferry 2.95E-02 625
double end 2.71E-02 610
As shown, risk in terms of PLL increased with number of persons on board which is quite obvious because the risk model considers the ship size only via the attained index and corresponding POB when estimating the probability of sinking.
5. COST-BENEFIT ANALYSIS
The main objective of the cost-benefit assessment (CBA) is the evaluation of risk control options with respect to their economic impact, i.e. compare related costs with monetary threshold CAF (Cost of Averting a Fatality). The basic assumption for design work was to keep the business model and the transport task constant during the design variations. In particular the defined capacities like number of cabins, lane metres and deadweight, operational profiles with regard to speed and turnaround times, as well as specific demands for the ship, e.g. restrictions of main dimensions, have been preserved.
For the different design variants a cost-benefit calculation has been done, based on the same method as applied in GOALDS. For all cost elements only the change compared to the reference design has been calculated.
All values are calculated on 2014 levels and the life-cycle costs are assessed using a discount factor of 5% over the 30 year lifetime of the ship.
The change of three main cost elements has been evaluated in the cost benefit analysis (CBA):
• Change of production costs, for structure, outfitting and equipment, including also design costs and other costs such as insurance, financing etc.;
• Change of operational costs, mainly the change of fuel costs due to modified main dimensions or hull form;
• Change of revenue – theoretical revenues arising from the design modification were not investigated since the transportation task / business model of the owner was kept constant; therefore only the change of scrap value due to the reduced probability of total loss (sinking of ship) due to an increase of A was calculated.
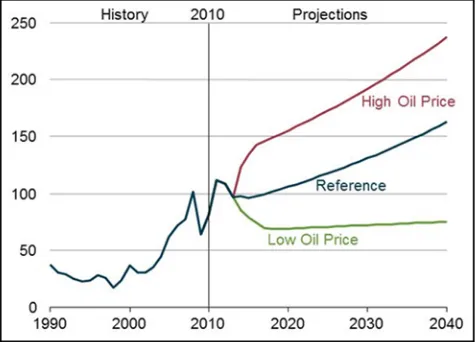
Figure 4 Average annual oil prices for the three scenarios ‘low’, ‘reference’ and ‘high’, 1990-20354 (2010 US$ per bbl)
In respect to the coming environmental regulations and the use of low sulphur fuels, a fuel mix has been defined for the life time of each of the sample ships. For each design variant a calculation of the annual fuel consumption has been made based on the given operational profile which considers different percentages of port time, as well as the distribution of different operational speeds.
As the business model is kept constant, e.g. the same number of cabins or amount of deadweight and cargo capacity, the only change in the revenue is calculated based on small variations of the business model and on the reduced probability of total loss due to the changed attained index A.
This small contribution to the revenue is based on the GOALDS investigations, in which published newbuilding and scrapping prices from IHS Fairplay database have been analysed to achieve a coarse relation between ship size and the price for design and construction.
Secondary effects costs which may be faced by the operator or the society following a large accident has not been accounted for due to limited available data.
6. NEW PASSENGER SHIP DESIGNS
New designs of six passenger ships have been developed to form the basis for the optimization and benchmark for the subdivision index, as well as for grounding and the effect of open water tight doors.
All designs comply with the current statutory rules and regulations, e.g. SOLAS 2009 including ‘Safe Return to Port’ where applicable. Some of the RoPAx designs also comply with the EU directive for RoRo passenger ships, known as Stockholm Agreement.
The designs have been selected in close cooperation between the designers and ship
4 Remarkably with respect to the volatility of prices: early 2015 oil prices are well below the 2010 predicted Low Price Level
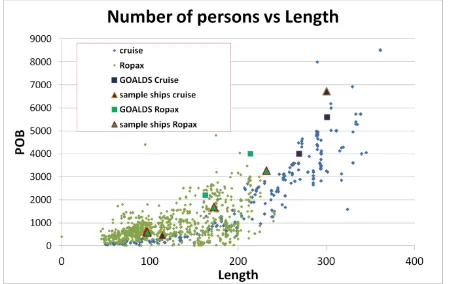
[image:6.595.309.534.189.331.2]operators in such a way that the world fleet will be well represented and as a complement to the designs investigated in GOALDS. Figure 5 shows a plot of the actual world fleet of XY ships in terms of length and person on board, and the sample ships. The main characteristics of the sample ships are summarised in Table 2.
Figure 5 Selection of sample ships with regard to length and POB (RoPax and Cruise)
For all ships a number of risk control options have been executed mainly due to the moderate variation of breadth and freeboard as well as changes to the internal watertight subdivision. The focus was laid on practical feasible design variations which results in a workable ship but with highest increase of the attained subdivision index according to SOLAS 2009. For the RoPax designs the new defined s-factor has been used, while the Stockholm Agreement has not been considered. Also the effect of any large lower hold has been investigated for two of the RoPax sample ships, as cargo capacity is the main design target and source of revenue for some ferry routes.
To allow an effective design the new defined CAF limits of 4 to 8 mill USD have been converted for each of the sample ships into graphs showing the maximum allowable costs to stay with the limits of cost effectiveness (Figure 6 shows the results for ‘large Cruise’). The 5% and 95% confidence intervals are also shown.
Table 3 Overview of sample ships
Typ e
Lengt h bp
GT Numbe
r of persons
Large cruise
294.6 153400 6730
Small cruise
113.7 11800 478
Baltic RoPax
232.0 60000 3280
Med RoPax
172.4 43000 1700
Small cruise
113.7 11800 478
Small RoPax
95.5 7900 625
Double ender
[image:7.595.53.288.112.538.2]96.8 6245 610
Figure 6 Diagram of cost effectiveness for large cruise ship
As explained in section 5 the costs and possible benefits for each Risk Control Option will be determined. Costs spread over the lifetime of the vessel will be transferred to a Net Present Value, i.e. future costs are transferred to a reference year (2014) using interest rate.
As seen in the risk model in Figure 7 the level of Attained Index (A) is directly used parameter in the risk model indicating whether the ship will sink or not. For an improvement in A there is a corresponding reduction in Potential Loss of Lives. This is what can be directly plotted in the Figure 6 to visualise whether the investigated RCO is within CAF limits of 4 or 8 mill USD. Additionally,
corresponding confidence intervals are plotted allowing consideration of uncertainty in the risk model.
The results of the investigation of the sample ships will be used in the further work of this project to suggest a new level of R
7. SUMMARY AND CONCLUSIONS
The FSA on cruise ships demonstrated impressively that collision and grounding accidents are major risk contributors in particular due to water ingress leading to loss of stability.
The determination of an appropriate level of required damage stability (R-Index) for passenger ships has been a matter of extensive research. For instance the project GOALDS dealt with the quantification of damage stability related risk and identification of design options for mitigating the risk of collision and grounding accidents. However, despite of all research efforts some issues related to damage stability remain. One of the current key topics in this context is related to the update of damage stability requirements.
In IMO FSA Guidelines the ALARP process is recommended for determining new requirements respectively updating them. This process focuses on making the risk “as low as reasonable practical”, which comprises the development of a risk model for quantifying risk reduction and performing cost-benefit assessment. By cost-benefit assessment the economic impact of risk mitigating measures is evaluated by means of monetary thresholds.
with respect to size, capacity and type. For each sample ship a number of risk control options have been executed mainly due to the moderate variation of breadth and freeboard as well as changes to the internal watertight subdivision. The work focused on obtaining practical feasible design variations with highest possible level of attained index A according to SOLAS 2009.
For each design modification a cost-benefit assessment has been carried out giving the related Cost of Averting a Fatality (CAF). For modified designs where a CAF value less than the threshold of 4 and 8 mill USD is found the corresponding attained index A is taken into consideration for suggesting the level of R. The work carried out so far provided design variations with increased damage stability and in compliance with set CAF threshold, i.e. cost-beneficial designs.
8. ACKNOWLEDGEMENTS
The authors would like to express gratitude to EMSA for providing funding to the study.
The information and views set out in this paper are those of the authors and do not necessarily reflect the official opinion of EMSA.
9. REFERENCES
Engelhardt, M.E., 1994: Events in Time: Basic Analysis of Poisson Data. Idaho National Engineering Laboratory, Idaho 83415.
MSC-MEPC.2/Circ.12, 2013: Revised Guidelines for Formal Safety Assessment (FSA) for Use in the IMO Rule-Making Process. IMO London, 2007.
MSC 93/6/3, 2013: Report of the intersessional meeting of the Experts Group on Formal Safety Assessment (FSA). Submitted by IMO Secretariat, IMO London.
MSC/Circ.953, 2000: Reports on marine casualties and incidents. Revised
harmonized reporting procedures - Reports required under SOLAS regulation I/21 and MARPOL 73/78 articles 8 and 12, December 2000, IMO London.
Papanikolaou, A., Hamann, R., Lee, B-S, Mains, C., Olufsen, O, Tvedt, E., Vassalos, D., Zaraphonitis, G., 2013: GOALDS - Goal Based Damage Stability of Passenger Ships, Transactions of the 2013 Annual Conference of the Society of Naval Architect and Marine Engineers (SNAME), Seattle.
Papanikolaou, A., Eliopoulou, E., 2008: On the Development of the New Harmonised Damage Stability Regulations for Dry Cargo and Passenger Ships, Journal of Reliability Engineering and System Safety (RESS), Elsevier Science, Vol. 93, 1305-1316.
SLF 55/INF.7, 2012: The GOAL based Damage Stability project (GOALDS) – Derivation of updated probability distributions of collision and grounding damage characteristics for passenger ships. Submitted by Denmark and United Kingdom, IMO London.
SLF 55/INF.8, 2012: The GOAL based Damage Stability project (GOALDS) - Derivation of updated probability of survival for passenger ships. Submitted by Denmark and United Kingdom, IMO London.
SLF 55/INF.9, 2012: The GOAL based Damage Stability project (GOALDS) ‒ Development of a new risk-based damage stability requirement for passenger ships based on Cost-Benefit Assessment. Submitted by Denmark and United Kingdom, IMO London.
Figure 7 CN risk model for cruise ship
Table 4: Main particulars of ship designs optimised
No Type Length bp Breadth Draught Gross
Tonnage
Number of Persons
m m m tonnes
1 large cruise 300.00 40.80 8.75 153400 6730
2 small cruise 113.70 30.00 5.30 11800 478
3 PoPax Baltic 232.00 29.00 7.20 60000 3280
4 RoPax Med 172.40 31.00 6.60 43000 1700
5 RoPax ferry 95.95 20.20 4.90 7900 625
6 RoPax double end 96.80 17.60 4.00 6245 600
50.00% 6.238E-05
22.23% Velocity
50.00% 6.238E-05
33.33% Sinking (A-Index)
77.77% 4.364E-04
33.33% Water ingress
66.67% 1.122E-03
50.77% Operational area
22.23% 5.347E-05
7.14% Sinking (A-Index)
77.77% 1.870E-04
66.67% Water ingress
92.86% 3.126E-03
0.99% Initiator
49.23% 4.897E-03
CN
99.01% 9.901E-01
CN Risk model
No Yes
Striking Struck
Limited Waters / En Route
No Yes
No Yes
Fast
Slow
Terminal
Yes
No
No
Yes
Based on merged casualtyreports Ship category
dependent
[image:9.595.55.457.381.503.2]