City, University of London Institutional Repository
Citation
:
Dillingham, I., Mills, B. and Dykes, J. (2011). Exploring Road Incident Data with Heat Maps. Poster presented at the Geographic Information Science Research UK 19th Annual Conference (GISRUK 2011), 27 - 29 Apr 2011, University of Portsmouth,Portsmouth, UK.
This is the unspecified version of the paper.
This version of the publication may differ from the final published
version.
Permanent repository link: http://openaccess.city.ac.uk/738/
Link to published version
:
Copyright and reuse:
City Research Online aims to make research
outputs of City, University of London available to a wider audience.
Copyright and Moral Rights remain with the author(s) and/or copyright
holders. URLs from City Research Online may be freely distributed and
linked to.
Exploring Road Incident Data with Heat Maps
Iain Dillingham,1Bryn Mills2and Jason Dykes3
1,3the giCentre, School of Informatics, City University London, EC1V 0HB 2Trafficlink, 91 Charterhouse Street, London, EC1M 6HR
1Tel. +44 (0)20 7040 295, Fax +44 (0)20 7040 8584
Email:1[email protected],2[email protected],3[email protected]
ABSTRACT:This research seeks to determine whether heat mapping is an effective technique for the visual exploration of road incident data. Four software prototypes, which adopted map, treemap and spatial treemap layouts, were developed using open source software. Whilst the visualization process described by Fry (2007) informed the development effort, the evaluation methodology was based on the Nested Process Model (Munzner, 2009). The results of two evaluation methods – a design study and the presentation and discussion of results with domain experts – confirm heat mapping’s validity and provide requirements for further software development.
KEYWORDS:heat map, visualization, evaluation, open source software
1. Introduction
Every day, thousands of journeys are made on Britain’s road network. To avoid congestion, many drivers seek traffic updates on the web, radio and television. Ultimately, these updates are produced by companies such as Trafficlink,1 who analyse road incident data. Unwin et al. (2008) assert that the
first stage of analysis involves getting to know the data, a process where graphical representations play an important role in assessing data quality, cleaning data and highlighting structure and outliers, for example. This research seeks to determine whether one such graphical representation, the heat map, is an effective technique for the visual exploration of road incident data.
Previous work undertaken within Trafficlink suggested that heat mapping could be used to represent and predict congestion. However, the termheat mapis loosely defined and may refer to the representation of geographic or non-geographic data. In cartography, for example, a heat map is an unclassed isarithmic map used to represent smooth, continuous phenomena (Slocum et al., 2009); in statistics, a cluster heat map is a permutable grid of cells, where each cell is coloured by value (Wilkinson and Friendly, 2009). Ultimately, both approaches informed the software development effort.
Four software prototypes were developed to explore the road incident data, reflecting the requirements of the target domain. The prototypes explored the number and severity of road incidents at multiple spatial and temporal resolutions; compared observed to expected number of road incidents; and represented the number of road incidents and length of road network across three road categories (‘A’, ‘B’ and motorways). Three prototypes adopted a map layout, whilst one adopted treemap (Shneiderman, 1992) and spatial treemap (Slingsby et al., 2008) layouts.
The importance of evaluation when developing techniques to visualize geographic information is noted elsewhere (Slocum et al., 2001). Consequently, to determine whether heat mapping is an effective tech-nique, an evaluation methodology based on the Nested Process Model (Munzner, 2009) was used. This
model consists of four nested levels, where threats to a visualization’s validity, alongside appropriate evaluation methods, are identified at each level (Munzner, 2009).
The structure of this paper is as follows: section two describes the software development effort, situat-ing it within the visualization process described by Fry (2007). Section three describes the evaluation methodology, maps the visualization process described by Fry (2007) to the Nested Process Model (Munzner, 2009) and reports the results of immediate and downstream validation. Section four con-cludes and offers directions for future research.
2. The visualization process
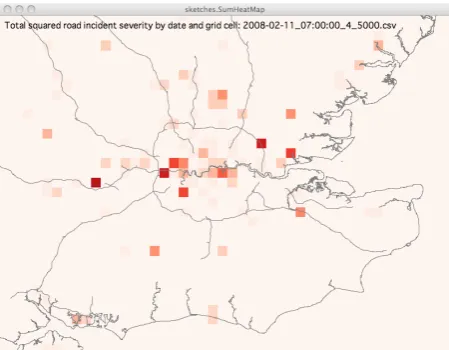
[image:3.595.73.298.330.505.2]Visualization can be viewed as a seven stage process, where the initial four stages – acquiring the data, parsing (structuring and ordering the data), filtering (obtaining only the data of interest) and mining (dis-cerning patterns in the data or setting the mathematical context) (Fry, 2007) – involve data processing, or the mapping of concrete data to abstract data-types (Munzner, 2009). This visualization process has been successfully used to explore library loans data, for example (Radburn et al., 2010) and structures the following discussion.
Figure 1:Severity of road incidents, map layout
The road incident data archive was supplied as a single 4.7G tab-separated-values file. The archive contained 14.5 million records, describ-ing 2.5 million road incidents which occurred in Britain between September 2002 and September 2009. Each road incident was described over multiple contiguous lines, leading to consider-able data redundancy.
The road incident data archive was parsed and loaded into MySQL2 using standard Unix and
MySQL command-line tools. Although large in size, performing these operations took under 15 minutes. Using MySQL permitted more ef-fective filtering of the road incident data, espe-cially when the command-line interface was used within MySQL Workbench,3a graphical tool for
interacting with MySQL databases. With appro-priate indices, a simple query returning rows relating to a road incident executed in under a second, whilst a more complex query involving a temporal filter executed in under 13 seconds. Although rela-tively slow, querying the database was quicker than extracting rows directly from the archive.
Querying the database also permitted more effective mining and led to the discovery of several anoma-lies concerning road incident start and end times. These anomaanoma-lies illustrated how the problem of characterising a road incident was non-trivial: not only could a road incident change over time but because of errors in the archival process, temporal change was not recorded accurately.
To conclude the data mining stage, a subset of road incidents occurring in February and August 2008 were exported from the database. The OGR Simple Feature Library4 was then used to perform a
co-ordinate transform operation on the geographic location of each road incident to ensure consistency with the boundary data used in the data representation stage. This library, released by the Open Source Geospatial Foundation, uses an abstract data model to access geographic data stored in standard and
2http://www.mysql.com/
3http://wb.mysql.com/
non-standard formats. The transformed subset was loaded into MySQL, alongside geometry data gen-erated by a PHP5 script for polygons covering Britain at six spatial resolutions. MySQL’s spatial
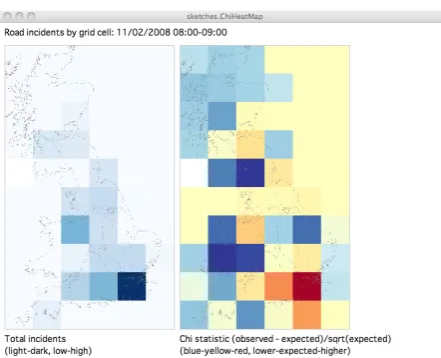
[image:4.595.73.294.142.321.2]ex-tensions were then used to produce summary data for the number and the severity of road incidents for each polygon at each spatial resolution over multiple time periods.
Figure 2:Number and observed versus expected number of road incidents, map layout
The final three stages in the visualization process involve representing the data, refining the rep-resentation and adding interaction to the repre-sentation (Fry, 2007). As previously noted, map and treemap layouts were selected, with a spatial treemap layout bridging the two. The software prototypes used ColorBrewer.org colour schemes (Harrower and Brewer, 2003) and were devel-oped using Processing6with additional
function-ality provided by the giCentre Utilities.7 The
prototypes which implemented a map layout used boundary data from the Meridian 2 dataset, available under the Ordnance Survey’s OpenData initiative.8 Although screenshots are provided,
the reader is encouraged to watch the video pre-sentations on the accompanying web page to learn more:
http://dillingham.me.uk/modules/dissertation/
The software prototypes support differing levels of interaction. Collectively,interaction with the data
consists of brushing cells in the treemap;interaction with the temporal dimensionconsists of stepping forwards and backwards through time periods; andinteraction with the data representationconsists of panning and zooming (Crampton, 2002).
3. Visualization evaluation
To determine whether heat mapping is an effective technique, it is essential to demonstrate that a heat map is appropriate to the task and is suitably well constructed; in short, to demonstrate the technique’s validity (Munzner, 2009). The Nested Process Model (NPM) (Munzner, 2009) provides a structure within which the factors threatening heat mapping’s validity can be examined. The NPM has four nested levels, where each level has both immediate and downstream evaluation methods. The latter are necessary because errors at outer levels will propagate to inner levels and because the validation of outer levels is often impossible until inner levels are completed (Munzner, 2009).
The elements in the visualization process described by Fry (2007) can be split into data processing (acquiring, parsing, filtering, mining) and data representation (representing, refining, interacting). Data processing maps to level two in the NPM, where the (concrete) vocabulary of the target domain is mapped to the (abstract) vocabulary of visualization (Munzner, 2009). In addition, it should be noted that level two also encompasses requirements gathering. Similarly, data representation maps to level three, where visual encodings and interactions are designed (Munzner, 2009).
To counter threats to validity at level two in the NPM, Munzner (2009) suggests only downstream eval-uation methods such as field studies are appropriate. Field studies take place in a natural environment
5http://www.php.net/
6http://processing.org/
7http://www.gicentre.org/utils/
and encompass interviews, observations, questionnaires and the collection and analysis of design arti-facts (Sharp et al., 2007). However, because they are often of extended duration an agile approach to gathering requirements and processing and representing data was adopted. This approach, combined with previous work undertaken within Trafficlink, also countered the principal threat at level one: mis-characterising the problem (Munzner, 2009).
Figure 3:Number of road incidents, spatial treemap layout
In seeking to assess the effectiveness of heat mapping, level three of the NPM is the ‘focus’ level. Here, the methods suggested by Munzner (2009) for immediate validation are all analyti-cal, in the sense of not involving end users (Sharp et al., 2007). However, although a heuristic eval-uation or an expert review would have been ap-propriate, a design study was selected as this method accords with the ‘formalised informal’ approach to evaluation which although “seldom explicitly discussed” is commonplace in cartog-raphy (Krygier, 1999, 249).
The design study highlighted how the software prototypes followed cartographic practice. The absence of a formal definition of heat mapping allowed some flexibility with the colour scheme, although greater control over the number of data classes and the data classification method would have been a considerable advantage. Whilst an assessment of the interactivity provided by the prototypes based on system provision (Crampton, 2002) suggested that they provided reasonably powerful forms of interaction, an alternative assessment based on user intention highlighted several omissions, such as the ability to (re)encode and select elements in the data representation (Yi et al., 2007).
Munzner (2009) suggests downstream validation at level three of the NPM should encompass presenta-tion and discussion of results, analysis of result images or user studies. The analysis of result images is often used where empirically-derived aesthetic guidelines exist (Munzner, 2009). Given the similarity of this evaluation method to a design study, it was not adopted. Similarly, whilst user studies have many advantages, it has been argued that they conflict with the nature of insight (North, 2006). This conflict is especially problematic as the generation of insight is fundamental to visualization (Card et al., 1999). Consequently, results were presented to and discussed with three traffic analysts and one external expert.
The presentation and discussion of results with domain experts was positive. The requirements to explore deviation from a ‘normal state’ (i.e. the expected number or severity of road incidents); variation between classes of road incidents; and ‘temporal clearance’ (i.e. the time between the start of a road incident and a return to the normal state) were noted as well as the requirement to model, as well as to explore, road incident data. One traffic analyst identified the treemap prototype, which implemented spatial and non-spatial layouts, as the most useful. The feedback suggested this prototype, alongside that which compared observed to expected number of road incidents, warranted further development and could make a positive contribution to the domain experts’ work.
4. Conclusion
experts. Threats at outer levels were addressed. Based on this validation process, it is possible to assert that heat mapping is indeed an effective technique for the visual exploration of road incident data.
Several recommendations for future research spring from this conclusion. The first is to conduct a comparative study encompassing alternative approaches to data representation, whilst the second is to formalise a definition of heat mapping necessary for such a study. Both address the question of the degree to which heat mapping is an effective technique. Finally, the feedback from domain experts suggested the treemap and spatial treemap layouts had the potential to assist them in their work. Eval-uation of these specific techniques would contribute to a greater understanding of how best to represent geographic data.
5. Acknowledgements
Iain Dillingham would like to thank Bryn Mills, Jason Dykes and Jo Wood for their assistance through-out the research and Bryn Mills for arranging an internship at Trafficlink.
6. References
Card, S. K., J. D. Mackinlay, and B. Shneiderman (1999).Readings in Information Visualization: Using Vision to Think. The Morgan Kaufmann series in interactive technologies. San Francisco, California: Morgan Kaufmann Publishers.
Crampton, J. W. (2002). Interactivity types in geographic visualization. Cartography and Geographic Information Science 29(2), 85–98.
Fry, B. (2007). Visualizing Data: Exploring and Explaining Data with the Processing Environment. O’Reilly Media.
Harrower, M. and C. Brewer (2003). ColorBrewer.org: an online tool for selecting colour schemes for maps.The Cartographic Journal 40(1), 27–37.
Krygier, J. (1999). Cartographic multimedia and praxis in human geography and the social sciences. In W. Cartwright, M. P. Peterson, and G. F. Gartner (Eds.),Multimedia Cartography. Berlin: Springer.
Munzner, T. (2009). A nested process model for visualization design and validation.IEEE Transactions on Visualization and Computer Graphics 15(6), 921–928.
North, C. (2006). Toward measuring visualization insight. IEEE Computer Graphics and Applica-tions 26(3), 6–9.
Radburn, R., J. Dykes, and J. Wood (2010). vizLib: using the seven stages of visualization to explore population trends and processes in local authority research. In M. Haklay, J. Morley, and H. Ra-hemtulla (Eds.), Proceedings of the GIS Research UK 18th Annual Conference GISRUK 2010, pp. 409–416.
Sharp, H., Y. Rogers, and J. Preece (2007). Interaction Design: Beyond Human-Computer Interaction
(2 ed.). Chichester: Wiley.
Shneiderman, B. (1992). Tree visualization with tree-maps: 2D space-filling approach. ACM Transac-tions on Graphics 11(1), 92–99.
Slocum, T. A., C. Blok, B. Jiang, A. Koussoulakou, D. R. Montello, S. Fuhrmann, and N. R. Hedley (2001). Cognitive and usability issues in geovisualization.Cartography and Geographic Information Science 28(1), 61–75.
Slocum, T. A., R. B. McMaster, F. C. Kessler, and H. H. Howard (2009). Thematic Cartography and Geovisualization (3 ed.). Prentice Hall Series In Geographic Information Science. Upper Saddle River, New Jersey: Pearson Prentice Hall.
Unwin, A., M. Theus, and W. Härdle (2008). Exploratory graphics of a financial dataset. In C. Chen, W. Härdle, and A. Unwin (Eds.),Handbook of Data Visualization, Springer Handbooks of Computa-tional Statistics, pp. 831–852. Springer Berlin Heidelberg.
Wilkinson, L. and M. Friendly (2009). The history of the cluster heat map. The American Statisti-cian 63(2), 179–184.
Yi, J. S., Y. ah Kang, J. T. Stasko, and J. A. Jacko (2007). Toward a deeper understanding of the role of interaction in information visualization. IEEE Transactions on Visualization and Computer Graphics 13(6), 1224–1231.
7. Biographies
Iain Dillinghamis a research student at the giCentre, City University London with research interests in visualization, geographic information and computer graphics.
Bryn Millsis Chief Technology Officer at Trafficlink.