City, University of London Institutional Repository
Citation
:
MacFarlane, A., Robertson, S. E. and McCann, J. A. (2000). PLIERS AT TREC8. Paper presented at the Eight Text REtrieval Conference (TREC 2008), 16-11-1999 - 19-11-1999, Gaithersburg, USA.This is the accepted version of the paper.
This version of the publication may differ from the final published
version.
Permanent repository link:
http://openaccess.city.ac.uk/4444/Link to published version
:
Copyright and reuse:
City Research Online aims to make research
outputs of City, University of London available to a wider audience.
Copyright and Moral Rights remain with the author(s) and/or copyright
holders. URLs from City Research Online may be freely distributed and
linked to.
City Research Online: http://openaccess.city.ac.uk/ [email protected]
PLIERS AT TREC8
A. MacFarlane1,2, S.E.Robertson1,2,J.A.McCann1
1 School of Informatics, City University, London EC1V OHB 2 Microsoft Research Ltd, Cambridge CB2 3NH
Abstract: The use of the PLIERS text retrieval system in TREC8 experiments is described. The tracks entered for are: Ad-Hoc, Filtering (Batch and Routing) and the Web Track (Large only). We describe both retrieval efficiency and effectiveness results for all these tracks. We also describe some preliminary experiments with BM_25 tuning constant variation.
1. INTRODUCTION
The work described here is a continuation and expansion of last year’s PLIERS entry [1] that concentrated on the VLC2 track. In TREC-8 we have entered for three main tracks: Ad-Hoc, Filtering and the Web Track. For the Filtering track we have entries for the Batch Filtering/Routing sub-tasks only and the large task in the Web Track. The main focus of our research is in the area of retrieval efficiency and we continue that theme in this paper (we accept that this focus differs from much of the other work done in TREC). However we have attempted to improve the retrieval effectiveness in our system by looking at the issue of tuning constants for BM_25 and the relationship between them.
The hardware used for much of these experiments is the “Cambridge Cluster” that consists of 16 nodes each with two Pentium PII-30 processors (32 processors in all), 384 MB of RAM and 9 GB of disk space on each. The nodes are connected by a fast Ethernet switch for general operation and a Myrinet (Gigabit class) switch for use by parallel programs. Also used for comparison and indexing purposes is a Pentium PII with 1 processor, 128 MB of RAM (much less than the Cluster nodes) and 9 GB of disk space. All 16 nodes of the Cluster were used in the parallel experiments, but we did not utilize all of the processors. In Indexing we used 17 processors (1 timer process and 16 indexer processes). For search we used 18 processors (1 batch client, 1 client interface and 16 leaf processes mapped). For the Filtering track we used 16 processors (mapping was 1 processor for a master Router, 15 processors for Slave Routers). The topology used is given in [1].
The structure of the paper is as follows. Details of indexing experiments and the databases/collections used are described in section 2. Initial work done on tuning constants is outlined in section 3 and a hypothesis is put forward concerning their use. The TREC-8 Ad-Hoc experiments are described in section 4. The Filtering Track experiments are described in section 5, while the Web Track experiments and some prior experiments with VLC2 data are outlined in section 6. A conclusion is given in section 7 particularly with regard to the tuning constant hypothesis.
2. INDEXING EXPERIMENTS AND DATABASE DETAILS
as speedup (sequential time/parallel time), efficiency (speedup/number of processors) and load imbalance (LI) [3] (Max node time/Average node time).
2.1 AD-HOC TRACK
Inverted File Type Machine Time
(Hours)
Speedup Efficiency LI Index Size
(% of Text)
Postings Only Pentium Cluster
0.81
0.059 13.68 0.85 1.06
324 Mb (17%) 342 Mb (18%) With Position Data Pentium
Cluster
1.04
0.064 16.17 1.01 1.06
832 Mb (43%) 851 Mb (47%)
Table 1 - Ad-Hoc Indexing Experiment Details
Table 1 show details of Ad-Hoc Indexing experiments. The Ad-Hoc text collection consists of Tipster Disk4 and Disk5 minus the Congressional record on disk4. It consists of 528,155 documents and the text size is 1,904 MB: the total word length detected was just under 270 million words. Indexing experiments on both the Cambridge Cluster and the single Pentium were done. Inverted files were partitioned on the cluster using the local build method with document identifier partitioning [4]: a method which keeps all data local during Indexing. A total of 17 processors was used to map 16 Indexer processes and 1 timer process. This is the same method used in last year's experiments [1]. Indexes with and without position data were produced. The cluster yielded good results particularly on Indexes with Position Data where the extra memory on the Cluster paid dividends: super-linear speedup and efficiency were recorded. There is a slight increase in Index size on the Cluster due to repetition of keyword records found in the type of Index used. The increases are only minor however: 0.05% for postings only files and 0.02% for files with position data.
2.2 FILTERING TRACK
DATABASE Batch Filtering Routing Training 1: EXTRACT Routing Training 2: SELECT Test Collection
Index Time (hrs) 0.085 0.42 0.50 0.18
No Documents 64,139 251,396 256,761 140,651
Text Size in MB 167 979 1,013 382
Index Size in MB (% of Text)
37.72 (22.3%) 158 (16%) 162 (16%) 85 (22%) Relevance Judgments (Avg) 548 (10.96) 1836 (36) 1797 (35) 1276 (25.52) Collection Word Length (Million)
27 138 142 60
Description FT 1992: Disk 4
1/2 of Disk4/5 Minus FT1993/4
1/2 of Disk4/5 Minus FT1993/4
[image:3.612.107.504.422.587.2]FT1993/4: Disk 4
Table 2 - Filtering Track Indexing Experiment Details
EXTRACT database is used to make the term pools and is not used in the term selection process). The Test collection was kept on the single Pentium.
2.5 WEB TRACK
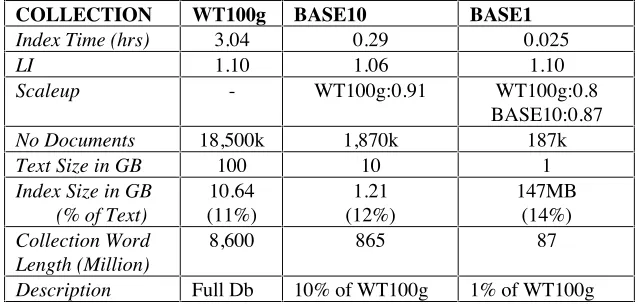
COLLECTION WT100g BASE10 BASE1
Index Time (hrs) 3.04 0.29 0.025
LI 1.10 1.06 1.10
Scaleup - WT100g:0.91 WT100g:0.8 BASE10:0.87
No Documents 18,500k 1,870k 187k
Text Size in GB 100 10 1
Index Size in GB (% of Text)
10.64 (11%)
1.21 (12%)
147MB (14%)
Collection Word Length (Million)
8,600 865 87
[image:4.612.146.465.132.285.2]Description Full Db 10% of WT100g 1% of WT100g
Table 3 - Web Track Indexing Experiment Details
The Web Track collection (WT100g) consists for 100 GB of spidered web data and was originally used in last years VLC2 track [6]. The BASE1 and BASE10 are baseline collections of the WT100g. All three collections were distributed as evenly as possible across the 16 nodes of the Cluster by linear assignment i.e. 1stx files are placed on the 1st node, 2ndx files are placed on the 2nd node etc: x is approximately total collection files divided by the number of nodes. Inverted files were partitioned on the cluster using the local build method with document identifier partitioning [4]. A total of 17 processors was used to map 16 Indexer processes and 1 timer process. The indexing times for the Web Track collections compare favorably with the results given at last years VLC2 track: the times stated above are faster than all VLC2 indexing times and meet the standard sought at last years VLC2 (an indexing time of 10 hours or less). The load balancing for all Indexing experiments on the Web Track is good with only slight levels of imbalance recorded: this confirms that the strategy used for distributing the collection to nodes was a good one. The Index time scaleup from the baselines to WT100g and from BASE1 to BASE10 are good, with very little deterioration in time per index unit. The index sizes also compare very well with only one VLC2 participant yielding smaller Indexes than the figures we quote above. The Indexes produced on all collections contained postings only data.
3 TUNING CONSTANTS FOR BM_25
One aspect of PLIERS that has yet to be fully investigated is the retrieval effectiveness of the system. One way of looking effectiveness is to examine the issue of tuning constants for the weighting function BM_25. The method does not require much effort in order to increase effectiveness and experiments can be conducted very quickly and easily. There are two constants defined for BM_25 [7]: K1 that effects the influence of term frequency while the constant B is used to modify the effect of document length. Given that there has been no systematic work done with Okapi we also decided to examine the relationship between the two constants as well as the relationship between those constants and other variables such as Recall and Precision.
The collection used for initial experiments on tuning constants was AP 1989/90 from last years Filtering track (also used for preliminary Filtering/Routing runs – see below) and the VLC2 collection also from TREC-7. We used topics' 1-50 over the AP data in with queries defined from Title Only, Title & Description and Title/Description/Narrative. For the VLC2 data we used topic 351-400 in Title Only form (we wanted the best possible figure in order to improve effectiveness for the Web Tracks small queries). The relevance judgments used were taken from TREC-7 for those topics. The values for B
from 0 to infinity and varied values with each query type depending on how interesting the results were. We investigated a number of different measures including TREC average Precision, Recall and Precision at 20. Our criterion however was to find the best combination of B/K1 on average Precision criterion. We plotted B against K1 and ran experiments against each other plotting the evaluation measure as a third variable. We then chose the best K1/B combination for a given query for use in Ad-Hoc and Web Track experiments (the constants chosen are reported in the relevant sections below).
We give a very brief description of our experimental results and some conclusions arising from them. In the case of average precision on the AP data it was found that K1 tended to be more significant than B except when B < 0.3 with Title/Description/Narrative queries. The VLC2 data was measured with Precision at 20 with which B was more significant. With Recall there tended to be more of an interaction between the constants, apart from Title/Description on AP data where K1 was dominant. It is clear from the data that there are trends and that the tuning constant variation data is not random. The data does however yield different shapes of surface depending on effectiveness measure, query content and collection used (given the small number of collections used). We would say that in general K1 is more significant than B, but there does appear to be a noticeable interaction between the constants with some evaluation measures. The implication is that Term Frequency tends to be significant when using the
BM_25 term weighting function with some measures.
We wish to investigate the following hypothesis: K1/B values from one data set (where a data set is defined as a set of queries and a collection), are good predictors for retrieval effectiveness in another data set, irrespective of measurement used. We will return to the validity of this hypothesis in the conclusion.
4 AD-HOC TRACK EXPERIMENTS
The purpose of the Ad-Hoc experiments was to examine the issue of term weighting with no passages (referred to simply as term weighting in the rest of this paper) versus passage retrieval search. The passage retrieval mechanism used is from Okapi experiments at TREC [8]. We submitted five runs and recorded extra runs for the two types of search for queries derived on topics' 401-450. For passage retrieval we did one parallel run and one uniprocessor run. For Term Weighting we did two parallel runs and two sequential runs composed of runs on Indexes with and without position data. We prepared Title, Title/Description and Title/Description/Narrative queries for each topic from Okapi generated queries. The run identifiers together with their query processing type and query type are given in table 4. Extra runs were done on the single database as well in order to compare times.
TRACK RUN-ID
QP TYPE QUERY TYPE COMMENTS
plt8ah1 PASSAGE Title Only 2 Timing runs plt8ah2 PASSAGE Title/Description 2 Timing runs plt8ah3 PASSAGE Title/Descr./Narr. 2 Timing runs plt8ah4 Term W. Title Only 4 Timing runs. plt8ah5 Term W. Title/Description 4 Timing runs.
plt8ah6 Term W. Title/Descr./Narr. 4 Timing runs. Not submitted.
Table 4 - Details of Ad-Hoc Track runs
4.5 Retrieval Effectiveness
Table 5 shows our Ad-Hoc results for TREC8. We include in the table the results for submitted runs, results for revised runs after a bug (in the parallel program) was fixed and the best values found by varying the tuning constants K1 and B.
TRACK RUN-ID
SUBMIT EVALS
REVISED EVALS
BEST
(CONST VALS)
plt8ah1 0.165 0.212 0.238 (K1=1.0,B=0.3) plt8ah2 0.160 0.190 0.189 (K1=1.5,B=0.6) plt8ah3 0.135 0.165 0.161 (K1=1.5,B=0.8) plt8ah4 0.139 0.181 0.234 (K1=1.0,B=0.3) plt8ah5 0.149 0.180 0.190 (K1=1.5,B=0.6) plt8ah6 0.123 0.150 0.157 (K1=1.5,B=0.8)
Table 5 – Average Precision Results for AD-HOC runs
The original results submitted were very poor, but the revised results for the Title Only query using passage retrieval with the chosen tuning constants are much improved, if a little low. Results on long queries are not particularly good for any of those runs. The passage retrieval Title Only revised run (plt8ah1) produced results in which 24 out of the 50 topics were better than the median. This figure was reduced to 22 out of 50 for the revised term weighting run (plt8ah4). In both of these revised runs we record an average precision for topic 431 which was better than the best Ad-Hoc run: 0.558 compared to 0.526. It should be noted that nothing special was done with the queries such as using relevance feedback and/or thesauri.
The tuning constants chosen for all Ad-Hoc queries were not good predictors for the data used this year. In all cases with all types of query, the graph shape of the Ad-Hoc data is entirely different to that of the AP data. In the Ad-hoc data K1 tending to be more significant for short queries while B tended to be more significant for longer queries. A better pair of constants was available and we show them with their results in table 5. We can state that the hypothesis declared in section 3 above is invalid when a source collection for choosing tuning constants is different from the target collection on which the constants are to be applied.
With respect to retrieval effectiveness gain of passage retrieval over term weighting we found that there were slight improvements for revised submitted runs, but for the best term weighing constant values there was little improvement and for Title/Description queries we actually recorded a slight reduction in average precision. It seems likely from this that the best tuning constants in term weighting search may not be the best pair when applied to query processing using passage retrieval: all tuning constants applied to Ad-Hoc were gathered on term weighting runs. It should be noted that the problem we had last year with the passage retrieval module was a minor bug and easily resolved when found. 4.6 Retrieval Efficiency
The response times for all 18 processor parallel runs were good with all average query processing times under 10 seconds [9]: 7 of the 9 parallel runs were under a second. The single processor runs registered good times with a maximum of 11 seconds for Title/Description/Narrative, while 7 of the 9 runs had an average query processing time of under 5 seconds.
out of the 9 runs with recorded measurements of 1.06 or under. With passage retrieval the parallel version examines 16 times more documents (16,000 as against 1,000) than the sequential version. All the passage retrieval runs managed to reduce the average query processing time and still examine the extra data: the best example was Title Only that took 0.83 seconds on average (sequential run) as against 0.36 on average for the parallel run.
There are a number of extra costs involved in utilizing Passage Retrieval and the position data which is recorded in Inverted files, that is costs of searching an Index with postings only data as compared with searching on one that contains position data. With respect to the extra costs of Passage Processing, there was very little noticeable difference on the sequential runs (largely because of main memory restrictions on the data used). However there was a marked change comparing search times on the parallel processing runs with much larger times for Passage retrieval over ordinary term weighting search: the worst being a factor of 18 when using Title/Description/ Narrative queries. The extra cost on Term Weighing search on Indexes with position data as against Indexes without position data was found to be consistent with a factor just over 2.2 for sequential runs, while the extra cost on the parallel runs was 1.5. The extra I/O bandwidth that is deployed with this type of parallelism (Shared Nothing) yields benefits when comparing the search performance on Indexes with postings only data and those containing position data. It should be noted that the figures declared in this section and used for comparison are optimistic given that each node in the "Cambridge Cluster" has three times the memory of the uniprocessor Pentium used.
5 FILTERING TRACK EXPERIMENTS
TRACK RUN-ID SUB-TRACK ALGORITHM OPERATION
[image:7.612.136.470.348.415.2]plt8f1 BATCH FILT. FIND BEST ADD/REMOVE plt8f2 BATCH FILT. FIND BEST ADD/REWEIGHT plt8r1 ROUTING FIND BEST ADD/REMOVE plt8r2 ROUTING FIND BEST ADD/REWEIGHT
Table 6 - Details of Filtering Track runs
The main purpose of the Filtering track experiments is to show speed efficiency for the term selection algorithms used in the past for Filtering/Routing by Okapi at TREC [5]. Recall that 16 processors were used in these experiments. For the purpose of these experiments we used the Find Best algorithm: this is largely because earlier experiments (to be published later [11]) indicated that the best time reduction/effectiveness is achieved with that method of term selection. In this paper we report only on runs done on 16 nodes using 16 processors (other runs will be reported in [11]). Topics without relevant documents were not treated differently from topics with relevant documents as we were testing the parallelization of the query optimization algorithms. We used two operations in conjunction with the Find Best algorithm: Add/Remove terms and Add terms with re-weighting. They are both more computationally intensive than Add only and yields better retrieval effectiveness. We treated the databases differently in the different sub-tracks. With Batch Filtering runs we did extraction of terms and term selection on one database: this was because of the small number of relevant documents available in the training set. However with Routing we were able to do extraction of terms on one database and term selection on another as per Okapi experiments [5]. The number of relevant documents in the Routing training set allowed us this flexibility (the main reason for splitting the training set when using the term selection algorithms is to reduce the overall level of overfitting). All term selection runs were optimized using TREC average Precision: we tried using the utility function LF1 but the results were poor. This confirms the Okapi experiments result which predict that average Precision is a good predictor for other measures, but the other measures do not predict each other well. All Batch Filtering runs were optimized for the U1 utility function.
track experiments into two sections one of effectiveness and one for efficiency. Each section has discussion on the sub-tracks entered: Batch Filtering and Routing. We entered four runs for TREC 8: details of these can be found in table 6.
5.1 Retrieval Effectiveness
a) Batch Filtering
TRACK RUN-ID
SELECTION (Recall/Prec)
TEST DB (Recall/Prec)
AVERAGE EVALUATIONS
PER TOPIC
AVG SCALE
D LF1
plt8f1 0.856/0.843 0.142/0.280 907 0.354 plt8f2 0.855/0.849 0.149/0.287 2022 0.376 AP Run 0.852/0.816 0.250/0.118 5764
-Table 7 - Details of Batch Filtering Efficiency Results
Both submitted filtering runs were optimized for the LF1 utility function. We present the results in table 7: the average scaled utility function used is from Hull [10]. The Recall/Precision for the selection runs are all very good indeed: the number of relevant documents per topic is 51 compared with just under 11 per topic for the FT data therefore our runs this year have done better with less data. This is also true of Precision on the FT test database but not true of Recall. Our filtering runs for this year sacrifice Recall for Precision. The Precision for filtering is comparable with Routing results (see table 8 below) and much higher than was expected given the type of method used for filtering and the number of relevant documents available. Comparing Add/Remove operation to Reweight we found an increase of 2.5% for the former over the latter: this increase is not particularly significant given that Reweighting need 2.2 times the Average evaluations per topic than Add/Remove. The increase in scaled average utility was more significant: using Reweight operation yielded a 6% advantage over Add/Remove.
b) Routing
TRACK RUN-ID
SELECTION (Recall/Prec)
TEST DB (Recall/Prec)
AVG EVALS PER TOPIC
[image:8.612.129.481.167.260.2]plt8r1 0.873/0.696 0.858/0.286 1932 plt8r2 0.887/0.734 0.845/0.288 5364 AP Run 0.824/0.608 0.543/0.286 5481
Table 8 - Details of Routing Efficiency Results
[image:8.612.172.443.459.525.2]the results where acceptable, if a little disappointing compared with other participants in the Routing sub-track.
5.2 Retrieval Efficiency
a) Batch Filtering
The average query selection time for the AP data set was 115 seconds, taking on average 26.56 iterations to select an average of 28.2 terms. The results submitted on the FT data set for TREC-8 are in stark contrast. For run plt8f1 the average term selection time per topic was 6.7 seconds with an average of 8 iterations choosing an average of 9.3 terms. Run plt8f2 was slightly more costly computationally taking 19 seconds per topic on 8.5 iterations with an average of 10 terms chosen per topic. The LI was very poor for FT data: a LI of 1.65 was recorded for plt8f1 while for plt8f2 the figure was 2.15. The LI for AP data was 1.46, an improvement on the FT data figures but are still not particularly good. The reason for the reduced load balance in these experiments is that some nodes had terms which were far more costly to evaluate than others: even though the processes were given virtually the same number of terms to inspect. In the context of time it would not therefore seem to be any use in applying parallelism to the Okapi term selection algorithms for smaller databases where there are only a limited set of relevance judgments. It is important to try and find the accumulation level for relevant documents on topics where parallelism could be applied to the term selection algorithms usefully.
b) Routing
The average term selection time for AP data was 23 minutes with an average of 49.5 iterations choosing 51.5 terms on average. The average term selection times for FT data were much smaller: taking 1.75 minutes for run plt8r1 and 6 minutes for plt8r2. The number of terms chosen was an average of 21 for plt8r1 and 27 for plt8r2. The number of iterations on FT data was also much reduced being on average 20 for plt8r1 and 25 for plt8r2. The LI for add with re-weight operation was much better than for Add/Remove operation: term selection on AP data yielded a LI on 1.25 while for plt8r2 the figure was 1.28. Run plt8r1 yielded a LI of 1.33 by contrast. The results with respect to efficiency are far superior in Routing than batch Filtering: this is largely due to the size of the data set used and the number of relevance judgments available in the Routing task compared with Filtering. The size of the data set used has a considerable impact on load imbalance. The size of the collection would be therefore a factor when examining the viability of deploying term selection algorithms. Results from runs which use lesser numbers of processors will be reported later [11].
6. LARGE WEB TRACK EXPERIMENTS
TRACK RUN-ID QP TYPE DATABASE COMMENTS
plt8wt1 Term W. WT100g 1 Timing run plt8wt2 Term W. BASE10 1 Timing run plt8wt3 Term W. BASE1 1 Timing run
Table 9 – Details of Web Track runs
6.1 Retrieval Effectiveness
a) VLC2 Experiments
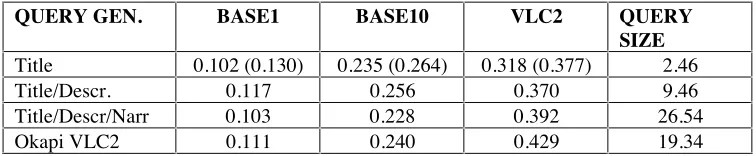
QUERY GEN. BASE1 BASE10 VLC2 QUERY
SIZE
[image:10.612.117.495.130.208.2]Title 0.102 (0.130) 0.235 (0.264) 0.318 (0.377) 2.46 Title/Descr. 0.117 0.256 0.370 9.46 Title/Descr/Narr 0.103 0.228 0.392 26.54 Okapi VLC2 0.111 0.240 0.429 19.34
Table 10 – Precision at 20 for VLC2 Experiments
We present the retrieval effectiveness results on the VLC2 data in table 10. The figures in brackets are evaluations with tuning constants set as: K1= 1.5 and B = 0.2. These were found to be the best combination on VLC2 data evaluations. The other runs are with tuning constants set as K1=2.0 and B = 0.6: these settings were used in last years VLC2 experiments [1]. We declare runs on generated queries based on the Title, Description and Narrative as wells at the Okapi generated VLC2 Queries we used last year. Queries were generated from topics 351 to 400.
We have managed to improve the retrieval effectiveness of PLIERS considerably since last year’s entry [1]. For example comparing the results for PLIERS at VLC2 with the Okapi VLC2 queries used we have a figure of 0.111 compared with 0.08 and 0.056: an improvement of 39% and 98% respectively. Examining the tuning constant data has allowed us to improve our Title Only queries quite considerably (we did not do experiments on other query type because of time constraints). Our Title Only results compare favorably with last years VLC2 runs where 0.377 is higher than 4 out of 18 submitted runs (which were based on tile/description in the main). However our Okapi VLC2 query runs results are only higher than 5 out of the 18 submitted runs and we therefore need to examine the issue of effectiveness on larger queries (including experiments with tuning constant variation). As with other participants in last year’s VLC2 track, we also recorded a significant rise in precision at 20 moving from the baselines to the full collection [6].
b) Web Track Experiments
DATABASE MODIFIED
AV PREC
PREC @ 10 PREC @ 20
BASE1 0.189 0.320 0.269 BASE10 0.323 0.476 0.436 WT100g 0.458 0.550 0.561
Table 11 – Large Web Track Retrieval Effectiveness Results
The results from the 50 evaluated Web Track queries are very good indeed on all collections, particularly the full 100 Gbyte collection (see table 11). They represent a vast improvement over last years results and clearly reinforce the evidence provided by the Ad-Hoc experiments that effectiveness on short queries is good. The most important aspect of these experiments is that the tuning constants chosen in Title Only VLC2 runs were good predictors for retrieval effectiveness for Precision at 20: the chosen K1 and B
[image:10.612.172.440.482.548.2]6.2 Retrieval Efficiency
a) VLC2 Experiments
In Table 12 we present the average query processing times in seconds together with the ratios to the appropriate baseline measures. The ratio is defined as: Big Collection Response time/Little Collection Response Time. We also give a measure of Scalability that is the proportion of time as against the database or collection size: The equation is as follows:
Scalability = Average Query Response Time (Smaller Collection) * Data Size (Larger Collection) Average Query Response Time (Larger Collection) Data Size (Smaller Collection)
Equation 1 – Scalability Measurement
This metric has the advantage over simple ratios in that its result actually relates query processing times to the size of data in question. We give two figures in our results for comparison purpose; one relating to the actual text size and one to the Inverted file size.
QUERY GEN. BASE1 BASE10 WT100g
[image:11.612.162.451.283.350.2]Title 0.052 0.074 (1.4) 0.87 (16.8, 11.78) Title/Descr. 0.063 0.339 (5.4) 4.4 (69.8, 12.99) Title/Descr/Narr 0.11 1.06 (10.05) 14.64 (138.2, 13.76) Okapi VLC2 0.14 0.93 (6.83) 12.21 (89.9, 13.2)
Table 12 – Average Query Processing times for VLC2 experiments (ratios to baselines)
The processing speed for most runs is very good. We report the average of the two runs submitted for each database. Only two of the VLC2 runs exceed the 10 second requirement for query response times, but these are the two largest queries applied to the index (see table 10 for query sizes). One of the runs, namely Title Only meets the VLC2 requirement of a 2 second or less response time for queries over the full collection [6] and compares favorably to query response times for VLC2 participants. Query processing times in proportion to the collection size showed sub-linear growth when comparing BASE1 to the other collection runs: the exception was the larger Title/Description/Narrative runs. The ratio from BASE10 to WT100g shows super-linear growth for response times for all runs.
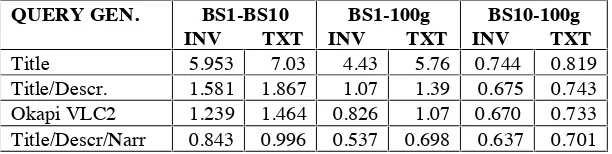
QUERY GEN. BS1-BS10
INV TXT
BS1-100g INV TXT
BS10-100g INV TXT
Title 5.953 7.03 4.43 5.76 0.744 0.819 Title/Descr. 1.581 1.867 1.07 1.39 0.675 0.743 Okapi VLC2 1.239 1.464 0.826 1.07 0.670 0.733 Title/Descr/Narr 0.843 0.996 0.537 0.698 0.637 0.701
Table 13 – Scalability Results for VLC2 experiments
[image:11.612.154.460.493.570.2]b) Web Track Experiments
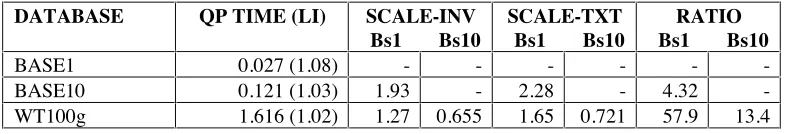
DATABASE QP TIME (LI) SCALE-INV
Bs1 Bs10
SCALE-TXT Bs1 Bs10
RATIO Bs1 Bs10
[image:12.612.110.504.94.161.2]BASE1 0.027 (1.08) - - - -BASE10 0.121 (1.03) 1.93 - 2.28 - 4.32 -WT100g 1.616 (1.02) 1.27 0.655 1.65 0.721 57.9 13.4
Table – 14 Average Query Processing times (secs) for Large Web Track experiments (Scalability/Ratios)
The processing speed for all runs is also very good, but not as good as for Title Only VLC2 runs. However, all runs meet the 10 second requirement for query response times. Load balance is good for all runs. The prepared average query length was found to be 2.49 terms: many terms in the queries were non-content bearing words and some queries contained none at all. A frequent query was the single term “a”. Why was the response time for Web Track queries higher than Title Only on WT100g (nearly double) despite the fact that Web Track Queries are only slightly larger than Title Only Queries? We compared the average set size of the 50 Title Only to a sample of 50 Web Track queries and found that the average set size per term for Title Only was 28K, whereas for the sample Web Track queries the average set size was 48K. The memory requirements for sets are very much larger for Web Track queries than for Title Only. We experimented with differing levels of in-core keyword on the sub-set of Web Track queries and found that we got best results with only 9% of the keyword dictionary in main memory (a document map file is kept in main memory that contains document lengths needed for BM_25). There is clearly an offset between the number of keywords and document lengths you keep in memory persistently against sets being retrieved and manipulated for Query service. Having to do I/O for list elements when weighting inverted list could reduce the search performance dramatically.
Measuring Scalability over both the text and Inverted file we found that the figures for BASE1 to WT100g were very good, while the corresponding figures from BASE10 to WT100g were acceptable. The same pattern with respect to elapsed time ratios found with VLC2 Title Only runs was found with Web Track runs: BASE1 to the other collections yielded sub-linear ratios, while BASE10 to WT100g yielded super-linear ratios. From Table 13 it can be seen that Title Only VLC2 queries yield better Scalability from BASE1 to other collections than the Web Track queries: this is another effect of the memory requirements for Web Track queries stated above.
It should be noted that the Scalability/Ratio measurements from BASE1 to the other collections should be treated with some caution, since the memory requirements and communication overheads for search times are vastly different. As with some of the smaller Ad-Hoc runs it is not clear that parallelism brings much benefit on collections of BASE1's size (see section 2.1). While these results are good there is clearly some scope for improvement, in particular the application of various query optimization techniques available [12].
7 CONCLUSION
We need to investigate why longer Ad-Hoc queries in our system do not yield good retrieval effectiveness results. Further research into query optimization techniques for Ad-Hoc search would be fruitful: this would also require an investigation into the trade offs with respect to effectiveness and efficiency found with such techniques. In the case of the Filtering/Routing track we need more evidence on the number of relevant documents needed for choosing the type of term selection technique, for a collection of a given size.
References
[1] A. MacFarlane, S.E.Robertson and J.A.McCann, “PLIERS at VLC2”, In: Eds, E. M. Voorhees and D. K. Harman, NIST Special Publication 500-242: Proceedings of the Seventh Text Retrieval Conference Conference, Gaithersburg, U.S.A, November 1998, Gaithersburg: Department of Commerce, National Institute of Standards and Technology, 1999.
[2] C. Fox, “A Stop List for General Text”, SIGIR FORUM, ACM Press, Vol 24, No 4, December 1990. [3] D. Hawking, “The Design and Implementation of a Parallel Document Retrieval Engine”, Technical Report TR-CS-95-08, Department of Computer Science, Australian National University, 1995.
[4] A. MacFarlane, J.A.McCann, and S.E.Robertson, “PLIERS: A Parallel Information Retrieval System using MPI”, In: Dongarra, J., Luque, E., Margalef, T., Eds, Proceedings of EuroPVM/MPI'99, Barcelona, LNCS 1697, Springer-Verlag, 1999.
[5] M.M. Beaulieu, M. Gatford, X. Huang, S.E. Robertson, S. Walker and P. Williams, “Okapi at TREC-5”, In: Ed, D.K.Harman, NIST Special Publication 500.238: Proceedings of the Fifth Text Retrieval Conference, Gaithersburg, U.S.A, November 1996, Gaithersburg: Department of Commerce, National Institute of Standards and Technology, 1997.
[6] D. Hawking, N. Craswell and P. Thistlewaite, “Overview of TREC-7 Very Large Collection Track”, In: Eds, E. M. Voorhees and D. K. Harman, NIST Special Publication 500-242: Proceedings of the Seventh Text Retrieval Conference Conference, Gaithersburg, U.S.A, November 1998, Gaithersburg: Department of Commerce, National Institute of Standards and Technology, 1999.
[7] S.E.Robertson and K. Sparck Jones, “Simple, proven approaches to text retrieval”, Cambridge University Technical Report No. TR 356, May 1997.
[8] S.E. Robertson, S. Walker, S. Jones, M.M. Hancock-Beaulieu, and M. Gatford, “Okapi at TREC-3”, In: D.K. Harman, NIST Special Publication 500-226: Proceedings of Third Text Retrieval Conference, Gaithersburg, U.S.A., November 1994, Gaithersburg: Department of Commerce, National Institute of Standards and Technology, 1995.
[9] W.B. Frakes, “Introduction to Information Storage and Retrieval Systems”, In: W.B. Frakes, and R. Baeza-Yates, Eds. “Information Retrieval: Data Structures and Algorithms”, Prentice-Hall, 1992, 1-12. [10] D.A. Hull, "The TREC-7 Filtering Track: Description and Analysis", In: Eds, E. M. Voorhees and D. K. Harman, NIST Special Publication 500-242: Proceedings of the Seventh Text Retrieval Conference Conference, Gaithersburg, U.S.A, November 1998, Gaithersburg: Department of Commerce, National Institute of Standards and Technology, 1999.
[11] A. MacFarlane, S. Walker, S.E. Robertson and J.A. McCann, “Parallel computing for a very large search space in Routing/Filtering using Relevance Feedback”, Unpublished Paper.