City, University of London Institutional Repository
Citation
:
Robinson, Gordon M. (1995). Genetic algorithm optimisation of load cell geometry by finite element analysis. (Unpublished Doctoral thesis, City University London)This is the accepted version of the paper.
This version of the publication may differ from the final published
version.
Permanent repository link:
http://openaccess.city.ac.uk/13593/Link to published version
:
Copyright and reuse:
City Research Online aims to make research
outputs of City, University of London available to a wider audience.
Copyright and Moral Rights remain with the author(s) and/or copyright
holders. URLs from City Research Online may be freely distributed and
linked to.
Genetic Algorithm Optimisation
of Load Cell Geometry
by Finite Element Analysis
Gordon M. Robinson
A thesis submitted for the degree of
Doctor of Philosophy
City University
Measurement and Instrumentation Centre
Department of Electrical, Electronic and Information Engineering
School of Engineering
Northampton Square
London ECI V OHB
To
Alison
and
CONTENTS
ABSTRACT
ACKNOWLEDGEMENTS DECLARATION
LIST OF TABLES LIST OF FIGURES LIST OF PLATES
CHAPTER 1 INTRODUCTION
1.1 General introduction to force measurement 1.1.1 Force standards
1.1.2 Transfer standards 1.2 Strain gauge load cells
1.2.1 Principle of operation 1.2.2 Sources of error
1.3 Sensitivity to end-loading conditions 1.3.1 Tension load cells
1.3.2 Compression load cells
1.3.3 End-loading sensitivity and standards 1.3.4 Load cells as stress integrators 1.4 Scope of this study
1.5 Column load cells
1.5.1 Requirement for low profile column load cells 1.5.2 Multi-column designs
1.6 An overview of this thesis
CHAPTER 2
A REVIEW OF PREVIOUS WORK 2.1 Introduction
2.2 Analytic studies
2.2.1 Saint-Venant's Principle
2.2.2 Circular cylinders under axisymmetric loading 2.3 Experimental studies
2.3.1 The work of Rohrbach
2.3.2 The work of Feucht
2.3.3 The work of Debnam & Jenkins 2.3.4 The work of Bray
2.4 Numerical studies
2.4.1 The work of Mitchell et al. 2.4.2 The work of Sundin & Jonsson 2.4.3 The work of Williams
2.5 Conclusions
CHAPTER 3
PRELIMINARY ANALYSIS OF COLUMN LOAD CELLS
3.1 Introduction
3.2 Axisymmetric column load cells subject to general stress distributions
3.3 Bridge strain
3.4 Homogenous Solution Study 3.4.1 Introduction
3.4.2 The modelling of finite cylinders as semi-infinite 3.4.3 Analysis method
3.4.4 Approximation of an annular load 3.5 The analysis program
3.5.1 Overview
3.5.3 Optimum parameter values 3.6 Results from program CYSTRESS. FOR
3.6.1 Surface axial strain
3.6.2 Surface circumferential strain 3.6.3 Surface bridge strain
3.7 Conclusions
CHAPTER 4
MEASUREMENT OF SURFACE STRAINS IN A CYLINDER
4.1 INTRODUCTION 4.2 Strain gauged cylinder
4.2.1 Strain gauges 4.2.2 Instrumentation
4.2.3 Strain gauge bridge circuit 4.2.4 Thermal effects on bridge output 4.2.5 Creep of the strain gauge output 4.2.6 Control and data logging
4.2.7 Loading pads 4.2.8 Test method
4.2.9 Calculation of results 4.3 Results
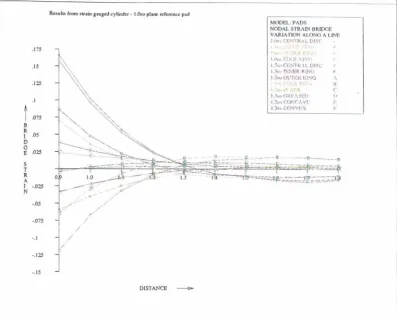
54 56 57 58 58 65 69 69 70 71 4.3.1 Tests on plane, central disc, and ring pads
4.3.2 Tests on the concave and convex pads 4.4 Measurement of Young's modulus and Poisson's ratio
4.4.1 Strain gauge configuration 4.4.2 Results
4.5 Conclusions CHAPTER 5
DEVELOPMENT OF A SIMPLE FINITE ELEMENT ANALYSIS PROGRAM 72
5.1 Introduction 72
5.2 The finite element method 72
5.3 Choice of finite element software 73
5.4 The axisymmetric finite element program, axLf 74 5.5 Tests on the simple finite element program 74 5.5.1 Infinite thick cylinder under internal pressure 75 5.5.2 Analysis of long cylinder subject to annular load 78 5.5.3 Conclusions from the 'benchmark' tests 79
5.6 Conclusions 80
CHAPTER 6
MODELLING CONTACT 86
6.1 Introduction 86
6.2 Finite element analysis using infinite elements 86 6.2.1 Introduction to infinite elements 87 6.2.2 Two dimensional Zienkiewicz mapped infinite elements 88 6.2.3 Implementation of infinite elements 91 6.2.4 Test problems using infinite elements 91 6.3 Finite element analysis of contact problems 98
6.3.1 Introduction 98
6.3.2 The contact algorithm 100
6.3.3 Tests on contact algorithm 106
6.3.4 Conclusions from benchmark tests 107 6.4 Comparison between finite element model and experimental
results
6.4.1 1.0ro pads
Contents
108 108
6.4.2 1. Sro pads 6.5 Conclusions
CHAPTER 7
AUTOMATION OF THE MODELLING PROCESS
7.1 Introduction
7.2 Parameterised representation of the load cell
7.2.1 Representation of the lateral surface
7.3 Automatic mesh generation
7.3.1 Requirements
7.3.2 The automatic meshing routine
7.4 Meshing of the contact pads 7.5 Measures of end-loading sensitivity
7.5.1 EN-immunity
7.5.2
PCCU-immunity7.6 Reducing computation time 7.7 Conclusions
CHAPTER 8
GENETIC ALGORITHM SHAPE OPTIMISATION
8.1 Introduction
8.2 Optimisation algorithms
8.2.1 Gradient methods
8.2.2 Gradientless methods 8.2.3 Choice of algorithm 8.3 The simple genetic algorithm
8.3.1 Introduction
8.3.2 String representation
8.4 Theory of the simple genetic algorithm
8.4.1 Schemas
8.4.2 Crossover 8.4.3 Reordering
8.4.4 Mutation
8.5 Choice of GA parameters
CHAPTER 9
THE 'DARWIN' LOAD CELL 9.1 Introduction
9.1.2 The POGLE Program
9.2 Optimisation of 3 MN low-profile column load cell
9.2.1 Calibration of concrete-cube testing machines 9.2.2 Problem specification
9.3 Results from the GA optimisation 9.3.1 Optimisation of EN-immunity. 9.3.2 Optimisation of PCCU-immunity
9.4 End-loading sensitivity of 3 MN load cells with solid and hollow circular cylindrical elements
9.4.1 EN-immunity of circular cylinders 9.4.2 PCCU-immunity of circular cylinders
9.4.3 Comparison of Darwin design with cylindrical load cells
9.5 Conventional 3 MN low-prOfile load cell
9.5.1 Comparison of the Darwin and conventional designs 9.6 Manufacture of the Darwin prototype load cell
9.6.1 Machining 9.6.2 Strain gauging
9.7 Testing of the prototype load cell 9.7.1 Bearing pad test results 9.8 Conclusions
CHAPTER 10
CONCLUSIONS AND PROPOSALS FOR FURTHER WORK 10.1 Conclusions
10.2 Proposals for further work
REFERENCES AND BIBLIOGRAPHY
ABSTRACT
The objective of the work described in this thesis was to numerically model the influence of end-loading conditions on column strain gauge load cells and to develop the model into a program for optimising the geometry of column load cells.
It is shown that, for most practical loading conditions, load celis with large numbers of equispaced strain gauges are only sensitive to the axisymmetric components of contact stress distribution. The problem of cylindrical load celis subject to frictionless equipollant annular loading is analysed by the method of superposition of the
homogenous solutions. A plot of the relationship between sensitivity, load radius and cylinder aspect ratio is presented.
An experimental study using a strain gauged cylinder was then undertaken. The measured strains confirmed the results of the analytic solution and provided results for other loading conditions, more representative of those to which real load celis are subjected.
In order to extend the study to more typical contact conditions and to load celis of more complex shape, a simple finite element (FE) program incorporating contact analysis, automatic meshing, and infinite elements was developed. The results from the program are shown to be in good agreement with those from the analytic solution, from benchmark problems, and from the experiments. The FE program was used to predict the end-loading sensitivity of hollow and solid cylindrical load cells. Plots of their end-loading sensitivity against aspect ratio are presented.
The finite element routines were then used as the core of a Program for Optimising the Geometry of Load cell Elements (POGLE). This program combines genetic
algorithm optimisation with finite element analysis to optimise a load celi's shape so as to minimise its end-loading sensitivity.
ACKNOWLEDGEMENTS
This work was carried out while the author was an employee of the National Physical Laboratory (NPL). I gratefully acknowledge the provision by NPL of the time, funding, and facilities required for this work.
I wish to thank my supervisor at City University, Dr Faruq Abdullah, for his inspiration, support and guidance throughout this Ph.D. study. I am especially grateful for his infectious enthusiasm. I always returned to the work with renewed vigour following our discussions.
I would also like to thank all my colleagues at NPL who have assisted in many ways. In particular I am grateful to Andy Knott for his friendship, assistance and helpful criticism.
I would also like to single out Ray Jenkins of NPL for particular thanks. Ray has the rare ability to be simultaneously boss, colleague, and friend. In his capacity as boss, it is thanks to him that this work was started, and without his personal support it could not have been finished. As a colleague he gave me guidance, helpful suggestions, and encouragement. However, it is for his friendship that I would like to express my greatest thanks.
DEC LARA TION
I hereby grant powers of discretion to the University Librarian to allow this thesis to be copied in whole or in part without further reference to me. This permission covers only single copies made for study purposes, subject to normal conditions of
acknowledgement.
LIST OF TABLES
Table 1.1: Maximum departures from output on plane surface specified in
EN10002-3 7
Table 2.1: Debnam & Jenkins' results for four load cells of different design 20 Table 3.1: Effect of parameter values on bridge strain values (m=4, E=1) 39
Table 4.1: Output from gauges at mid plane 69
Table 5.1: Percentage error of strains from finite element solution, with
various mesh configurations 77
Table 6.1: Comparison of analyses of Boussinesq's problem 93 Table 6.2: Axial stress for frictionless contact of cylinder on elastic foundation 96 Table 6.3: Radial slip for frictionless contact of cylinder on elastic foundation 96 Table 6.4: Axial displacements for frictionless contact of cylinder on elastic
foundation
Table 6.5: Contact stresses for cylinder on elastic foundation, Table 6.6 Radial slip for contact of cylinder on elastic foundation, Table 7.1: EN10002-3 bearing pad test load conditions
Table 7.2: EN-immunity values of EN 10002-3 classes Table 8.1: Parameters governing GA optimisation algorithm Table 9.1: Parameters specifying problem for 3 MN load cell Table 9.2: Parameters specifying modelling of 3 MN load cell Table 9.3: Comparison of designs optimised for EN-immunity and
PCCU-immunity
Table 9.4: Bearing pad test results for Darwin cell design Tabie 9.5: Reiative deviation from output on plane pad
97 106 107 131 133 149 157 157
LIST OF FIGURES
Figure 1.1: A typical strain gauge circuit 3
Figure 1.2: Examples of variation in end-loading conditions 6 Figure 2.1: Transfer of force into a cylindrical load cell element
(from figure 4 of Rohrbach [1970]) 16
Figure 2.2: Errors due to radial restraint of cylindrical load celi
(from figure 5 of Rohrbach [1970]) 17
Figure 2.3: Effect of four different end-loading conditions on sensitivity,
linearity, and hysteresis (from figure 2 of Feucht [1970]) 18 Figure 2.4: The four load cell designs tested by Debnam & Jenkins [1972] 19 Figure 2.5: Load cell loading arrangement
(from figure 6 of Mitchell et al. [1971]) 21 Figure 2.6: Axial surface strains over central section
(from figure 8 of Mitchell et al. [1971)
Figure 2.7: Variation of load cell sensitivity with step position (from figure 3 of Sundin & Jonsson [1985]) Figure 2.8: The problem analysed by Williams
Figure 2.9: Fractional difference in bridge output with load radius (from figure 3.3 of Williams)
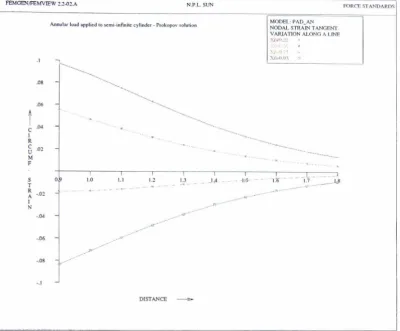
Figure 3.1: Column load cell subject to general stress distribution Figure 3.2 - Surface axial strain v distance from loaded end: Prokopov
solution: z=0.5r to 2.0r
Figure 3.3 - Surface axial strain v distance from loaded end: Prokopov
22
23 24
25 27
41
solution: z=0.9r to 1.8r 41
Figure 3.4 - Surface circumferential strain v distance from loaded end:
Prokopov solution: z=0.5r to 2.0r 42
Figure 3.5 - Surface circumferential strain v distance from loaded end:
Prokopov solution: z=0.9r to 1.8r 42
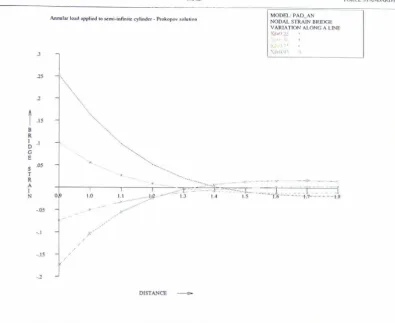
Figure 3.6: Surface bridge strain v distance from loaded end, z=0.5r to 2.0r:
Prokopov solution: 43
Figure 3.7: Surface bridge strain v distance from loaded end: Prokopov
solution: z=0.9r to 1.8r 43
Figure 3.8: Spread of bridge strain v aspect ratio 44 Figure 3.9: Contours of bridge strain due to equipollant annular load with
Xf=0.01: Prokopov solution 46
Figure 3.10: Contours of bridge strain due to equipollant annular load with
Xf=0.2: Prokopov solution 46
Figure 3.11: Contours of bridge strain due to equipollant annular load with
Xf=O.4: Prokopov solution 47
Figure 3.12: Contours of bridge strain due to equipollant annular load with
Xf=0.6: Prokopov solution 47
Figure 3.13: Contours of bridge strain due to equipollant annular load with
Xf=0.8: Prokopov solution 48
Figure 3.14: Contours of bridge strain due to equipollant annular load with
Xf=1.0: Prokopov solution 48
Figure 4.1: Circuit of strain gauged cylinder (only one gauge pair shown) 52 Figure 4.2: 1. Oro loading pads (profiles exaggerated) 55 Figure 4.3: 1.5ro loading pads (profiles exaggerated) 56 Figure 4.4: Axial strain v distance from loaded end: Prokopov solution:
Annular loads at mean contact radii 60
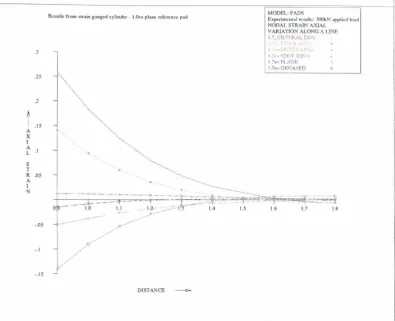
Figure 4.5: Axial strain v distance from loaded end: Experimental results:
1. Oro pads 60
Figure 4.6: Circumferential strain v distance from loaded end: Prokopov solution: Annular loads at mean contact radii
Figure 4.7: Circumferential strain v distance from loaded end: Experimental results: 1. Oro pads
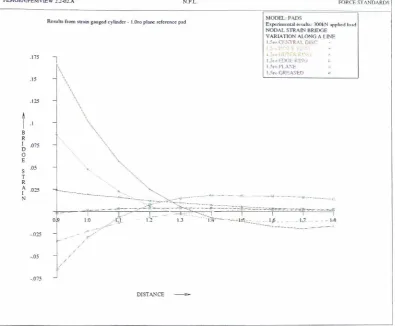
Figure 4.8: Bridge strain v distance from loaded end: Prokopov solution:
61
61
Annular loads at mean contact radii 62
Figure 4.9: Bridge strain v distance from loaded end: Experimental results:
1. Oro pads 62
Figure 4.10: Axial strain v distance from loaded end: Experimental results:
Figure 4.11: Circumferential strain v distance from loaded end: Experimental
results:
1.5ro
pads 63Figure 4.12: Bridge strain v distance from loaded end: Experimental results:
1.
5ro
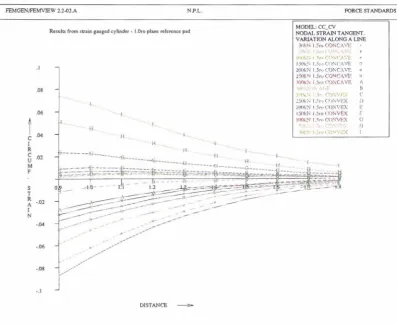
pads 64Figure 4.13: Axial strain v distance from loaded end: Experimental results: Concave/convex pads
Figure 4.14: Circumferential strain v distance from loaded end: Experimental results: Concave/convex pads
Figure 4.15: Bridge strain v distance from loaded end: Experimental results:
66
66
Concave/convex pads 67
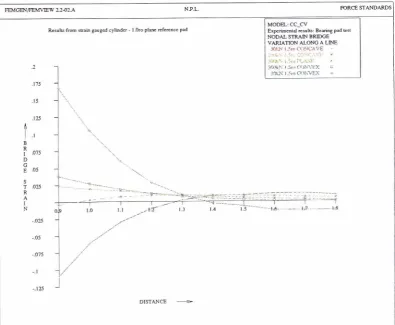
Figure 4.16: Bridge strain v distance from loaded end: Experimental results:
Bearing pad test 67
Figure 4.17: Bridge strain v distance from loaded end: Experimental results:
All pads 68
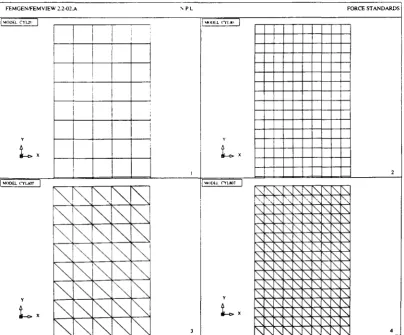
Figure 5.1: Mesh configurations used to analyse Lame's problem 76 Figure 5.2: Mesh configurations used to analyse cylinder of aspect ratio 4.0 76 Figure 5.3: Bridge strain v distance from loaded end: 20x5 quad. mesh 81 Figure 5.4: Bridge strain v distance from loaded end: 40x10 quad. mesh 81 Figure 5.5: Bridge strain v distance from loaded end: 40x10 triangular mesh 82 Figure 5.6: Bridge strain v distance from loaded end: 80x20 triangular mesh 82 Figure 5.7: Contours of bridge strain due to equipollant annular load with
Xf=O.O: FE analysis 83
Figure 5.8: Contours of bridge strain due to equipollant annular load with
Xf=0.2: FE analysis 83
Figure 5.9: Contours of bridge strain due to equipollant annular load with
Xf=O.4: FE analysis 84
Figure 5.10: Contours of bridge strain due to equipollant annular load with
Xf=0.6: FE analysis 84
Figure 5.11: Contours of bridge strain due to equipollant annular load with
Xf=0.8: FE analysis 85
Figure 5.12: Contours of bridge strain due to equipollant annular load with
Xf=1.0: FE analysis 85
Figure 6.1: Mapping of infinite elements 88
Figure 6.2: Mesh used to analyse Boussinesq's problem: 16 finite elements 92 Figure 6.3: Mesh used to analyse Boussinesq's problem: 12 finite elements +
4 infinite elements 92
Figure 6.4: Graded mesh used for Olukoko benchmark 95 Figure 6.5: Uniform mesh used for Olukoko benchmark 95
Figure 6.6: Contact between two bodies 101
Figure 6.7: Matrix reduction: start of first elimination pass 104 Figure 6.8: Matrix reduction: end of first elimination pass 104 Figure 6.9: Matrix reduction: end of second elimination pass 105 Figure 6.10: Axial strain v distance from loaded end: FE contact analysis:
I.Oro pads 109
Figure 6.11: Circumferential strain v distance from loaded end: FE contact
analysis:
1.
Oro pads 109Figure 6.12: Bridge strain v distance from loaded end: FE contact analysis:
1.
Oro pads 110Figure 6.13: Axial strain v distance from loaded end: FE contact analysis:
1.Sro pads 112
Figure 6.14: Circumferential strain v distance from loaded end: FE contact
analysis: l.Sro pads 112
Figure 6.15: Bridge strain v distance from loaded end: FE contact analysis:
l.Sro pads 113
Figure 6.16: Axial strain v distance from loaded end: FE contact analysis: concave/convex pads
Figure 6.17: Circumferential strain v distance from loaded end: FE contact analysis: concave/convex pads
Figure 6.18: Bridge strain v distance from loaded end: FE contact analysis:
113
114
concave/convex pads 114
Figure 6.19: Bridge strain v distance from loaded end: FE contact analysis:
bearing pad test 115
Figure 6.20: Bridge strain v distance from loaded end: FE contact analysis: all
pads 115
Figure 7.2: Crude estimate of distance from boundary 122 Figure 7.3: Capture interval too wide resulting in very distorted elements. 123 Figure 7.4: Capture interval too wide resulting in near coincident vertices 124 Figure 7.5: Grid of vertices with vertical boundary 124 Figure 7.6: Element formed by capture of vertex A 125 Figure 7.7: Element formed by capture of vertex B 125 Figure 7.8: Grid of vertices with boundary inclined at 450 to the horizontal 126 Figure 7.9: Element formed by capture of vertex A 126 Figure 7.10: Element formed by capture of vertex B 126 Figure 7.11: Initial rows of vertices and shape boundary 129 Figure 7.12: After capture by boundary and elimination of external vertices 129
Figure 7.13: Mesh generated from vertices 130
Figure 8.1: Function used in first trial GA optimisation 150 Figure 8.2: Three runs on first trial problem - without reordering 151 Figure 8.3: Mean fitness, X, and Y for run on first trial problem
-without reordering
Figure 8.4: Function used in second trial GA optimisation
Figure 8.5: Mean fitness and radius for run on second trial problem - without reordering
Figure 8.6: Mean fitness and radius for run on second trial problem - with
152 153
153
reordering 154
Figure 9.1: Mean fitness v generation for PCCU-immunity optimisation 158 Figure 9.2: Mesh of load cell optimised for EN-immunity 160 Figure 9.3 Mesh of load cell optimised for PCCU-immunity 160 Figure 9.4: Comparison of EN-immunity of cylindrical, Darwin and
conventional load cell designs
Figure 9.5: Comparison of PCCU-immunity of cylindrical, Darwin and conventional load cell designs
Figure 9.6: Mesh of low-profile load cell of conventional design Figure 9.7: Bridge strain in conventional load cell: Uniform pressure:
No friction
List of figures
162
163 165
167
Figure 9.8: Bridge strain in conventional load cell: Plane pad:
Friction=0.3 167
Figure 9.9: Bridge strain in conventional load cell: Convex pad: Friction=0.3 168 Figure 9.10: Bridge strain in conventional load cell: Concave pad:
Friction=0.3 168
Figure 9.11: Bridge strain in GA optimised load cell: Uniform pressure: No friction
Figure 9.12 Bridge strain in GA optimised load cell: Plane pad: Friction=0.3
Figure 9.13: Bridge strain in GA optimised load cell: Convex pad: Friction=0.3
Figure 9.14: Bridge strain in GA optimised load cell: Concave pad: Friction=0.3
Figure 10.1: Comparison of PCCU-immunity of Darwin and solid cylindrical load cells
169
169
170
170
LIST OF PLATES
Plate 4.1: The strain gauged cylinder Plate 9.1: The prototype Darwin load cell
List of plates
50
173
CHAPTER 1
INTRODUCTION
1.1 General introduction to force measurement
Since the earliest days of metrology there has been a requirement to measure force. Until recent times, little distinction was made between force, weight and mass and almost all force measurement relied on the use of weights either directly or acting through levers. Towards the beginning of this century, the first practical force sensors became available. These early devices, such as Amsler boxes, Wasau loops and proving rings, provided acceptable accuracy using mechanical or optical displacement measurement techniques. However, the devices were usually fragile, extremely sensitive to temperature, and required a great deal of skill to use.
Electrical resistance strain gauge force transducers, commonly called load cells, were developed during the 1940s and became available commercially in the 1950s. They were more robust than their mechanical and optical predecessors but were initially more expensive and less accurate. While they rapidly gained acceptance in control applications, force standards work remained the province of the mechanical devices until the advent of the integrated circuit in the 1970s. The cheap integrated circuit resulted in both a drop in price and an improvement in the performance of strain gauge bridge instrumentation. The photo-lithography techniques used to produce integrated circuits were also adapted to the manufacture of thin film strain gauges resulting in both price and performance improvements. As a result resistance strain gauge load cells have now displaced mechanical devices in almost all force standards work.
1.1.1 Force standards
Forces are measured in virtually every field of commerce and engineering. The safety and reliability of many engineering products depends on the accuracy of these
other force measuring devices which are used by industry as secondary standards. The accuracy with which the newton is disseminated is determined by the accuracy of both the NPL force standard machines and these 'transfer standards'.
1.1.2 Transfer standards
The load cells calibrated in the NPL force standard machines are required to fulfil a variety of roles and to transfer the standard of force to various accuracies. The
majority of load cells calibrated are used to verify the servo-hydraulic testing machines used in industry for materials and component testing. These calibrations are generally carried out to the requirements of European standard EN10002-2, the testing machine being classified as being of accuracy class 3, 2, 1, or 0.5.
Higher accuracy is required of those load cells used to verify industrial force standard machines including those machines accredited by the National Measurement
Accreditation Service (NAMAS). These machines range in accuracy from 0.1 % to 0.02%.
The highest accuracy is required of those force transfer standards used by NPL to verify and intercompare the primary force standard machines. These high accuracy strain gauge load cells are used to compare the NPL force standard machines with similar machines in other national standards laboratories, e.g. PTB in Germany, TNO-IWECO in the Netherlands, NIST in the USA etc. (Debnam & Weiringa [1974], Jenkins & Debnam [1982], Knott & Robinson [1990]).
High accuracy strain gauge load cells are also used to verify the NPL hydraulic amplification and strain gauge hydraulic force standard machines using the 'build up' procedure. This involves using three load cells loaded in parallel to calibrate a machine, each of the three load cells having been individually calibrated in a force standard machine of lower capacity. The standard of force is therefore multiplied by a factor of three. This procedure may be repeated with groups of progressively larger load cells to provide further multiplication. By this means the standard of force is transferred up to 30 MN (~3000 tonnes), the capacity of NPL's largest strain gauge hydraulic force standard machine.
Force transfer standards are therefore used under a variety of conditions and provide accuracies ranging from a few percent up to 0.01%. Strain gauge load cells currently provide the most accurate and convenient force transfer standards. Other
technologies under development, such as resonant, SAW, and optical fibre sensors,
IMAGING SERVICES NORTH
Boston Spa, Wetherby West Yorkshire, LS23 7BQ www.bl.uk
BEST COpy AVAILABLE.
show some promise for the future. However, none of these is likely to replace strain gauge technology in the near future.
1.2 Strain gauge load cells
1.2.1 Principle of operation
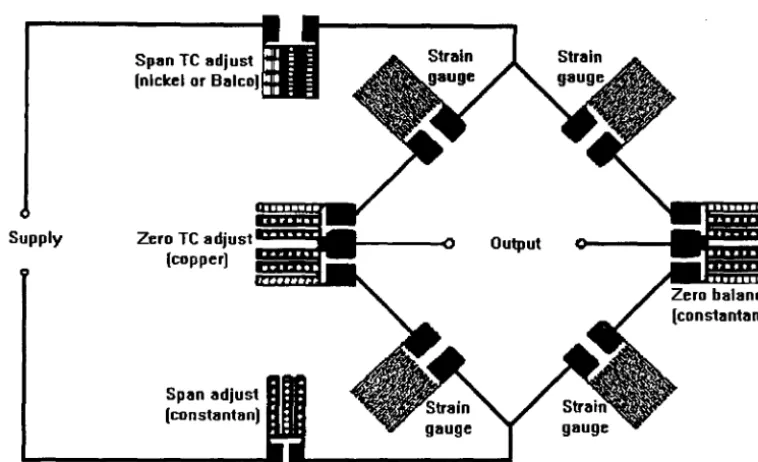
A strain gauge load cell consists of an elastic 'element', usually steel or aluminium, to which a number of etched foil electrical resistance strain gauges are bonded. The strain gauges are usually positioned such that half are subject to tensile strain and half compressive strain. In most commercial load cell designs four gauges (two tenSion, two compression) are used. However in more speCialist high accuracy load cells, eight, sixteen or twenty four gauges are used.
Supply
Span TC adjust (nickel or Balco)
Zero TC adjust (copper)
[image:22.568.93.472.276.507.2]Span adjust (constantan)
Figure 1.1: A typical strain gauge circuit
Figure 1.1 shows a typical load cell circuit diagram. The gauges are arranged in a Wheatstone bridge in order to combine the outputs from the tensile and compressive gauges. The bridge arrangement cancels out most of the temperature induced
resistance changes in the strain gauges. The temperature dependence of the load cell output at zero load is further reduced by an abradab!e or ladder-type copper resistor in one of the bridge comers. This resistor is trimmed to balance the residual
temperature induced zero shift of the circuit. The constantan resistor in the opposite bridge comer is used to adjust the initial zero balance of the circuit. Temperature changes also effect the transducer's span (output under load minus zero load output). This results from temperature dependence of both the Young's modulus of the elastic
element and the gauge factor of the strain gauges. Both of these can be
compensated for by the inclusion of nickel or Balco resistors in the bridge excitation circuit.
1.2.2 Sources of error
If further improvements in the accuracy of strain gauge load cells are to be made the remaining sources of error must be addressed. These include:
Creep and Hysteresis:- Creep is a time-dependent change in the output of a load cell subject to constant force. Hysteresis is a dependence of bridge output on loading history. Two separate sources contribute to a load cell's creep and hysteresis. Firstly the material from which the load cell is manufactured may exhibit both creep and hysteresis. Although load cells are designed to be used we" below their elastic limit, defects in the material microstructure may cause stress concentrations resulting in the elastic limit being loca"y exceeded, leading to plastic behaviour. Secondly the strain gauge glue layer and backing material are both visco-elastic and therefore contribute to creep and hysteresis in the load cell. Hysteresis may also result from variations in the frictional forces at internal and external interfaces in the load path.
Temperature sensitivity:- Although the compensation methods described above dramatically reduce the temperature sensitivity of load cells there is always some residual uncompensated sensitivity. In addition the compensation techniques rely on the load cell being at a uniform temperature. In practice load cells are often subject to temperature gradients which cause temperature errors that are uncompensated.
Sensitivity to parasitic forces:- Under ideal conditions, loads are applied along the axis of the load cell with no additional side loads or bending moments. In a deadweight machine, conditions close to this ideal may be achieved. However, in hydraulic machines the load cell is usually over constrained and sma" but significant side forces and bending moments may arise. The degree to which a load cell is sensitive to these side loads and bending moments is a function of its element geometry and gauge configuration.
Sensitivity to end loading conditions:- In order to measure a force a load cell must be introduced into the load path. Idea"y the load cell should be
both compression and tension load cells are sensitive to variations in the contact stress distribution.
NPL has several research programmes aimed at reducing the above errors. These include the investigation of alternative material types and alternative strain sensing technologies. In addition much work is being carried out on these problems by other national standards laboratories, load cell manufacturers, strain gauge manufacturers and academic institutions. The work described in this thesis involves the investigation of the errors that arise from the end-loading sensitivity of load cells
1.3 Sensitivity to end-loading conditions
Unfortunately, by their nature, errors due to sensitivity to end-loading conditions are often not so readily apparent as creep, hysteresis and temperature errors and as a result are sometimes overlooked by end users. Within calibration laboratories there is much qualitative experience of this problem. However, little work has been carried out to quantify and characterise the effects. The programme of research described here was aimed at gaining an improved understanding of the problem and using this to improve N PL's load cell designs. Due to their different methods of installation the nature of end loading condition errors are different for compression and tension load cells.
1.3.1 Tension load cells
Tension load cells are usually fastened into the machine by means of threaded adaptors, the ends of the load cell being provided with either an internal or external threaded area for this purpose. Tension load cells may be sensitive to some or all of the following:
The depth of thread engagement between the load cell and the adaptors. The rotational alignment between the load cell and the adaptors.
Variations in thread pitch from adaptor to adaptor.
j
All of the above may cause errors if the load cell is used with adaptors other than those with which it was calibrated. Even when the same adaptors are used, errors may still arise unless great care is taken to ensure that each adaptor is screwed to the exact position used during the calibration. As yet EN10002-3 does not contain any test to determine the sensitivity of tension load cells to their end-loading conditions.
1.3.2 Compression load cells
Ideally, loads should be distributed uniformly over the loading surfaces of a
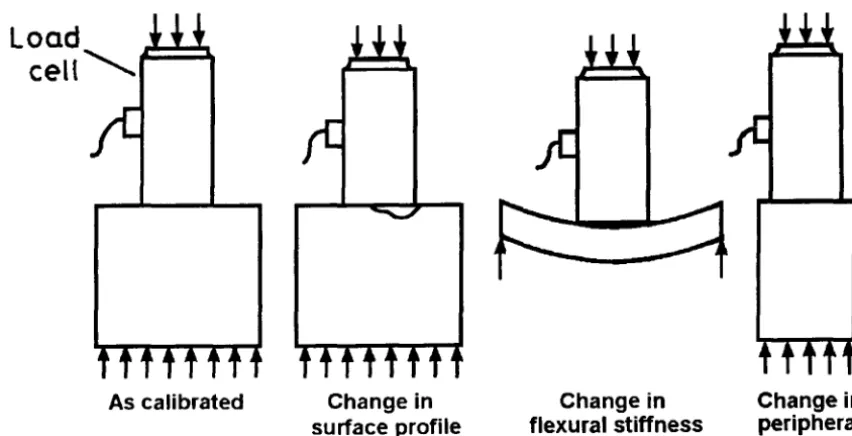
compression load cell. However, in practice, non-uniform load distributions often arise due to combinations of the following (illustrated in figure 1.2):
The loading surfaces of the load cell and of the surfaces they contact may not be perfectly flat. Even if the platen of a materials testing machine is initially ground flat, subsequent use may cause pits, ridges and depressions. Similar problems may occur if the contact surfaces are not perfectly clean, particles of grit causing local areas of high contact stress.
The surfaces in contact with the load cell may deflect non-uniformly under load. Platens of different flexural stiffness undergo different deflections, resulting in variations in the contact stress distributions from platen to platen. Surfaces the load cell contacts may vary in peripheral stiffness. The contact coefficient of friction may also vary from one surface to another. Both these may result in variations in the stresses present at the contact surfaces.
Load
cell "-.
As calibrated Change in surface profile
Change in flexural stiffness
[image:25.564.108.534.372.590.2]Change in peripheral stiffness Figure 1.2: Examples of variation in end-loading conditions
1.3.3 End-loading sensitivity and standards
to be loaded through bearing pads with plane, conically raised and conically
depressed surfaces. The centres of the conical surfaces are respectively raised and depressed by l/lCm th of their radius, an angle of 0.06°. The standard sets limits for
the maximum departure of the output on the depressed and raised surfaces from the output on the plane surface, at the maximum and minimum loads in its calibration range. The limits specified are given in Table 1.1.
Maximum permissible difference Class At minimum force At maximum force
00 0.1 % 0.05%
0.5 0.2 % 0.1 %
1.0 0.4% 0.2 %
2.0 O.S % 0.4 %
Table 1.1: Maximum departures from output on plane surface specified in EN10002-3
An alternative method for testing the end-loading sensitivity of compression load cells is described in German standard, DIN 51301, which was also superseded by
EN10002-3. This 'curvature test' requires the results obtained when loaded on a plane pad to be compared with those obtained when a paper ring or a paper disc are placed between the load cell contact surfaces. The outer diameter of the ring is equal to the diameter of the normal contact surface of the load cell. The inner diameter is SO% of this diameter. The diameter of the disc is 50% of the diameter of the normal contact surface. Paper thickness is to be chosen such that after loading its thickness is approximately 0.1 % of the diameter of the normal contact surface, provided this is greater than 0.1 mm. No limits or guidance on the acceptable variation in sensitivity during this test are given in the standard. Instead the standard states that 'with the aid of the curvature test, statements can be made with regard to the quality of the force-proving device'. The related German standard, DIN 51233, covering the construction of compression testing machines, attempts to reduce end-loading errors by placing limits on the flatness and stiffness of machine platens. The standard states that platens must be flat to 0.03 mm and deflect less than 0.1 mm, both measured over 250 mm.
; .3.4 Load ceils as stress integrators
The output
tP
of an ideal load cell should be a function of the measured force F only -i.e. proportional to the integral of a stress component over a cross-section of the load cell.For column and bar cells this can be expressed:
rjJocF=r
J
u
s a
where u is the axial stress. a
For shear load cells similar ideal behaviour can be expressed:
rjJocF=r u
Js
Swhere ~ is the shear stress.
1.1
1.2
For bending beam and ring load cells the applied force generates a bending moment
M. This moment is measured and related to the applied force:
M If
rjJocF=-=- vu
c
c
~ b 1.3where c is the effective moment arm of the force,
y
is the distance from the neutral axis andu
b is the bending stress.In practice, the above equations do not describe the behaviour of real load cells. Load cell outputs are obtained, not from integrals of stress, but from the combined output of strain gauges mounted on the surface only. Ignoring strain gauge and instrumentation non-linearity, the output can be expressed:
1.4
this approximation of the integral of the axial stress over a cross-section by a sum of surface strains that is the fundamental reason for the sensitivity of load cells to their end-loading conditions.
1.4 Scope of this study
As already discussed there is a wide variety of load cell types in use in many different applications. All types are, to some extent, sensitive to their end-loading conditions. Analysis of the sensitivity of all the many different load cell designs would require more effort than was available for this study. It was decided to limit the scope of this study to column type compression cells, as these are the most important to NPL's force standards work. The object of the work described here was to develop numerical models of the influence of end-loading conditions on column load cells and to use these to evaluate existing designs and develop improved low-profile column load cell element geometries for use as force transfer standards.
1.5
Column load cells
From practical experience NPL and other force standards laboratories have found that if column load cells have a length to diameter ratio (or aspect ratio) greater than 3.5:1 and bridges with four axial and four circumferential gauges, their sensitivity to end-loading conditions is low-enough that they can be used in force standards work. However, there are some test conditions under which it would be an advantage to be able to use load cells of lower aspect ratio.
1.5.1
Requirement for low profile column load cells
Users may require a load cell of low-profile for several reasons. The first is where the working space of the machine to be calibrated is insufficient to accommodate an aspect ratio of 3.5:1. While most modem machines can accommodate such load cells, some older machines have compression spaces of only limited height. One type of machine where this problem is common are the machines used to test the
compressive strength of concrete samples. Most were designed specifically for the purpose and have working volumes just sufficient to accommodate the cubic test pieces. A typical concrete-cube testing machine has a capacity of
3
MN with a working space height of 200 mm. In the past the traceability of the calibration of thesemachines received only little attention. However, recently there has been an increase in construction companies implementing quality systems and seeking NAMAS
accreditation. This has highlighted the problem that, due to their limited working spaces, these machines cannot accommodate column load cells that comply with the
bearing pad test requirements of the EN standard. To replace all the existing machines with new machines with larger working spaces would be extremely expensive. This would be unnecessary if a load cell with a sufficiently low profile capable of complying with EN10002-3 could be developed.
Low aspect-ratios may also be desirable for reasons other than limitations of working space. For example in measuring dynamic or impact loads it is desirable that the lowest natural frequency of a load cell should be much greater than the frequencies being measured. It should therefore be as stiff as possible in all directions. As the stiffness of a column cell is inversely proportional to its height it is desirable that a column load cell for use in dynamic or impact tests should be of a low aspect ratio.
1.5.2 Multi-column designs
One approach to achieving a low-profile load cell of low end-loading sensitivity, is to use a multi-column design. Instead of using a single squat column, several (usually three or four) columns, each of high aspect ratio, are assembled on a common base.
Usually a top pad is supported on the columns and the assembly is enclosed in a case, giving the assembly the external appearance of a very squat load cell. The output bridges of each individual column are connected in parallel to give a single output.
Unfortunately, such multi-column designs have the following disadvantages:
Each of the columns requires similar amounts of machining and gauging to a single column cell. Multi-column load cells are therefore more expensive to manufacture.
For the load cell output to be independent of the distribution of the force between the columns, the sensitivities of the columns must be adjusted to be equal to within a close tolerance. In practice this is difficult to achieve. As a result the load cell may be as sensitive to end-loading conditions as a single column cell.
As a result of these problems, multi-column load cell designs are usually expensive and have not proved to be very successful as low-profile force standards.
1.6
Anoverview of this thesis
This thesis is divided into nine chapters. The contents of each chapter is outlined below:
Chapter 1 - Introduction
This chapter. A general introduction to force measurement, load cells and end-loading sensitivity.
Chapter
2 -
A review of previous workA review of St Venant's principle and previous experimental and numerical work on load cell end-loading sensitivity.
Chapter
3 -
Preliminary analysis of column load cellsAn analytic study of the strain in plane cylinders subject to annular loadings. A relationship between the number of gauges in a load cell bridge and its sensitivity to non axisymmetric loading is also derived.
Chapter
4 -
Experimental measurement of surface strains in cylinderAn experimental study of the strains in a cylinder loaded via contact pads of various profile.
Chapter
5 -
Development of finite element analysis programThe development of a simple axisymmetric finite element program based on the NAG FE library. The results obtained from the program are compared with those from the analytic solution of chapter 3 and the experimental results of chapter 4.
Chapter 6 - Modelling contact
The extension of the finite element program to include infinite elements and frictional contact is described. The results from benchmark tests are compared with other published results. The results are also compared with the experimental results of chapter 4.
Chapter 7 - Automation of the modelling process
An algorithm developed to automatically mesh load cells of arbitrary shape is outlined. Two numerical measures of the insensitivity of load cells to end-loading conditions are also described.
Chapter 8 - Genetic shape optimisation
The implementation of a set of routines for adding genetiC algorithm optimisation to the FE program is described. The performance of the routines is assessed on trial problems.
Chapter 9 - The Darwin load cell
The genetic algorithm/finite element program is used to optimise the geometry of a low-profile 3 MN load cell. A prototype of the resulting 'Darwin' design was
manufactured and tested. The results from these tests are compared with the FE predictions. The performance of the new design is compared with that of a more traditional design.
Chapter 10 - Conclusions and proposals for further work
CHAPTER
2
A REVIEW OF PREVIOUS WORK
2.1 Introduction
Before starting the project a literature search of previous work was carried out using both computer and manual searches of abstracts. For the purposes of the following discussion, previous work has been divided into three categories by approach:-analytic, experimental or numerical, although some work overlaps more than one category.
2.2
Analytic studies
Workers at NPL and elsewhere became aware of the problem of end loading
conditions during work with the first load cells during the 1950s. Since then much work has been carried out to investigate the problem. However, the mathematical study of the effect of contact stresses at distances removed from their pOint of application has a much longer history and as 'Saint-Vena nt's problem' is a classical problem in solid mechanics.
2.2.1 Saint-Venant's Principle
'Saint-Venant's Principle' was originally stated in 1855 by Barre de
Saint-Venant [1855] in connection with the problem of a cylinder deformed by prescribed surface tractions on its plane ends. Boussinesq [1885] introduced a generalised statement of the principle applying to elastic bodies of arbitrary shape. The principle has been summarised as the 'elastic equivalence of equipollant systems of load' (Love. [1927, par. 89]). According to this principle, the strains produced in a body by the application, to a small part of its surface, of a system of forces statically equivalent to zero force and zero couple, are of negligible magnitude at distances that are large compared with the linear dimensions of the part.
A non too rigorous case can be made for the principle using an argument based on conservation of energy (Goodier [1937]). If
P
denotes the order of magnitude of the applied force per unit area,a
a representative linear dimension of the loaded part, andE
the material Young's modulus, the strain components are of the orderpiE
and the relative displacements are of the orderpalE.
The work done in applying the forceis therefore of the order
p2 a3 /
E. A stress of orderp
is associated with strain energies per unit volume of orderp2 /
E. The work done in applying the forces is therefore sufficient only to strain a volume of ordera
3. It is therefore to be expected that the effects of stresses applied over an area should be confined within volumes of the same linear order and should not extend into the 'far field'.
Saint-Venant was not able to prove his principle but offered it as a conjecture. In fact it has been proved that under certain exceptional conditions the theorem does not hold. However, the principle generally applies and in most engineering applications contact stresses can be replaced by their statically equivalent loads when analysing the strength components. Unfortunately in the case of load cell design, where differences of less than 0.1 % in strain levels are significant, Saint-Venant's principle cannot be assumed to apply.
The studies of Saint-Venant and Boussinesq have been discussed above. Much work since then has been directed at formulating and proving more precise general
theorems for 'Saint-Venant' problems. Notably Von Mises [1945] and Sternberg [1958] proved theorems for some related problems. Other workers have developed estimates for the rate of decay of strain energy within elastic bodies of general shape.
Zanaboni [1937] and Goodier [1937] (see above) both utilised energy arguments. Recently, following papers by Toupin [1965] and Knowles [1966], there has been a revival of interest in these energy methods. Hogan and Knowles [1983] give a
comprehensive review (updated by Hogan [1989]) of recent work based upon energy arguments. While this work has had some success in producing upper and lower bounds for the rate of decay of strain energy in general bodies these theories are not yet sufficiently advanced to be of use in predicting rates of decay of strain in bodies of arbitrary shape such as load cells.
2.2.2 Circular cylinders under axisymmetric loading
More pertinent to the present study is the work on the specific problem of circular cylinders. As the simplest form of a column load cell is a circular cylinder gauged around its mid-plane, a general analytic solution for a cylinder loaded on its plane ends would be highly relevant. !t was this problem that was one of the subjects of Saint-Venant's original statement of his principle. While plane cylinders are
Pochhammer [1876], Chree [1886, 1889] and Steklov [1892] using Fourier-Bessel series. Filon [1902] produced a large but incomplete set of solutions for the circular cylinder loaded on its side surface. Prokopov [1948, 1950] obtained a set of homogenous solutions satisfying the equilibrium conditions for an infinite solid cylinder. He went on to demonstrate that many loading conditions could be
approximated by superposition of these homogenous solutions. The most complete analyses of the problem of a cylinder subject to axisymmetric loading over its plane ends have been by Little and Childs [1967], Klemm and Little [1970] and Power and Childs [1971]. Khadem and O'Connor [1969] derived a solution for a circular cylinder compressed between two elastic half spaces. This particular loading condition is very similar to real load cell end-loading conditions.
Other than for trivial load cases, none of the methods reviewed above completely satisfy all the boundary conditions on the side and end surfaces of either infinite or finite cylinders. However, the methods have been shown to be capable of
approximating the state of stress in an axisymmetrically loaded cylinder. All the above works concentrate on analytical methods of solution and present only limited
numerical results. It is unlikely that any of these methods can be extended to model geometries more complex than solid or hollow cylinders.
The only known analytical investigation of a load cell end-loading problem is by Kuipers [1953]. In this study thin walled cylindrical load cells subject to
non-axisymmetric loading were analysed. It was assumed that in a thin walled shell, the stresses and strains are uniform through the wall thickness. Loadings around the rims of the cylinder were approximated as Fourier series in angle and their rates of decay with length calculated. Numerical results were presented for various loading
harmonics and load cell length to diameter ratios. The results presented are valid only for thin walled elements and unfortunately are not likely to represent the behaviour of real load cells which are solid or thick walled.
2.3 Experimental studies
That load distribution has an effect on the output of load cells has been known since the 1950s and was acknowledged by the inclusion of the 'bearing pad test' in the 1964 edition of BS1610. The earliest published experimental works are believed to be those of Rohrbach [1970] and Feucht [1970].
2.3.1 The work of Rohrbach
Rohrbach suggests that the correct transfer of forces into the spring element is the biggest problem in force measurement. He states that the practical application of preCision force transducers breaks down on the fact that strain gauges only determine surface strains, whereas the effective strain is distributed over the entire volume. An experiment is described in which the output of the individual gauges of two cylindrical load cells are compared. Each load cell is a 24 mm diameter cylinder of height 40 mm. Both have plane lower ends and are supported on a plane pad. The upper surface of one is plane while the other has a 30 mm radius spherical upper surface. Both are loaded by a laterally guided upper pad with a plane lower surface. The strain v load curves for the four individual strain gauges of the bridge, together with the bridge output, are given for the two geometries. Rohrbach's results are given in figure 2.1.
F
F
R
=
30 L..,.-,,... AB
c/
o
F
---";;~--B
C ~
1
-E 1.11
-1
I
I
I
~
D
IeI
Figure 2.1: Transfer of force into a cylindrical load cell element (from figure 4 of Rohrbach [1970])
F
F
In a further experiment Rohrbach manufactured a solid load cell with a waisted central section of length to diameter ratio 0.5. The output of the bridge was recorded and compared with the output of the load cell after the waisted section had been extended to length to diameter ratios of 1.0, 2.0. and 4.0. The results are shown in figure 2.2.
%
r
90r-~-+----+---~~--~H
3mm
~
L..--__
--a..---.
... --d---..
1
2
HID
3
O=14mm
d=39mm
Figure
2.2:
Errors due to radial restraint of cylindrical load cell (from figure 5 of Rohrbach [1970])Rohrbach interpreted the results as giving a comparison between the output of cylindrical load cells loaded in the presence and absence of radial slip at their contact surfaces. He concluded that, providing the cylinder has a height to diameter ratio greater than 2, the effect of slip at the contact surfaces would be negligible.
2.3.2 The work of Feucht
In a discussion of a paper by Hild [1970], Feucht presented results of some work on the development of low-profile load cells. He describes some tests on load cells fitted with 'equalising cushions' of yielding materials. In his discussion he refers to previous work by Johansson on annular cylinders. He briefly describes his own work on the use of a layer of yielding material as a means of equalising the distribution of stress over the ends of a load cell. He reports that he has experimented with cardboard,
'Klingerite', rubber, 'Dekaplast', lead and in addition rubber bags filled with glycerine. He also gives a brief summary of a test using rubber 'cushions'. He states that a full
account of this work is to be published later. Extensive literature searches have unfortunately failed to tum up reference to either this work or to the previous work of Johansson.
Freucht briefly describes a series of tests using a 100 kN cylindrical steel load cell 130 mm diameter and 140 mm high (aspect ratio 1.08). A thin layer of rubber was
sandwiched between each end of the load cell and special end-caps. The end-caps incorporated seals to contain the pressure generated in the rubber 'cushion'. In order to maintain stability of the assembly, the top and bottom platens of the testing
machine were linked by rigid lateral guides. Freucht assumed that this loading condition provided a uniform distribution of axial stress over the ends of the load cell. The output of the load cell bridge under this 'ideal' loading condition was used as a reference to compare the load cell output when loaded via three less ideal end-loading conditions. The first condition was the common one of end-loading between two large plane plates without any cushion. He found that the output in this case was 2% lower than the reference loading condition. When subject to annular loads applied at 43% and 78% of the load cell radius, the load cell showed, respectively, a 3.5% decrease and a 3% increases in output relative to the reference case. Feucht's results are shown in figure 2.3.
3
fJ/o
JL2
A1OO11p1
t
o
~
p Load case:, CD
Annular load, no cushIon~d--I
dID
=
78%
--
-D -
.
...-:;..--~",. ...
t i t
~III
10
20
@
P-~""~
®
....
--I
d. I-
"Anmdar load,-, no cushion
o
.
d/O=43%
,
,
3()
40
50
flJ
- Mean applied stress
P
,
,
....
...
' ...
...
...
...
...
...
Unfortunately although he states that he has carried out tests to determine the equalisation effect of the rubber cushions under six different annular loadings, he provided no results in the discussion. He also gave no details of the tests using materials other than rubber only making a general statement that the use of cushion materials caused problems of mechanical stability and that hard plastics and metals did not look promising at high loads. One important observation made by Feucht is that there is a relationship between sensitivity to end-loading conditions and
hysteresis. Figure 2.3 shows that changing the end-loading conditions changes the load cell hysteresis as well as its sensitivity.
2.3.3 The work of Debnam
&Jenkins
Debnam & Jenkins [1972] of NPL carried out an experimental study of the influence of end-loading conditions on load cells using four load cells chosen to be of different mechanical construction. The designs chosen were:
1. An NPL manufactured octagonal strain gauged billet without any protective case.
2.
A commercially made four column load cell, each column having a square section.3. A commercially made single column load cell, with a solid cylindrical billet, supported at its top end by a diaphragm which attached to its outer case. 4. A commercially made single column load cell, with an octagonal hollow
billet.
Cell No.1 Cell No.2 Cell No.3 Cell No.4
Figure 2.4: The four load cell designs tested by Debnam & Jenkins [1972]
The four load cells are illustrated in figure 2.4. The designs were representative of the range of compression load cells in use in 1972. The four designs were tested on conically raised and conically depressed pads as well as on flat pads of varying hardness.
Difference from average result for the flat pad, hardness 540 HV
Lower loading pad Load cell Load cell Load cell Load cell
No.1 No.2 No.3 No.4
Flat, hardnesss 270 HV +0.002% -0.011% -0.025% +0.005% Conically depressed by 1: 1 000 +0.002% +0.004% -0.306% +0.039%
hardness 540HV
Conically raised by 1: 1 000 +0.005% +0.069% +0.290% -0.059% hardness 540HV
Table 2.1: Debnam & Jenkins' results for four load cells of different design
It was found that variation of the profile of the contact surface of the loading pad had a much greater effect on load cell output than variation in the hardness of the material from which it was constructed. It was noted that the simple N PL octagonal billet (aspect ratio 3.7) performed significantly better then the commercial designs. Their results are presented in table 2.1. Further observations on the end-loading effect in load cells, including a discussion of the above results, are given in Jenkins [1979]
2.3.4 The work of
BrayBray [1972] used photo-elastic and strain gauge techniques to investigate the effect of end-loading conditions on cylindrical load cells. In this study epoxy cylinders of various aspect ratios were loaded on pads made of various materials, profiles and surface finishes. The results in the study suffered from the problems of making strain gauge measurements on epoxy without introducing errors due to self-heating.
Although pulsed voltage instrumentation was used, the results show poor
In addition to the studies summarised here, some experimental work has been carried out in order to verify the results from numerical models. Such work is summarised with the relevant numerical work in the next section.
2.4 Numerical studies
Numerical modelling of the performance of load cell billets has been based exclusively on the finite element (FE) method. No studies based on boundary element or other numerical methods were found.
Finite element analysis of load cells has been reported by many authors e.g. Barbato et al. [1980], Abdullah & Erdem [1978], Abdullah & Li [1983], Stefanescu [1988], Leinonen [1988, 1989]. Most of these studies have been to determine characteristics of load cells other than their end-loading sensitivity. The literature search revealed only three FE studies which address the end-loading problem for column load cells.
2.4.1 The work of Mitchell et al.
Mitchell et al. [1971] report an experimental and numerical study of a 3.6 MN
(800,000 Ibf) column load cell. The design was typical of many column cells, having a waisted central section and a domed loading cap (figure 2.5).
Chapter 2
:!.-_-;.-.:.-... .::. _____ CONTACT RAD IUS: DAO in
(t02cm)
Figure
2.5:
Load cell loading arrangement (from figure6
of Mitchell et al. [1971])A finite element model of the load cell element was constructed using three node triangular elements. The surface strains were evaluated using the FE programme for several loading conditions. In order to verify the FE results, a total of 54 strain gauges were applied to the load cell billet, aligned in both the axial and circumferential
directions. The billet was loaded when supported via four rings of mean radius 17%, 33%, 67%, and 96% of the radius of the lower loading surface.
a.00078
o.oocn
QOOO Z
;(
'"
0-'"
QOOO,",
0.00074
0DC073 6
IICIIQ!!. IQ6(;!lrKi K6/AI~
0 0.40in (t02 em) 'V 0.71' in (2.olc .. ) Cl 1.58 in ( ... 01 em) <> 2.27in (5.77"",)
~n~
______
~______
~________
~______
~__ _
2
•
in<hn HEIGHT ABOY" BOTTOM
5 6
Figure 2.6: Axial surface strains over central section (from figure 8 of Mitchell et al. [1971)
The degree of agreement shown between the two methods, even allowing for the imposed agreement at the centre, confirms the finite element method to be useful in analysing the behaviour of load cells under various end-loading conditions.
2.4.2 The work of Sundin
&
Jonsson
Sundin & Jonsson [1985] used FE methods to develop a low profile load cell for measuring impact forces. It was desired that the load cell should have a squat form in order to maximise its stiffness and consequently its lowest natural frequency. The transducer design was unusual in that it relied on measuring circumferential strain only. Four turns of resistance wire were wrapped around the steel element and formed the active arm of a ~ Wheatstone bridge. The stepped cylinder design of the load cell elastic element is shown in figure 2.7.
hlH 1
0.8
0.6
0.4
r:
H
!
Ui
- - - I l = a >
---IJ.= 0
0.5
to
Figure 2.7: Variation of load cell sensitivity with step position (from figure 3 of Sundin & Jonsson [1985])
l
Also shown in figure 2.7 are the results of FE analyses carried out to determine the influence of the position of the step change in radius on the end-loading sensitivity. The analysis determined the circumferential strain in the resistance wire for various annular load radii and step heights. The results show that there is a value (h=O.585 H) for which the load cell sensitivity is a minimum. The authors manufactured a
transducer of this geometry and tested it under different radial load distributions. The
experimental results demonstrated that this high natural frequency transducer exhibited the predicted low sensitivity to end-loading variations. While other papers have described the use of FE methods in analysing the performance of existing designs, Sundin & Jonsson's work is the only example known to the author of an FE method being used to develop a force transducer with reduced end-loading sensitivity.
2.4.3 The work of Williams
Williams [1983] of NPL carried out a finite element analysis of a semi-infinite plane cylinder subject to annular loads at various radii. Each load case was a compressive annular load superimposed on an equal uniform tensile load (figure 2.8). The
difference between the strains for an annular load and a uniform distributed load are therefore calculated directly.
--,,1---~
;...----
...
4
-- 4 -- -- -- -- L --_ _ _ _ _ _ _ _ _ _ _ _ _ _ _ _ _ _ _ _ _ _ _ _ _ ~
...
z
Figure 2.8: The problem analysed by Williams
The surface strains in the cylinder were plotted against distance from the loaded end. It was assumed that the results from a semi-infinite cylinder can be applied to finite cylinders with negligible error. (In chapter 3 this assumption will be shown to be correct.) Williams determined the axial and circumferential components of strain and used these results to predict the output of a full strain gauge bridge bonded at mid-height on cylinders of various aspect ratios. Bridge outputs were calculated for aspect ratios from 1.5 to 4.0. Williams' results are shown in figure 2.9.
.02
Poisson
ratio: 0.25
XI = 0 ---
Xt =.2
- " - X, =.4 -
- - X, =.6
.01
- ' - Xt=.8 - " ' - X t = 1
-·01
/
.''-.02 '--_ _ _
... _ _ _
----1'--_ _ _ ... _ _ _ ---1. _ _ _ - - - 11.5
2.0
2.5
3.0
3·5
4.0
z/ro
Figure 2.9: Fractional difference in bridge output with load radius (from figure 3.3 of Williams)
2.5 Conclusions
The works described above have adopted three alternate approaches to the analysis of end-loading sensitivity. Much work has been carried out on analytic solutions of simple geometries. However there is little prospect of extending these analytic methods to give useful results for more complex geometries. Experimental work has demonstrated the influence of load cell shape on its end-loading sensitivity, and has highlighted the relationship between a column load cell's aspect ratio and its
end-loading sensitivity and hysteresis. Numerical techniques have been shown to agree with experimental strain measurements and in one case FE analysis has been used to develop a load cell geometry with reduced sensitivity to end-loading
conditions.
The works reviewed above confirm that, in general, end-loading sensitivity can be reduced by maximising the load cell aspect ratio. However, the works of both Sundin & Johnson and Williams have indicated that the dependence of end-loading sensitivity on aspect ratio is complex. There may therefore be potential to exploit the
CHAPTER 3
PRELIMINARY ANALYSIS OF COLUMN LOAD CELLS
3.1 Introduction
The study by Williams has been described in the previous chapter. This FE study indicated that the behaviour of cylindrical load cells of aspect ratio below 1.5 may be more complex than previously assumed. The eventual aim of this study was to
develop finite element models of load cells of general axisymmetric shape. For such a FE model to be useful, the accuracy of its results must be demonstrated. In this
chapter, numerical results from an analytic solution of the problem of a cylinder loaded over an annulus will be presented. In later chapters, these results will be used to validate the finite element model. Before presenting the analytic results, consideration will be given to the response of axisymmetric load cells to general stress distributions.
3.2 Axisymmetric column load cells subject to general stress
distributions
ocr
.8)
z
Figure 3.1: Column load cell subject to general stress distribution
Consider an axisymmetric column load cell with a bridge composed of a number of axial and circumferential strain gauges equispaced around its circumference. We may represent an arbitrary stress distribution over one of its ends as a combination of