Copyright©1972 AmericanSociety for Microbiology
Simian Virus 40
Deoxyribonucleic
Acid
Synthesis:
Analysis by
Gel
Electrophoresis
PETER TEGTMEYER AND FRANCISCO MACASAET
Department ofPharmacology, Case Western Reserve University, Cleveland, Ohio, 44106
Received forpublication5July1972
An agarose-gel electrophoresis technique has been developed to study simian
virus 40
deoxyribonucleic
acid (DNA) synthesis. Superhelical DNA I, relaxedDNA II, and replicative intermediate (RI) molecules were clearly resolved from
one anotherfor analytical purposes. Moreover, the RI molecules could be
identi-fied as early or late forms on the basis of theirelectrophoretic migration in
rela-tion to that ofDNA II. The techniquehas been utilizedto study the kinetics of
simian virus 40 DNA synthesis in pulse and in pulse-chase experiments. The
averagetimerequiredtocomplete the replication ofprelabeled RI moleculesandto convert them into DNA I was approximately 10min undertheexperimental
con-ditionsemployed.
Simian virus 40
(SV40) deoxyribonucleic
acid(DNA) molecules have been studied by a
combi-nation oftechniques including dye
buoyant-den-sity
centrifugation,
velocity sedimentation, andelectronmicroscopy(1, 3, 8, 9, 12). Virion
parti-cles have been shown to contain superhelical
molecules (DNA I) which may be converted to
relaxed molecules (DNA II) by a single-strand
break (3). Cells infected by SV40 also contain a
viral
replicative intermediate
(RI) which has bothsuperhelical and relaxed regions (8, 12) and
polymeric forms of viralDNA (7). However,no
single technique has been utilized to clearly
dis-tinguish between the various forms of SV40 DNA
andtodetermine thedegree ofreplication of RI
molecules. Thorne has shown that the
super-helical and relaxed DNAof polyoma virus could
be resolved by electrophoresis through an agar
gel (14). Thepresentcommunication describes the
separation of the SV40DNAI, DNA II,and RI
moleculesatdifferent stagesofreplication witha
high degree ofresolution by a simple gel
elec-trophoresis technique. In addition, the kinetics of
the formation and processing of RI molecules
wereinvestigated.
MATERIALS AND METHODS
Cellculture. Africangreenmonkey kidney cell line AH (5)wascultivatedinF12medium containing2to
10%fetalcalfserum (FCS).
Virus.SV40strain WT (13), aclonedsmall-plaque
strain,wasusedfor allexperiments. Virus stockswere
prepared from cell lineAH monolayers inoculatedat
a multiplicity of 0.01 plaque-forming units (PFU)/ cell andplaque-assayed aspreviously described (13).
Infection of cells. AH monolayers grown to con-fluence in8-or32-o(45-or150-cm2 cellgrowing areas) prescription bottles were inoculated with 1.0 ml of
stock virusatamultiplicityof 10PFU/cell.After the
virus was allowed to adsorbto the cells for 2hr at
room temperature, the inoculum was replaced with
medium and the cells were incubated at 39 C.
Radioactive labeling of infected cells. After incuba-tion of the infected cultures for 48 hr, the mediumwas
aspirated, and4ml ofprewarmed medium containing
50to100,Ciof3H-thymidine (New England Nuclear Corp., Boston, Mass.; 15to20Ci7mmole) permlwas
addedtoeach culturebottle whichwasthen incubated underwaterattheappropriatetemperature.Atthe end of thepulse period, the culture bottles wererapidly
filled withaprechilled, 4 C solution of 0.137MNaCl,
0.005 M KCI, 0.01 M tris(hydroxymethyl)amino-methane (Tris) buffer, 0.001 M Na2HPO4, pH 7.4 (TBS). Thecell monolayer was further washedonce
with 10 ml of cold TBS before extraction. In
pulse-chase experiments, the medium containing isotope wasreplaced with prewarmed Hanks salt solution
con-taining 2% FCS andanexcessofunlabeled thymidine (100 Mg/ml). Under these conditions, the addition of 10 ,ug ofdeoxycytidine/ml tothechase medium (11)
did not alter the efficiency of the chase and was,
therefore, not utilized. After the appropriate time
period, the chase was rapidly terminated by the samemethoddescribed above fortermination of the
pulse.
Extraction of DNAfrom infected cells.Viral DNA
was selectively extracted from the infected cells as
describedbyHirt (6). Monolayers werelysed by 0.8 mlofasolution containing 0.01 MTris,0.01M
ethyl-enediaminetetraacetate (EDTA) and 0.6% sodium
dodecyl sulfate, pH 7.4, for 20minatroom tempera-ture. A 0.2-ml amountof5MNaClwas thenadded,
andthebottlewasgentlyinverted 10times.The mix-ture was poured intoa polyallomer centrifuge tube, 599
PrintedInU.S.A.
on November 10, 2019 by guest
http://jvi.asm.org/
stored at 4 Covernight, and thencentrifugedat4 Cfor 20min at 16,500rev/min in a Spinco SW65rotor.The supernatant fluid was dialyzed overnight in 0.01 M Tris and 0.01 M EDTA, pH 7.4. Thedialyzed super-natantfluid isreferred to as theHirtsupernatantfluid. Purification of SV40 virions and preparation of marker DNA. Stocksofvirus were grown in the pres-enceof 2MuCiof 14C-thymidine per ml. The virus in the medium was concentrated by polyethyleneglycoland isolated by isopycnic centrifugation in CsCl by the method ofFriedmann and Haas (4). DNA was ex-tractedfrom thepurifiedvirions by phenolcontaining 0.01 M Tris and 0.01M EDTA (pH 7.4). The aqueous phase wasdialyzed overnightat 4 Cagainst TBS.
Deoxyribonuclease treatment. Bovine pancreatic
deoxyribonuclease (electrophoreticallypure) was
ob-tained from Worthington Biochemical Corp. A 1-,ug amountof DNA extracted frompurified virions was
exposed for 10 min at 37 C to 0.02Kunitz units of
deoxyribonucleasein 0.2 ml of TBS (pH 7.4)
contain-ing0.001 M MgCl2 and 0.001 M
CaCI2.
The reactionwasstopped byaddinganequal volumeof 4 C TBS
containing0.1 M EDTA.
Velocity sedimentation. Samples (0.1 ml) were
layeredonto 3mlof CsCl (p = 1.50 to 1.52g/cm3)in
0.01 MTris and 0.01 M EDTA, pH7.4, covered with 1mlof mineraloil,andcentrifugedat25Cfor 3.5 hr
at35,000rev/mininaSpinco SW65 rotor. Fractions (0.08 ml) weredrop collected, precipitated with 5%
trichloroaceticacid in the presence of 20
Mtg
ofcarrieryeast ribonucleic acid, collected on nitrocellulose
filters,andassayedfor radioactivity inTriton-toluene
(10)byliquidscintillationcounting.
Dye buoyant-density centrifugation. Ethidium
bromide (EB)andCsClwereaddedtotheHirt
super-natantfluid to give a final concentration of 200
Mug
ofEB/ml and a final density of 1.560 g/cm3. Samples
(4 ml) werecentrifuged in a Spinco SW65 rotor at
40,000rev/minfor 65 hrat4 C. Fractions (0.06ml)
werecollectedfrom the bottom of the tubes. A10-Mliter
portionof eachfractionwasassayed forradioactivity
on Whatman 3-mm filter discs by the method of Bollum (2). The fractions ofinterest were dialyzed
overnightat4 Cagainst0.01 MTris and 0.01 M EDTA,
pH 7.4.
Preparation of agarose gels. The appropriate
con-centrations (weight/volume) of agarose (Seakem)
were autoclaved in electrophoresis buffer containing 0.036 MTris, 0.03 M NaH2PO4, and 0.001 M EDTA (pH7.5). The sterile agarose solutionwasdivided into
portionsandstoredatroomtemperatureforaslongas
1 yearwithout change inelectrophoresis characteris-tics. For use, the agarose wasliquified in a
boiling-waterbath, cooledto45C, and distributed to 8-cm
acrylictubes(0.6-cminternaldiameter). The gel tubes
werecooledfor30minatroomtemperature, and the top1-cmportionof the gel was removed with a scalpel blade. The tubes were then covered at the bottom
withwetdialysis tubingandimmediatelymountedin
theelectrophoresis apparatus (Model 70, Biox, West
Lafayette, Ind.) toprevent drying of the gels. Electrophoresis procedure. For electrophoresis, sodiumdodecylsulfate (SDS) was added to the elec-trophoresis buffer to a concentration of 0.2 g/100ml.
Thegeltubesweresubjectedtopre-electrophoresis in the SDS bufferatroomtemperature for 30 minat a
potential of 10v/tube (power source: model3-1014A, Buchler Instruments, Fort Lee, N.J.). Hirt super-natant fluid DNA samples (100Mlliters) were mixed with 50 Mliters of electrophoresis buffer containing 30% sucrose and 0.6% SDS and were warmed at 37 C for5 min.Samples (100,liters) wereloaded into the top of thegel tubes and subjectedtoelectrophoresisas
described in eachexperiment. The maximumquantity ofDNA added to agel tube in the experiments to be describedwas 10Mg.
Analysis of gels. After electrophoresis, the gelswere
eitheranalyzed immediately or stored at 4 C, foras
long as 1 week, with similar results.Coolingwasfound tofacilitateslicing of the gels. The gels were sliced into 2.5-mm discs which wereplaced into scintillation vials containing 10 ml of a Triton-toluene mixture (666 ml oftoluene, 333 ml of Triton X-100, 0.25 g of
dimethyl-1,4-bis-2-(5-phenyloxazolyl)benzene,and 8.25 g of
2,5-diphenyloxazole, Packard Instrument Co., Downers Grove, Ill.). The counting efficiency for 3H-labeled DNAsamples in the gel slices was less than 1% after 1 hr in the Triton-toluene mixture, but increased to stable levels of 15 to 20% after 2 days in the scintilla-tionfluid at room temperature. During this two-day period, the opaque gel slicesgradually became almost completely clear. More than 99% of 3H-labeled SV40 DNA remained within thegel slices after 1 month in thescintillation fluid as determined bytransferring the gel slice to a scintillation vial containing no Triton-toluene mixture and recounting the sample. The same procedureindicated that the scintillating events were actually occurring within the gel slice itself rather than in thetotalvolume of theTriton-toluene mixture. The counting efficiency of 3H-labeled DNA I samples in gelswhich had beendissolvedin 0.2mlof 30% H202 for 12 hrat70Cbefore mixture with 10 ml of Triton-toluene was approximately 20%. For
convenience,
samples were routinely assayed in intact gel slices.
Radioactivity of thesampleswas assayedinaliquid
scintillation spectrometer (series 720,Nuclear-Chicago Corp., Des Plaines, Ill.). Quench corrections were made by thechannels ratio method. Reconstruction experiments indicated thatsamplescounted in intact ordissolved gels fit similar quench correlation curves.
RESULTS
Electrophoresis of DNA extracted from virions.
SV40 DNA labeled with
'4C-thymidine
wasex-tracted from purified virions as described in
Materials and Methods. DNAsamples, with and
without
deoxyribonuclease
treatment, weresub-jectedto
electrophoresis
through 2% agarosegels
as described in Fig. 1. Untreated virion-derived
DNA migrated as a large, sharp, leading peak
(DNA I) and as asmaller, trailing peak (DNA II).
No
heterogeneity
of either peak was observedevenwhen thegels weresliced at 1-mm intervals.
No other DNA was observed on gels twice the
length illustrated here. Controlled
deoxyribo-nucleasetreatment
converted
DNA I into DNAon November 10, 2019 by guest
http://jvi.asm.org/
12
10
8
.-%6
'
4
2
C)
C.)
8
6
4
2
1
2
3
4
5
DISTANCE
MIGRATED
(CM)
FIG. 1. Gelelectrophoresisof SV40DNA IandII. DNA was extractedfrom purified SV40 virions and treated with deoxyribonuclease as described in Ma-terials and Methods. DNA samples suspended in loading buffercontaining 10% sucrose weresubjected
to electrophoresis for 2.5 hr through 2% agarose at
10 v/gel. Migration is from left (-) to right (+).
Thegelswere sliced andanalyzedasdescribed in Ma-terials and Methods. A, Untreated SV40 DNA; B, SV40 DNA treated with
deoxyribonuclease.
II. The untreated
'4C-labeled
DNA wasused
asmarker
DNAin theremaining experiments.
Electrophoresis
ofSV40
RI.To
examine
theelectrophoretic
behavior of SV40
RI,
AHcells
were
labeled for 10
minwith
3H-thymidine
(100
,uCi/ml)
48hr after
inoculation with SV40. The
viral DNA
wasselectively
extracted and
examined
by
avariety of techniques
(Fig.
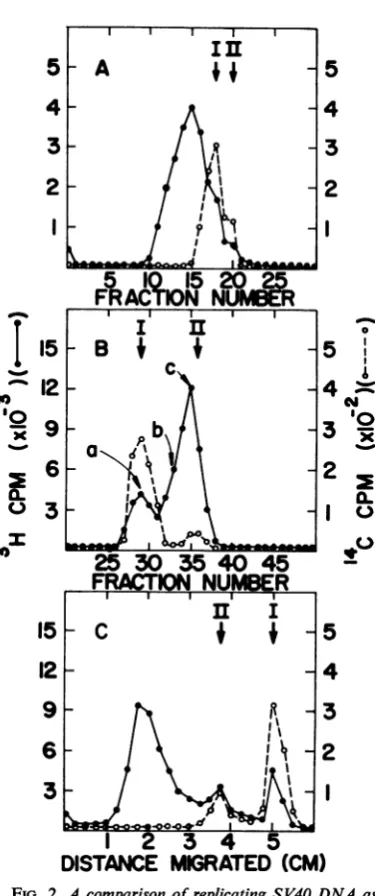
2). Velocity
sedi-mentation
analysis (Fig.
2A) showed
that mostof thenewly
synthesized viral
DNAsedimented
asabroad peak ahead of marker
DNA Iand II,
aspreviously
described by others
(8, 9,12).
Dyebuoyant-density centrifugation (Fig.
2B) showed
a
banding
ofviral
DNA atheterogeneous
densi-ties
between thedensities
corresponding
tomarker
DNA Iand
II,
asalsopreviously demonstrated
byothers
(8,
12). Gel electrophoresis
(Fig.
2C)of the
same
sample clearly resolved
theDNA Iand
IIpeaks.
Mostof
thenewly labeled viral
DNAmigrated
moreslowly
than DNA II. Thetrailing
edge of this broad peak declined
sharply,
whereas theleading
edge
gradually
extended through
theDNA II
peak
to the base of the DNA Ipeak.
Although
the DNA I,II,
and
RIpeaks
overlapped
5
4
3
2
1U
03
'5
12
9
6
3
5
4
3
2
10
5
:
1
1~
4s,
3
2
°
2
2
I
0*0
5
4
3
2
DISTANCE MIGRATED
(CM)
FIG. 2. Acomparison of replicatingSV40 DNA as analyzed by velocity sedimentation, dye buoyant-density centrifugation, and gel electrophoresis. Cell line AH monolayers in 32-ounce(ca. 150cm2) bottles were inoculated with 10 PFU/cell, and 48 hours after infection at 39 C they were exposed to 100 ACi of 3H-thymidine per ml for 10 min. The Hirt supernatantfluidwasanalyzed by velocity
sedimenta-tion inneutralCsCl (A), dye buoyant-density centrifu-gation (B), andelectrophoresis through 1.5% agarose
for2hrat 10 v/gel (C).See Materials andMethods
for details of the techniques. Centrifugation fractions
werecollectedfrom the bottom of the tubesand num-beredintheorderof collection.
on November 10, 2019 by guest
http://jvi.asm.org/
[image:3.495.65.213.55.306.2] [image:3.495.252.440.64.513.2]tosome extent,an accurate estimateofthe relative
quantity ofisotope incorporated into each ofthe
three forms of viralDNAcouldeasilybe made on
the basis of this
single procedure.
Inparallel
ex-periments,
uninfected AH culturesproduced
nodetectable
DNA whichmigrated
into thegels. Tofurther
correlate
thebehavior
of viral DNA indye
buoyant-density
centrifugation
and
gel
elec-trophoresis,
relevant
fractions from thedensity
gradient
weredialyzed
andsubjected
toelectro-phoresis
(Fig.
3).
Fraction a(Fig.
2B),
cor-responding to
superhelical
DNA inthe EB-CsClgradient, comigrated throughanagarose
gel
withmarker DNA Ifor the most part.
However,
thefraction also
contained
3H-DNAwhich
migrated
somewhat more
slowly
than DNA I. This DNAprobably
represented
RImolecules
early
inthe
replication
processwhich
were notcompletely
resolved from
DNA I in thegradient
fractionexamined. Fraction
b(Fig.
2B)
of
thegradient,
corresponding
toRImolecules intermediate in thereplication
process(8,
12),
migrated
to aninter-mediate position
in the areaof
the agarosegel
representing
RImolecules. Fraction
c(Fig.
2B)
of
thegradient,
corresponding
to RI moleculeslate in the process
of
replication
and to anun-determined
portion of DNAII(8, 12),
migrated
as a
small, sharp
peak
of DNA II andalarge
well-defined
peak of
RImolecules
clearly behind
DNAII on the
gel. Thus,
thegel
technique separated
RImolecules
invarious
stages ofreplication.
Inaddition,
DNA IIcould
easily
be identifiedas asmall,
butwell-defined,
peak
superimposed
on a flatportion of
thebroad,
RIpeak.
When
infected
cells
werefirst
pulsed for
10 min with3H-thymidine
and
then weresubsequently
chased
for
1 hr withan excessof unlabeled
thymi-dine,
most of thenewly synthesized
DNA waspresentinformIDNAas
determined
by all three
methods. A
small
remainingpeak
corresponding
to RI DNA
could be identified
by
gel
electro-phoresis
analysis
(Fig. 4).
Studiesby
others haveshown that
3H-labeled
DNA I may reenter thereplicating pool
as theparental
strandsof
repli-cating molecules
(8,
12).
Thus,
achasewould
notbeexpectedtobe
complete.
Replicative intermediate DNA was
also
examined
by
electrophoresis through
agarosegels
of
varying
concentrations. Atanagaroseconcen-tration
of
0.5%, all formsof viral
DNAmigrated
as a
single peak.
Ata1.0%
concentration,
formsIand II were
poorly resolved
from each other butcould be
distinguished
from RI. Ata2%concen-tration,
RIdid
notcompletely
enterthegel
under theconditions of electrophoresis,
but DNAIand IIwerewellseparated.
KineticsofviralRIsynthesis. Thehigh degree of
resolution of DNA 1,
11,
and RI by a single2
I
%-O-%
x
CL)
30
2
4
2
5
4
3
2
v
5 '
1
4
N
3
so
2
a.)
I
05
4
3
2
1
2
3
4
5
[image:4.495.264.457.67.480.2]DISTANCE MIGRATED (CM)
FIG. 3. Electrophoresis offractions a, b, and c from the dye buoyant-density centrifugation as indicated
inFig. 2B. Eachfraction was dialyzed against 0.01 M
Tris and 0.01 M ED TA, pH 7.4. A portion of the dialyzed fractions was subjected to electrophoresis through1.5%agarose at 10v/gelfor 2 hr.A, Fraction a from Fig. 2B; B, fraction b from Fig. 2B; and C, fractioncfrom Fig. 2B.
technique provided a means to measure
accu-rately
the rate of synthesis of RI. AH monolayers wereinfected
at aninput multiplicity of 10PFU/
cell and
labeled
with3H-thymidine
for varyingperiods of
time 48 hr after infection. The viralDNA in the Hirt supernatant fluid was
examined
by
gel electrophoresis
(Fig. 5). With an increasingduration of
thepulse period up to 40min, thereon November 10, 2019 by guest
http://jvi.asm.org/
6-
-~~~2
3-1 2 3 4 5
DISTANCE
MIGRATED
(CM)
FIG. 4. Gel electrophoresis ofSV40 DNA after a 3H-thymidine pulse and a 1-hr chase. Cell line AH monolayers in 32-ounce (ca 150 cm2) bottles were inoculated with 10PFU/cell,and 48 hrafterinfection
at39 C they were exposed to 100pCi of 3H-thymidine per ml for 10 min at 39 C and subsequently were chased with an excess ofunlabeled thymidine for 60 min. The Hirt supernatant fluid was subjected to electro-phoresisthrough 1.5%agarosefor2hrat10v/gel.
b
12
o
12
3
4
03
DISTANCE
MIGRATED (CM)
Fio. 5.Compositediagram of the gelelectrophoresis patterns of replicating SV40 DNA extracted from infected cells after exposure to 3H-thymidinefor
in-creasingperiods oftime. Cell line AHmonolayers in
8-ounce (ca 45 cm2) bottles were inoculated with 10
PFU/cellandincubatedat39 Cfor48 hr. Thecultures
were labeled with medium containing 50
pACi
of 3H-thymidine per mlforperiods of from 5 to 20 min.Hirt supernatant fractions were subjected to electro-phoresis through 1.5% agarosefor 2 hrat 10 v/gel. The numbers in thefigure indicate the length ofthe
labeling periodinminutes.
was a
concomitant increase
in thequantity
of
RI.However,
theshape
of the RIpeak,
asdeterminedby
gel
electrophoresis,
wasdifferent
depending
on theduration of
thepulse period
(Fig. 5).
Aftera5-min
pulse,
most of the3H-labeled
DNA waspresent in the
region
of
thegel
which
waspre-viously
showntocorrespond
tothelocation of
RImolecules intermediate
inthereplication
process. Incontrast, after
apulse
of 10minorlonger,
RImolecules
late in the process ofreplication
con-tained
mostof the
radiolabel. The shift
of3H-DNA
tothelate
region of the
RI peakprobably
coincided
withthe
averagetime
period required
tolabel
anewly
replicated
strandof
maximallength.
The continued
increase
inthe
quantity of3H-DNA in the RI region of the gel observed in
pulses longer
than 10 mincould be
explained,
inpart,
as areutilization of
recently
labeled
3H-DNA
Imolecules
asthe
parental strands ofnewly
initiated
RImolecules
andpossibly
asaresult ofa
depletion
ofendogenous thymidine
pools.
Processing
of RI molecules.Pulse-chase
experi-mentswere
utilized
tostudy
the rate atwhich RI
molecules
werecompleted
andconverted
into
DNA I.
Infected
AHcells were pulse-labeledwith
3H-thymidine
for
5min.
Theincorporated label
was then
chased
with an excessof
unlabeled
thymidine for varying
periodsof
time (Fig. 6). RIdisappeared
rapidly during
thefirst
10minof
thechase witha
reciprocal
increase
inDNA
I.There-after,
the conversion of RIinto DNA
Iappeared
tooccurat amuch
slower
rate.When the
length
of the
initial
pulse
period
wasvaried,
theefficiency
ofthe
chase, but
not thekinetics
ofthechase,
depended
on thelength of
thepreceding
pulse
(Fig. 7).
The rapid phase of the chase hasbeen
interpreted
toparallel the completion
ofreplica-tion
of
thenewprogenystrands of RImolecules,
whereas
the slowphase
of the chasereflected,
inpart, the
continued
reutilization
ofprelabeled
DNA Iasthe parentalstrands of newly
initiated
3
10
so
x go
2
TOTAL
DNA
I
IXR
IAI
DN
I,~~~~~~~~~~~~
10
20
30
40
CHASE
TIME
(MIN)
FIG. 6. Kinetics of processing of 3H-thymidine-labeled SV40 DNA during chase periodsoffrom 0 to
40 minutes.Cell line AH cultures in 8-ounce(ca 45 cm') bottles were infected andpulse labeledfor 5 min as
described in Fig.5. At the end of thepulse, the medium containing 3H-thymidinewasreplaced with medium
con-taining an excess ofunlabeled thymidine. DNA was
extractedfrom the cultures and analyzed by gel electro-phoresisasdescribed in Fig.5. The total counts/min of
the S V40 DNAcomponentswereplotted above.
603
I
on November 10, 2019 by guest
http://jvi.asm.org/
[image:5.495.72.213.303.435.2] [image:5.495.267.414.413.565.2]100A
60
-J
l 40
k--40
-d
20-5
15 40
CHASE TIME (MIN)
FIG. 7. Effect ofthe lenigth ofthepulseperiodon
the efficientcy anidkinetics ofthe chase. Cell line AH
monolayersin 8-ounce (ca 45 cm2) bottleswere inocu-lated with 10 PFU/cell, anzd 48 hrafter infection at
39 C they were pulse labeled with 3H-thymidine for periods of from 5 to 40miili. Atthe entdofthepulse, themedium conitaininlg50IuCi of 3H-thymidineperml
was replaced with medium conitaininlg ani excess of unlabeled thymidinie. DNA was extracted from the cultures after 15- anid 40-mimi chase periodsand
ana-lyzed by gel electrophoresis as described in Fig. 5. The numbers in thefigureindicate the durationofthe initialpulseperiodinminiutes.
RI molecules. Although the factors responsible
forthe slowphaseofthe chase have not beenfully
investigated,
pulse-chase studiesprovide a useful meanstomeasuretherateofsynthesisofreplica-tive intermediatesand theirconversion intoDNA
Iunder standard conditions.
DISCUSSION
A new and simple technique utilizing
electro-phoresis through SDS-agarose gels has been
developedtoobtainahigh degreeofresolution of
the various formsofSV40 DNA. Accurate
esti-mates of the relative quantities of radiolabeled
DNA1,11,and RI couldeasily bemade, andRI
molecules at different stages in the replication
process could be identified. In the presence of
SDS, the migration ofDNA molecules through
gelswouldbeexpectedtodepend primarilyonthe
sizeandshape of the molecules. Previousstudies
by others utilizing density gradient and electron
microscopy techniques have shown that the RI
molecules, early in the process of replication,
remain predominantly superhelical in
configura-tion(8, 12). Thesemolecules would be expectedto
migrate through gels more slowly than DNA I
becauseof theirslightly larger size and less
super-helical configuration. RI molecules, late in the
processofreplication, havebeenshown by others
tobeuptotwice the size of DNAIandIIandto
be
predominantly
orcompletely
relaxed incon-figuration
(8,
12).
Thesemolecules would be
ex-pected
tomigrate
moreslowly
than DNA II.Some RI
molecules,
intermediate in theprocessofreplication,
wouldmigrate
like DNA II. Thebehavior of fractions derived from
dye
buoyant-density centrifugation
onsubsequent gel
electro-phoresis
strongly supported these
interpretations.
In contrast,
dye
buoyant-density
centrifugation
cannot be used to quantitate DNA II in the
presence
of
late RImolecules in
arelaxed
con-figuration. Velocity sedimentation failstoseparate
early
and late RImolecules(12),
because the con-current increase in molecular weight and therelaxation of replicating molecules affect the
sedimentation of the molecules in opposing
direc-tions.
Thus, gel electrophoresis
providesfavorable
resolutionfor monitoring SV40 DNA synthesis
by
asingle and simpletechnique.
ACKNOWLEDGMENTS
This investigation wassupported bya pilotgrant from the Cuyahoga Unit, Ohio Division, American Cancer Society.
WeareindebtedtoD.Caston for his adviceonthegel tech-niques uLsedin these studies.
LITERATURE CITED
1. Bauer,W.,andJ. Vinograd. 1968. The interaction of closed circular DNA with intercalative dyes.I.Thesuperhelix
den-sityofSV40DNA in thepresenceand absence of dye. J. Mol. Biol.33:141-171.
2. Bollum, F. J. 1959. Thermal conversion of nonpriming deoxy-ribonucleicacidtoprimer.J. Biol. Chem.234:2733-2734. 3. Crawford,L.V.,and P. H. Black. 1964. The nucleic acid of
simian virus 40. Virology 24:388-392.
4. Friedmann, T., and M. Haas. 1970. Rapid concentration and purification of polyoma virus andSV40 with polyethylene glycol. Virology42:248-250.
5. Gunlap,A. 1965.Growth and cytopathic effect of rubella virus inaline ofgreenmonkey kidney cells. Proc. Soc.Exp.Biol. Med.118:85-90.
6. Hirt,B. 1967. Selective extraction ofpolyoma DNA from in-fectedmousecellcultures. J. Mol. Biol.26:365-369. 7. Jaenisch, R., and A. Levine. 1971. DNA replication inSV40
infected cells. V. Circular and catonated oligomers ofSV40 DNA. Virclogy44:480-483.
8. Jaenisch, R., A. Mayer, and A. Levine. 1971. ReplicatingSV40 moleculescontaining closed circular template DNA strands. Nature N. Biol. 233:72-75.
9. Levine, A. J., H. S. Kang, and F. E. Billheimer. 1970. DNA replication inSV40 infected cells.I.Analysis ofreplicating
SV40 DNA. J. Mol. Biol. 50:549-568.
10. Patterson,M.S., andR.C.Greene. 1953.Measurement of low
energy beta-emitters inaqueoussolutionbyliquid scintil-lationcounting of emulsions. Anal. Biochem. 37:854-857. 11. Reichard, R., Z. N. Canellakis, and E. S. Canellakis. 1961.
Studieson apossibleregulatory mechanism for the biosyn-thesis ofdeoxyribonucleic acid. J. Biol. Chem. 236:2514-2519.
12. Sebring, E. D.,T. J. Kelly, Jr., M. M. Thoren, and N. P. Salzman.1971.Structure ofreplicating simian virus 40 de-oxyribonucleic acidmolecules. J. Virol. 8:478-490. 13. Tegtmeyer P., C.Dohan,Jr.,andC. Rezinkoff. 1970.
Inac-tivating and mutagenic effects of nitrosoguanidineonsimian
virus 40. Proc. Nat. Acad.Sci. U.S.A. 66:745-752. 14. Thorne, H. V. 1967.Electrophoretic charaterizationand
frac-tionationofpolyoma virusDNA. J. Mol.Bicl. 24:203-211.