MULTI-DISCIPLINARY SHAPE OPTIMIZATION OF A
ENTRY CAPSULE INTEGRATED WITH CUSTOM
NEU-RAL NETWORK APPROXIMATION AND MULTI-FIDELITY
APPROACH
Claudio Cavallero
Exemplar s.r.l.
C.so Vittorio Emanuele II,161 10139, Turin, Italy
Email: [email protected]
Alessio Davite
DIASP, Politecnico di Torino C.so Duca degli Abruzzi,29 10129, Turin, Italy
Email: [email protected]
Cosimo Chiarelli, Vincenzo Mareschi, Martins Sudars
Thales Alenia Space Italia s.p.a. Strada Antica di Collegno,253 10146, Turin, Italy
Email: {cosimo.chiarelli,vincenzo.mareschi, martins.sudars}@thalesaleniaspace.com
Federico Gallizio,
Optimad engineering s.r.l. via Giacinto Collegno, 18 10143, Turin, Italy
Email: [email protected]
Edmondo Minisci� School of Engineering University of Glasgow
G128QQ, Glasgow, UK
Email: [email protected]
Abstract. This paper describes a new integrated approach for the multi-disciplinary optimization of a entry capsule’s shape. Aerothermodynamics, Flight Mechanics and Thermal Protection System behaviors of a reference spaceship when crossing Martian atmosphere are considered, and several analytical, semi-empirical and nu-merical models are used. The multi-objective and multi-disciplinary optimization process implemented in Isight software environment allows finding a Pareto front of best shapes. The optimization process is integrated with a set of artificial neu-ral networks, trained and updated by a multi-fidelity evolution control approach, to approximate the objective and constraint functions. Results obtained by means of the integrated approach with neural networks approximators are described and compared to the results obtained by a different optimization process, not using the approximators. The comparison highlights advantages and possible drawbacks of the proposed method, mainly in terms of calls to the true model and precision of the obtained Pareto front.
Key words: spacecraft shape optimization, multi-disciplinary optimization, meta-modelling, artificial neural networks, Isight.
1 INTRODUCTION
For future Mars exploration missions the most suitable protection from the high temperatures involved for both Mars entry modules and Earth reentry capsules is represented by ablative systems. Ablative materials are in fact characterized by a higher reliability than non-ablative protections (i.e., ceramics) and simpler process of manufacturing and assembly, hence leading to more contained costs. Furthermore, ablative systems have applications ranging a broader scale of applications, being potentially used in those zones (i.e., nose, stagnation points) exposed to high flux levels exceeding temperature limits of ceramic protections.
In the last years several European and US exploration and commercial space programs need ablative Thermal Protection System (TPS); see for instance the ESA project IXV, the NASA project COTS and the EU-US jointed initiatives ExoMars and Mars Sample Return Mission.
Through the funding support of Regione Piemonte - P.O.R./F.E.S.R. 2007/2013, the STEPS Program intended to produce a series of technological demonstrators (both virtual and physical) finalized to the development of systems for soft landing (lander) and surface mobility (rover) applicable for both robotic and human mis-sion. This program envisages the realization and utilization of a set of laboratories equipped for tele-operations, of tools devoted to the concurrent design, simulation and virtual reality and of Moon and Mars simulated environments.
The Ablative Materials and Aerothermodynamics work package within STEPS Program involves some partners from industrial and academic institutions deeply rooted in Turin area. Partners are: Thales Alenia Space Italia, Politecnico di Torino, Universit`a di Torino and two SMEs (Exemplar S.r.l. and Optimad engineering S.r.l.). Two are the main objectives of the Ablative Materials and Aerothermody-namics research team: a) development of an advanced composite material as core of the ablative TPS for Mars entry missions; b) development of an integrated code sim-ulating the material behavior during an entry path through the Martian atmosphere and the shape optimization of ablative TPS shields. Basically such a code has to provide two main capabilities: a) to simulate the interaction between the external thermo-fluid dynamic and the ablative behavior, in terms of ablation, thermal con-duction and surface recession; and b) to implement some optimization techniques relative to the shield shape and indeed to devise a general design procedure aimed to the pre-project of an entry vehicle optimizing a set of cost functionals.
By means of different approaches and models, a wide and recent literature shows the application of the multi-disciplinary optimization techniques for designing the shape and the heat shield of an entry capsule.
In Brooks and Powers [1] and Shimoyama et al. [2] some reduced order models are used to evaluate the functional forms with saving computational resources. The first one implements a Proper Orthogonal Decomposition in order to approximate the quantities depending on the aerodynamics (lift, drag,...), with a drastic reduction of degrees of freedom. The authors remark that some difficulties are expected in the multiple-shock fitting and in the 3D extension. The second paper shows the shape optimization of a Mars exploratory airplane through an approach based on the improvement of thedesign for six sigma conventional algorithm, with a fine result in terms of robustness. In several papers of Johnson et al. (for instance [3] and [4]) some different multi-disciplinary strategies (a Differential Evolutionary Scheme and a Gradient-based algorithm) were adopted for the optimization of entry heat shield of vehicles devoted to trajectories through martian or terrestrial atmospheres. In Theisinger and Braun [5] an hypersonic entry aeroshell is optimized within the Isight environment by taking into account of the ballistic properties, the static stability and the volumetric efficiency evaluated with simple analytical and semi-empirical correlations. In Gogu et al. [6] an optimal mass tradeoff for an aeroassisted orbital transfer vehicle including both fuel mass and TPS mass for an optimized trajectory is presented. In this paper both reusable and ablative TPSs are considered. At last, Minisci et al. [7] present the robust multi-disciplinary design of a small scale unmanned space vehicle for reentry operations. In this paper the aerodynamic forces, thermal flux and TPS properties are evaluated by taking into account of uncertainties through a Monte-Carlo sampling procedure.
In this paper the first instance of the optimization procedure for the shield shape design is presented. An evolutionary algorithm is modified and hybridized with a multi-fidelity evolution control technique for the treatment of complex and expensive models. During the optimization process, individuals of the population are evaluated (in terms of objectives and constraints) by means of a set of approximated models, whose computing time can be considered much smaller than the one required by the true models. The approximators are initially trained on the basis of sampling of the search space, whose dimension must be limited to save computational time. Then, if the search landscape is not trivial, it is not possible to have an initial set of approximators which are globally correct. This means that, in order to avoid converging towards false optima, the database of solutions used to train the approx-imators must be integrated in due course, and the approxapprox-imators updated. Here the evolution control approach is adopted for the on-line updating of the surrogate models.
Moreover, in order to further increase the saving of computational time, true models of different fidelity levels are considered here for each required functional. Models at lowest fidelity level are used to train the initial approximator and to update it at the early phases of the optimization process, while higher fidelity models are used at latter stages, when the optimizer is exploiting the optimal region of the search space.
NSGA-II[8] which is implemented in Isight.
The structure of this paper is as follows. In section 2 the reference shape of the capsule is illustrated and it is parameterized through some direct analytical formulas. In section 3 the physical models involved within the shape design are collected; a map of the relationships among cost functionals is provided. The section 4 is focused on a description of the multi-fidelity evolution control approach and on the integration within Isight software environment; here the implemented algorithms are in detail presented and discussed. The results and the values of the parameters used in the optimization are then described and discussed in section 6. A final conclusion sections ends the paper with a summary of the work and a note on the work that should be done in the immediate future.
2 PARAMETERIZATION
[image:4.595.208.420.286.482.2]
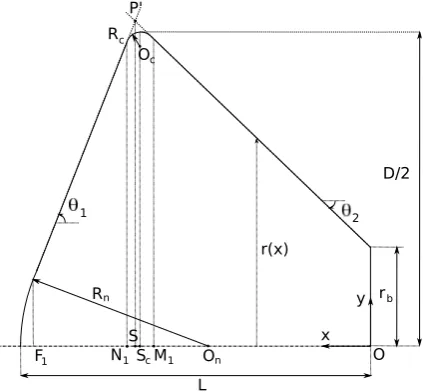
Figure 1: Parameterization of the curve generating the solid of revolution
A reference shape of the capsule is here presented and parameterized. It is a classi-cal Viking 3D axialsymmetriclassi-cal geometry defined by two coniclassi-cal elements connected by two spherical junctions (see figure 1). A set of five design parameters describes such a shape: the nose and the corner radiusRn, Rc, the forebody cone angleθ1, the rear cone angle θ2 and the capsule lengthL. The base of the capsule is enforced to berb = 0.425 m. The capsule diameterD is defined as reference length, then all the length quantities are prescribed as non-dimensional valuesrb/D, Rn/D, Rc/D, L/D. In figure 1 the axial coordinates of the junction points between conical and spher-ical elements are shown F1, N1, M1. The centers of curvature are Oc, On. As the five design variables are chosen the junction points and the centers of curvature are univocally prescribed.
r(x) =
rb for x= 0
rb+xtan θ2 for 0< x≤M1O �
R2
c −(ScO−x)2+ScOc for M1O < x≤N1O
r(N1O)−(x−N1O) tanθ1 for N1O < x≤F1O �
R2
n−(x−OnO)2 for F1O < x≤L
(1)
where:
SO= �
Rb tanθ2
+L−Rn �
1− 1 sinθ1
��
tanθ1 tanθ2+ tanθ1 −
Rb tanθ2
ScO = SO−
Rc sinα1
2
cos�θ2+α1 2
�
ScOc = �
Rb tanθ2
+L+Rn �
1 sinθ1 −
1 ��
tanθ1tanθ2 tanθ1+ tanθ2 −
Rcsin �
θ2+α1 2
�
sinα1 2
M1O= SO−
Rcsinθ2+
Rccos �
θ2+α1 2
�
sinα1 2
N1O= SO+
Rcsinθ2+
Rccos �
θ2+α1 2
�
sinα1 2
OnO= L−Rn
and with α1
2 = (π−θ1−θ2)/2.
3 AEROTHERMODYNAMICS AND FLIGHT MODELS
Several physical models are integrated within the multi-disciplinary optimization loop in order to take into account of effects of the hypersonic aerodynamics, ballistic trajectory, choice of ablative TPS.
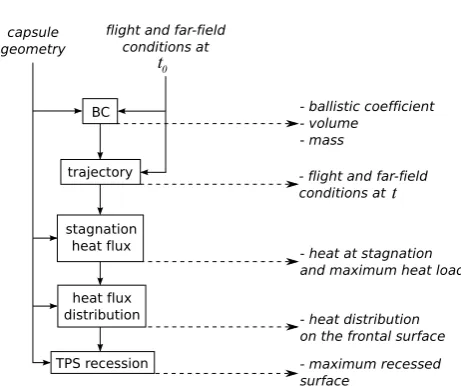
A general framework on the relationships among the different physical models is summarized in figure 2. The flow diagram on the left shows the connections among the functionals involved during the optimization loop and the input dataset. On the top of the flow chart the parameterization of the geometry and the initial state of the mission represent the input values needed. The boxes point out the modules evaluating the functionals: from each module a dashed-line indicates the output dataset evaluated by the related functional. The solid-lines show the explicit dependencies existing among the functionals.
and the geometry in order to estimate the recession of a TPS ablative layer along the frontal surface of the vehicle.
[image:6.595.197.428.133.326.2]! " "
Figure 2: Map of the functionals and dependencies involved in the present multi-disciplinary optimization. On the right side the dashed-lines indicate for each functional which are the output yielded.
In the following paragraphs the physical models adopted to solve these functionals are described.
3.1 Modified Newtonian model
The classical expression of the ballistic coefficient is BC = M
CD A, where M,
CD, A represent the mass of the capsule, the drag coefficient and the frontal area respectively. The drag force depends on the hypersonic aerothermal field experienced by the blunt-body through the entry path. The Modified Newtonian Flow model (see [9]) is a well-known approach to a first approximation of the drag experienced by a capsule in hypersonic regime. The newtonian model theorized a stream of particles in rectilinear motion impacting a surface will lose all normal momentum but conserve all tangential momentum. This model provides an estimation of the pressure coefficientcp = 1/2ρ(p−∞p∞V)2
∞, depending on the angle between the normal to the
wall and the undisturbed velocity, that is cp =cp,max sin
� V∞
|V∞| ·n
�
where cp,max is given by the Rayleigh’s Pitot tube formula:
cp,max = 2
γM2
∞
��
(γ+ 1)2+M2
∞
4γM2
∞−2(γ−1)
�γ/(γ−1)�
1−γ+ 2γM2
∞ γ+ 1
� −1
�
(2)
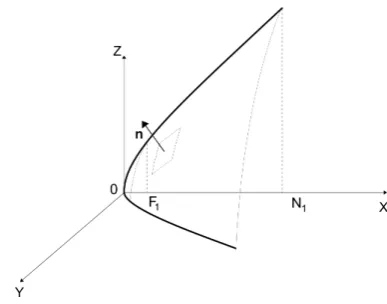
Let us define a cartesian orthogonal frame of reference X, Y, Z with the origin 0 on the intersection between the nose and the axis of simmetry (figure 3). The nose and the cone surfaces can be defined through the following implicit formulation:
F(X, Y, Z) = (X−Rn)2+Y2+Z2−R2n= 0 where 0< X ≤F1
G(X, Y, Z) = Y 2 tan2θ
1 + Z
2 tan2θ
1 − �
X−Rn �
1 sinθ1 −
1 ��2
For instance, the normal to the surface of the nose is computed by:
n = ∇F
|∇F| =nx i+ny j+nz k (4)
[image:7.595.212.406.236.388.2]where i,j,k are the Cartesian orthogonal unit vectors. By replacing the equations (2), (3) and (4) intocp expression, the pressure distribution on the frontal surface of the capsule is evaluated. Therefore the dragDis computed by means of a numerical integration of the pressure on the frontal surface of the blunt body projected onto the far-field direction.
Figure 3: Sphere and cone are described within a frame of reference at the nose’s center
3.2 ’Euler + boundary layer’ model
Continuum aerodynamic characteristics are determined within an inviscid code with a time-dependent Euler calculation. Furthermore, an integral boundary layer code has been coupled to the Euler solver to obtain the viscous components of the forces and moments and the aerodynamic heating distribution on the body.
The approach followed is first to map the vehicle surface geometries onto a nearly horizontal surface, thus producing a coordinate grid closely aligned with the body ge-ometry (see [10], [11]). This mapping is then used to generate the three-dimensional inviscid time-dependent equations of fluid motion written in terms of the new co-ordinates. A final transformation maps the transformed shock layer onto a regular, equally spaced grid.
For the solution of this steady inviscid flow problem is followed a time-asymptotic relaxation method. In this approach, the steady flow solution is sought as the limit of a time-dependent flow with time invariant boundary conditions ast → ∞. Because the time-dependent equations are hyperbolic, this method allows solution of the steady flow problem, which is a boundary value problem, as a mixed initial-boundary value problem with a forward-marching (in time) numerical technique.
algorithm. The integral equations use the momentum and energy thicknesses as the dependent variables, and include the effects of streamline curvature, pressure gradient, surface mass addition and the surface thermal condition. Closure of the equation set is provided by correlations relating skin friction coefficient, heat transfer coefficient, and displacement thickness to the dependent variables. Boundary layer edge conditions are determined as part of the solution by a mass balance procedure between the inviscid and boundary layer solutions.
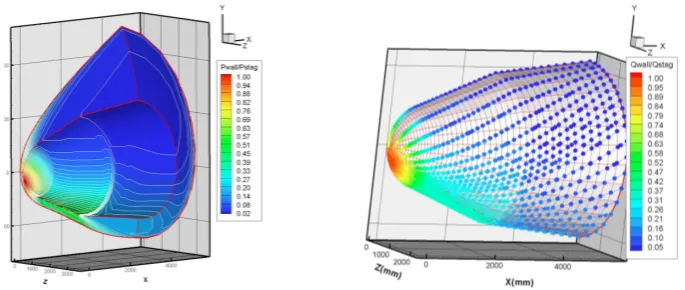
Figure 4: Some results of the ’Euler+boundary layer’ code on a bi-conical entry capsule: normalized pressure distribution (picture on the left) and streamlines colored with normalized heat flux (picture on the right).
An application of the ’Euler + boundary layer’ code for a bi-conical hypersonic entry vehicle at incidence is displayed in figure 4. On the left picture the iso-lines of the pressure field normalized with the stagnation pressure are shown. On the right picture the streamlines are marked with a color gradient according to the wall heat flux.
3.3 Flight Dynamics model description and heat flux computation
A direct integration of the entry path is fine when large number of vehicles and mission parameters are being optimized or a closed loop guidance is present. Run-ning the trajectory integration at each optimization iteration may slow down the whole loop unless other processes are numerically much more consuming than the trajectory integrator.
Two possible ways to deal with the speed requirements in the optimization en-vironment are: a) pre-production of performance maps, or b) simplification of the trajectory propagator in order to run quicker under the optimization environment. The approach of performance maps generally works fine if the number of input pa-rameters is small (usually less than four) and output results do not show sharp peaks or discontinuities. The results are prepared by a high-fidelity optimization tool and then saved in a database. The tool used in the present work to create the performance maps is FMST (Flight Management System Trainers1), an in-house flight mechanics simulation tool developed by and sued internally by Thales Alenia Space Italia. Spherical planet assumption is applied over elliptic shape in order to
1for more information see the web resourcehttp://www.thalesalenia.com/Portfolio/Security/
maintain simple and rapid trajectory propagation approach for the ballistic entry. A custom-made Mars atmosphere model has been utilized.
The entry maximum heat fluxes profiles and load values can be either computed directly by empiric formulas or by numerical integration of the equations of motion and the applying some empiric methodology for heat flux computations. In general, when the flow is laminar (usually it is or can be assumed to be), the correlation between nose cap parameters, flight conditions and the convective heating rate at stagnation is described by the classical Detra, Kemp & Riddel formula (see [12]):
˙
q= √K1
RN
�
ρ∞ ρ0
�n�
ν ν0
�m
(5)
The coefficientK1,m and n describe the correlation of the equation and its param-eters with experimental heating rate. For ˙q expressed in W/m2, according to [12], the coefficients are: K1 = 113.5·106, n = 0.5, m = 3.15, ρ0 = 1.225 Kg/m3 and
ν0 = 7908 m/s. For entry velocity below 9 km/s the radiative effects are negligible and hence not included in the evaluation.
In the present work, given the geometrical parameters described in section 2, the initial state of the mission and the related ballistic coefficient (as computed in section 3.1), the FMST estimates the time history of heat flux at stagnation and the heat load experienced by the capsule through the entry operation.
The Lees’ formulas [13] compute the convective heat flux distribution over an hemisphere and a blunt cone during a ballistic hypersonic entry. These expressions depend on some geometrical parameters (Rn, θ1), the undisturbed Mach number
M∞ and the specific heat ratio γ∞. These formulas are valid in high hypersonic flight regime and in the limiting case of thermodynamic equilibrium where the heat transfer at the wall is achieved by conduction. The convective heat flux distribu-tion was computed for the Mars Pathfinder test case reported in [14] and a first approximation accordance was encountered2.
3.4 Ablation model
A complete modeling of the ablation process requires a conjugate heat transfer analysis, coupling a CFD solver for the external flux to a material response solver for the TPS, and possibly a detailed model to calculate the energy absorbed by the ablation process [15].
Being shape optimization the main scope of this study, an engineering correlation permitting a fast evaluation of surface recession is needed. The ’heat of ablation’ (or Q∗) model assumes that ablation occurs at a fixed temperature and that there
is a fixed amount of energy consumed per unit mass of material ablated [16]. This permits to relate the heat flux coming form the boundary layer, to the TPS density and recession rate:
˙
where ˙qhw is the ’hot-wall’ heat flux and ˙s is the normal recession velocity. As reported in [16], the ’hot-wall’ heat flux can be computed as a correction of the ’cold-wall’ heat flux ˙qcw obtained as shown in section 3.3. The relationship between the ’hot-wall’ and the ’cold-wall’ yields ˙qhw = ˙qcw
�
1− Hw
Hr �
, where Hw is the wall enthalpy andHr is the recovery enthalpy.
[image:10.595.158.469.227.377.2]Given the heat flow distribution over the frontal surface of the capsule (as com-puted in section 3.3), the amount of shield recession can be calculated at every point of the entry trajectory3.
Figure 5: The ablative TPS is modeled as a thin layer deposited on the frontal surface of the capsule (left picture). An example of surface recession at the end of the entry mission computed by theQ∗ model.
In the present model the TPS is defined by a variable length layer with a maximum value at stagnationδT P S, a linear percent decrease along the spherical segmentmδT P S
and a constant thickness on the conical surface. At presentδT P S andmδT P S are not
considered as design parameters but as constants within the optimization process (δT P S/D = 0.005 and mδT P S = 0%). In figure 5 the ablative TPS modeling is
represented. On the left picture the dotted line marks the external boundary of the ablative at the start of entry. On the right picture the recession of the ablative layer close to the stagnation point at the nose is shown. The maximum recessed surface is computed as the maximum variation of ablative thickness between the start and the end of the mission.
4 Integrated Optimization Process
The integrated optimization process is implemented into Isight environment, which efficiently manages and integrates all the models pertinent to the involved disciplines. Moreover, within several Isight optimization methods are already im-plemented.
As previously introduced, the integrated method utilizes a multi-fidelity evolu-tion control approach to evolve an initial random populaevolu-tion of soluevolu-tions towards the optimal region. The basic idea of evolution control (EC) approaches is to use,
3Values of Q∗ can be evaluated experimentally, and have been published for the most used
throughout the optimization process, both the true and the surrogated models in a way that reduces the total computational time, without loosing too much in pre-cision. Due to the necessity to limit the number of training samples, if the search landscape is not trivial (linear or quadratic functions), it is almost impossible to construct a globally correct initial approximated model. Most likely, the approx-imation will bring the optimization algorithm to false optima, i.e. solutions that are optimal for the approximated model but are suboptimal for the true functions. This is the reason why model management or evolution control techniques have been formalized.
Jin et al. [20] propose two different approaches for the evolution control of the model: a) individual-based control and b) generation-based control. In the first approach, nv individuals in the current population are chosen and evaluated with the true model at each generation. In the latter, the whole population is evaluated with the real model, everyngcyc generations, for ngv generations, where ngv< ngcyc. The individuals evaluated with the true model are then introduced into the dataset in order to locally improve the surrogated model in the promising regions.
Here, in order to further increase the efficiency of the process, multi-fidelity proach is combined with EC. This means that during the process the adopted ap-proximator is updated with outputs of models having different fidelity levels. In particular, low fidelity models are used to fill the first database, used to build the first instance of the approximator, then, during the optimization process, higher fidelity models are adopted to integrate the database and improve the precision of the approximated model within the optimal region.
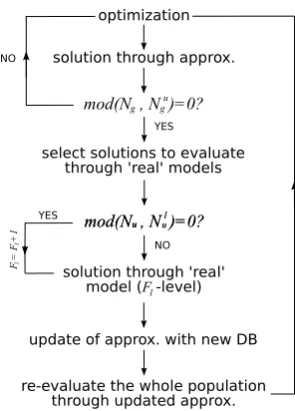
For this work, a mixed individual-generation based EC is adopted and the general algorithm, whose main part is described in figure 6, is as follows:
1. set a) fidelity level,Fl, to 0, b) predefined values forNg,Ngu,Nul,dsl,dll,nc,max
2. exploration of parameters space, performed with a Design Of Experiment (DOE)
3. initialization of first approximator
4. start of optimization process: generation of initial population
5. application of search heuristics to generate new population
6. if a cycle of Nu
g iteration is completed
(a) explore new population to find individuals to upgrade the database;
(b) if a cycle of Nul updates is completed, increase fidelity level, Fl=Fl+ 1 (c) update the approximator with new database
(d) re-evaluate the new population by means of the updated approximated model
7. if iteration =Ng STOP; elsego to 5
! "
[image:12.595.238.386.76.282.2]
Figure 6: Optimization loop
4.1 Artificial Neural Network
Evolution control does not depend on any specific approximation technique but the approximation approach strongly affects the outcome of any EC strategy. Here Artificial Neural Networks are used and, in particular, of Multi Layer Perceptron (MLP) type.
When dealing with ANNs, usually radial basis NNs are preferred due to the mod-est computational effort required to train them [21, 22], but in this case the generic MLP with one hidden layer was used, due to the expected better generalization in regionsfar for the training data.
The training process is based on a Bayesian regularization back-propagation [23], which is slow, but limits any overfitting problem. With the idea that the compu-tational costs of initial training and online update are negligible if compared to the calls to the high-fidelity model, the additional computational efforts required by the Bayesian regularisation back-propagation can be neglected.
5 Problem settings
The optimization process is set as a multi objective one, with 3 objective func-tions:
min
x∈X M ; minx∈X SR ; maxx∈X V (7) and three constraint functions:
˙
qmax ≤100[W/cm2] ; SR,max ≤70% ; DA≤4[m] (8) where,M [kg] is the total mass of the vehicle, SR [%] is the percentage of recessed surface for the TPS material, V [m3] is the volume of the vehicle, ˙q
max [W/cm2], is the maximum heat flux experienced during the mission, SR,max, is maximum recession for the TPS surface, andDA, [m], is the actual diameter.
description name and bounds ratio between lenght and diameter of ship 0.6≤L/D≤0.8
radius of ship’s nose [m] 0.2≤Rn/D≤0.4 radius of ship’s corner [m] 0.02≤Rc/D≤0.04
front edge angle [◦] 55≤θ
1≤70 back edge angle [◦] 25≤θ
[image:13.595.165.462.81.154.2]2≤55
Table 1: Design parameters
level functional model
zero ballistic coefficient modified newtonian
... trajectory performance maps database
... stagnation heat flux Detra, Kemp & Riddel formula ... heat flux distribution Lees formulas
... TPS recession Q∗ model
one ballistic coefficient Euler CFD code
... trajectory performance maps database
... stagnation heat flux Detra, Kemp & Riddel formula ... heat flux distribution Lees formulas
... TPS recession Q∗ model
two ballistic coefficient Euler CFD
... trajectory performance maps database
... stagnation heat flux Detra, Kemp & Riddel formula ... heat flux distribution Euler CFD and boundary layer model
... TPS recession Q∗ model
Table 2: Table of levels of fidelity
6 Optimization setting and results
The process described in section 4 was performed by using NSGA-II code, already implemented into the Isight environment. A population of 32 individuals was evolved for 50 generations (Ng = 50). The initial DOE with models at 0 level (Fl = 0), required 50 solutions, while additional 27 evaluations of models at level 1 and 2, allowed the updating of the ANN approximators. All the ANNs were trained and updated considering a mean square error of 5%, while characteristic parameters for the ANN update were: Nu
g = 4,Nul = 4, dsl = 0.2,dll = 0.2 (note that distances are computed on non-dimensional search space, with all variables∈[0,1]).
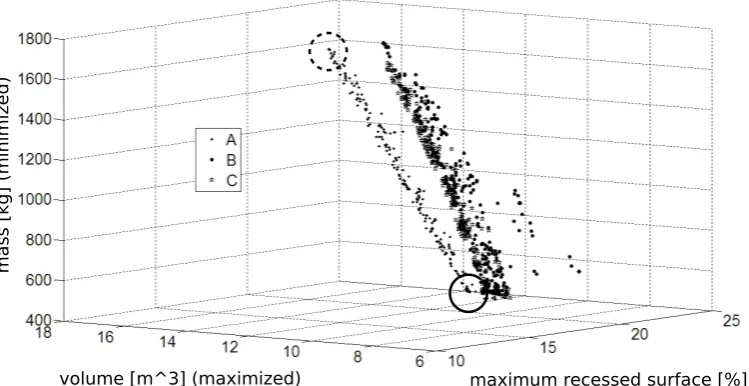
In figure 7 the obtained Pareto front is shown (front A) and compared with the results of a second optimization process, which does not use any approximator, but all the objective functions are computed by calling the models at fidelity level 2 (front B). Note that in figure the solutions of the original process (the one using the ANN approximators) are also shown recomputed by means of models at fidelity level 2 (front C). An analysis of the results shows that the differences between two fronts are close to 5%, which is congruent with the allowed error in the ANN training.
[image:13.595.155.472.193.393.2]
[image:14.595.123.498.96.289.2]
Figure 7: Comparison of Pareto fronts with level 2 and integrated process. The solid-line circle and the dotted-line circle indicate the ’large volume’ capsule and the ’small volume’ capsule reported in figure 8.
Figure 8: Solutions with largest and smallest volume extracted from the Pareto front.
Characteristic shapes representing solutions at the extremes of the Pareto front are shown in figure 8.
7 Conclusions
[image:14.595.191.425.360.512.2]work allowed to set up and test with good results the new approach, which will be adopted in the future as main design tool for advanced concepts.
Next immediate steps will be devoted to challenging and testing the proposed approach with a more real case. The aim would be to reproduce with this new tool preliminary design phases of already finished space projects, in order to compare real/frozen results with the ones provided by the automated procedure.
8 Acknowledgements
The authors acknowledge the support through Regione Piemonte - P.O.R.-F.E.S.R. Asse 1’Innovazione e transizione produttiva’ 2007/2013 - STEPS Program (Sistemi e tecnologie per l’esplorazione spaziale).
REFERENCES
[1] G. P. Brooks and J. M. Powers, A Kathunen-Lo´eve Galerkin Technique with Shock Fitting for Optimization for a Blunt Body Geometry, 38th AIAA/ASME/SAE/AEE Joint Propulsion Conference and Exhibit, AIAA 2002−3861, (2002).
[2] K. Shimoyama, A. Oyama and K. Fujii, Multi-Objective Six Sigma Approach Applied to Robust Airfoil Design for Mars Airplane, 48th AIAA/ASME/ASCE/AHS/ASC Structures, Structural Dynamics, and Mate-rials Conference, AIAA, (2007).
[3] J. E. Johnson, R. P. Starkey and M. J. Lewis Aerothermodynamic Optimiza-tion of Reentry Heat Shield Shapes for a Crew ExploraOptimiza-tion Vehicle, Journal of Spacecraft and Rockets, vol. 44, (2007).
[4] J. E. Johnson, R. P. Starkey and M. J. Lewis, Entry Heat Shield Optimization for Mars Return, 47th AIAA Aerospace Sciences Meeting Including The New Horizons Forum And Aerospace Exposition, AIAA 2009−518, (2009).
[5] J. E. Theisinger and R. D. Braun, Multiobjective Hypersonic Entry Aeroshell Shape Optimization, Journal of Spacecraft and Rockets, vol. 46, (2009).
[6] C. Gogu, T. Matsumura, R. T. Haftka and A. Rao, Aeroassisted Orbital Trans-fer Trajectory Optimization Considering Thermal Protection System Mass, Journal of Guidance, Control, and Dynamics, vol. 32, (2009).
[7] E. Minisci, H. Liqiang and M. Vasile,Multidisciplinary Design of a micro-USV for Re-entry Operations, AIAA Guidance, Navigation, and Control Conference, AIAA 2010−7968, (2010).
[8] K. Deb, A. Pratap, S. Agarwal, and T. Meyarivan, A Fast and Elitist Mul-tiobjective Genetic Algorithm: NSGA-II, IEEE Transaction on Evolutionary Computation, vol. 6(2), (2002).
[10] G. Moretti,Computation of shock layers about ablated, blunt-nosed bodies, Poly-technic Institute of New York, POLY-M/AE Report No. 76−i, May, (1976).
[11] G. Moretti, Calculation of the three-dimensional, supersonic, inviscid, steady flow past an arrow-winged airframe, Polytechnic Institute of New York, POLY-M/AE Report No. 77−14, August, (1977).
[12] R. W. Detra, N. H. Kemp, F. R. Riddell,Addendum to heat transfer to satellite vehicles reentering the atmosphere, Jet Propulsion, vol. 27, (1957).
[13] L. Lees,Laminar Heat Transfer Over Blunt-Nosed Bodies at Hypersonic Flight Speeds, Jet Propulsion, vol. 26, (1956).
[14] F. S. Milos, Y.-K. Chen, W. M. Congdon and J. M. Thornton,Mars Pathfinder Entry Temperature Data, Aerothermal Heating, and Heatshield Material Re-sponse, Journal of Spacecraft and Rockets, vol. 36, (1999).
[15] A. Martin and I.D. Boyd,Strongly coupled computation of material response and nonequilibrium flow for hypersonic ablation., 41st Thermophysics Conference, San Antonio (TX), USA, (2009).
[16] J.A. Dec and R.D. Braun, An approximate ablative thermal protection system sizing tool for entry system design., AIAA Paper, 780, (2006).
[17] H.K. Tran, C.E. Johnson, D.L. Rasky, et al, Phenolic impregnated carbon ab-lators (PICA) as thermal protection systems for discovery missions., Technical Report NASA TM-110440, (1997).
[18] S.D. Williams and D.M. Curry, Thermal protection materials: thermophysical properties data., Technical Report NASA RP-1289, (1992).
[19] TPSX NASA Material Properties Database (Web Edition Version 4), web source: http://tpx.arc.nasa.gov/.
[20] Y. Jin, M. Olhofer and B. Sendhoff, Framework for Evolutionary Optimiza-tion with Approximate Fitness FuncOptimiza-tions, IEEE Transactions on Evolutionary Computation, vol.6, (2002).
[21] K. Giannakoglou, Design of optimal aerodynamic shapes using stochastic op-timization methods and computational intelligence, Progress in Aerospace Sci-ences, vol. 38, (2002).
[22] W. Shyy, N. Papila, R. Vaidyanathan, and K. Tucker, Global design optimiza-tion for aerodynamics and rocket propulsion components, Progress in Aerospace Sciences, vol. 37, (2001).