http://pim.sagepub.com/
the Maritime Environment
Engineers, Part M: Journal of Engineering for
http://pim.sagepub.com/content/early/2011/06/30/1475090211409997
The online version of this article can be found at:
DOI: 10.1177/1475090211409997
published online 30 June 2011
Proceedings of the Institution of Mechanical Engineers, Part M: Journal of Engineering for the Maritime Environment
E K Boulougouris, A D Papanikolaou and A Pavlou
Energy efficiency parametric design tool in the framework of holistic ship design optimization
Published by:
http://www.sagepublications.com
On behalf of:
Institution of Mechanical Engineers
can be found at: Maritime Environment
Proceedings of the Institution of Mechanical Engineers, Part M: Journal of Engineering for the Additional services and information for
http://pim.sagepub.com/cgi/alerts
Email Alerts:
http://pim.sagepub.com/subscriptions
Subscriptions:
http://www.sagepub.com/journalsReprints.nav
Reprints:
http://www.sagepub.com/journalsPermissions.nav
Energy efficiency parametric design tool in the
framework of holistic ship design optimization
E K Boulougouris1*, A D Papanikolaou2,andA Pavlou2
1
Department of Naval Architecture, Faculty of Technological Applications, Technological Educational Institute of Athens, Athens, Greece
2
Ship Design Laboratory, School of Naval Architecture and Marine Engineering, National Technical University of Athens, Athens, Greece
The manuscript was received on 29 October 2010 and was accepted after revision for publication on 19 April 2011.
DOI: 10.1177/1475090211409997
Abstract: Recent International Maritime Organization (IMO) decisions with respect to mea-sures to reduce the emissions from maritime greenhouse gases (GHGs) suggest that the colla-boration of all major stakeholders of shipbuilding and ship operations is required to address this complex techno-economical and highly political problem efficiently. This calls eventually for the development of proper design, operational knowledge, and assessment tools for the energy-efficient design and operation of ships, as suggested by the Second IMO GHG Study (2009). This type of coordination of the efforts of many maritime stakeholders, with often con-flicting professional interests but ultimately commonly aiming at optimal ship design and operation solutions, has been addressed within a methodology developed in the EU-funded Logistics-Based (LOGBASED) Design Project (2004–2007). Based on the knowledge base devel-oped within this project, a new parametric design software tool (PDT) has been develdevel-oped by the National Technical University of Athens, Ship Design Laboratory (NTUA-SDL), for imple-menting an energy efficiency design and management procedure. The PDT is an integral part of an earlier developed holistic ship design optimization approach by NTUA-SDL that addresses the multi-objective ship design optimization problem. It provides Pareto-optimum solutions and a complete mapping of the design space in a comprehensive way for the final assessment and decision by all the involved stakeholders. The application of the tool to the design of a large oil tanker and alternatively to container ships is elaborated in the presented paper.
Keywords:greenhouse gases, holistic design approach, LOGBASED Project, ship systems optimization, parametric design tool
1 INTRODUCTION
It is today a well-established fact that human activi-ties have a significant impact upon the levels of greenhouse gases (GHGs) in the atmosphere, i.e. those gases that absorb and emit radiation within
the thermal infrared range. The gases with the most important release to the atmosphere are, in des-cending order, water vapour, carbon dioxide (CO2),
methane, and ozone. The Intergovernmental Panel on Climate Change released in 2007 a report stating that ‘most of the observed increase in global average temperatures since the mid-20th century is very likely due to the observed increase in anthropogenic greenhouse gas concentrations’ [1].
One of the main contributors of the emissions of GHGs due to human activity is the burning of fossil fuels. The total CO2 emissions from shipping *Corresponding author: Department of Naval Architecture,
Faculty of Technological Applications, Technological Educational Institute of Athens, St. Spyridonos Street, Athens 12210, Greece.
(domestic and international) amounted to about 3.3 per cent of the global emissions from fuel con-sumption during 2007, according to Buhauget al. [2]. The central estimates in the Second International Maritime Organization (IMO) GHG Study (2009) is that, if no policy for the reduction in the GHG emis-sions is implemented, the growth of shipping will result in an increase by 150–250 per cent of the ship emissions relevant to their 2007 levels.
Climate stabilization by 2100 at no more than 2°C warming over the pre-industrial levels will require significant reductions in the CO2emissions
by 2050, and the international shipping industry needs to participate in this process. Although mari-time transport is the most efficient mode of trans-port and least pollutant in terms of GHG emissions, present discussions and expected regulatory mea-sures suggest that the collaboration of all major stakeholders is required to address this complex techno-economical and highly political problem efficiently (see, for example, Document MEPC 57/4/ 5 [3]). The list of stakeholders embraces both ship-builders and ship operators. The actions to be taken include the development of proper design, opera-tional knowledge, and assessment tools for the energy-efficient design and operation of ships. More recently, an IMO study team emphasized that (see reference [2], p. 61)
‘.Ships’ lifetimes may exceed thirty years, and
the operating and business environment may change significantly in the course of this time. Flexibility to allow upgrades and efficient operation in different scenarios should be considered at the design stage. It is thus critical to build the right ship for the job, which provides sufficient flexibility in operation. Specifying a ship and subsequently designing to that specification is a highly complex task. Estimating the potential for saving energy at this stage is equally complex; however, the influence of choices that are made at this stage of the design process is very significant and should not be under-estimated.’
This is exactly the field of application of the approach elaborated in this paper which is based on the EU-funded Logistics-Based (LOGBASED) Design Project.
2 BACKGROUND
The type of effort coordination required by many maritime stakeholders with often conflicting inter-ests and ultimately aiming at optimal ship design and operation solutions has been addressed within the LOGBASED methodology, developed in the
recently completed LOGBASED Project [4, 5]. The approach has a modular structure where the various modules can be utilized to various extents pertain-ing to the specific case in question (Fig. 1). The vari-ous modules guide the business developer and/or designer through a systemic process. This provides decision-making support to the development of a transport system and the pertinent integrated ship design solution within the specific business devel-opment context in question. Thus, the LOGBASED method can be used not only for the design of a single ship but also for the management of a whole fleet of ships. The project focused on roll-on–roll-off (ro–ro) ships, but the methodology developed can be easily extended to other ship types, such as oil tankers, bulk carriers, and container ships.
3 THE PROBLEM
In most cases the development of a transport sys-tem has many stakeholders: commercial, opera-tional, economical, technical, and social. In this business environment, the optimization of the design of the tailor-made ship for the particular trade is the ideal situation that reduces the risk and maximizes the returns of the investment. This is well known among ship operators. The problem is how to define the ‘perfect ship’ given the following:
(a) the fluctuations in the market (i.e. the cargo demand);
(b) the flexibility of the competitors (i.e. the cargo capacity);
(c) the uncertainty in the behaviour of the rest of the stakeholders (cargo owners, port authori-ties, international regulatory bodies, financial investors, etc.);
(d) the uncertainty in the environmental factors.
effective ship designs for business opportunities. The difference between the old approach and the new approach is shown in Fig. 2. In the new approach the designer and the owner are working side by side, using the available market mapping in order to rationalize the ship requirements. The mar-ket is captured using advanced forecasting tools such as artificial neural networks (ANNs), trained according to the existing historical data. The designer creates a parametric ship model that is optimized using state-of-the-art tools such as genet-ic algorithms (GAs) and the owner’s preference is captured using multi-attribute decision-making (MADM) methods, such as the analytical hierarchy process (AHP) and utility functions (utilite´ additive (UTA)). It is obvious that the impact of this approach is maximized when it is used early in the business case development phase.
As part of the knowledge base developed within LOGBASED, a parametric design tool (PDT) has been developed by the National Technical University of Athens, Ship Design Laboratory (NTUA-SDL). The PDT facilitates the interaction of
the novel LOGBASED approach with the traditional ship design methods accommodated in modules 7 and 8. The PDT is an integral part of module 4 (i.e. transport system and design solution development (see Fig. 1)). Its aim is to provide the user with the capability to develop different design solutions and to exploit the feasible design space very rapidly. Furthermore, the PDT tool is also used to bench-mark or calibrate heuristically selected system design parameters for extreme values or outliers.
Traditionally the environmental impact of a ship (except in the cases of the oil spills of tankers) or a fleet is taken into account in a qualitative way, i.e. through compliance with a set of rules requiring some sort of system to exist (i.e. scrubber) or a pro-cedure to be followed (i.e. water ballast manage-ment). Thus, even if for the decision maker the maximization of the environmental friendliness is of top performance expectation (module 2), this would be achievable only through the proper selection of the systems in module 8. The introduction of the CO2index or energy efficiency design index (EEDI)
of the attained new ship design has permitted the Fig. 1 The LOGBASED methodology (from reference [5] with permission): module 1, business
[image:4.595.140.477.76.401.2]evaluation of the environmental friendliness from a quantitative perspective. Thus, the minimization of the EEDI has been introduced as an objective into a multi-criteria design-making (MCDM) problem.
4 HOLISTIC DESIGN OPTIMIZATION
Most design problems are formulated on the basis of the determination of a set of design variables (e.g. the number of ships and the individual ship size and speed in fleet optimization) that provide a design solution that satisfy certain relations between, and restrictions of, these variables (e.g. physical, technical, legal, and economical). In case there are a number of combinations of design vari-ables that satisfy all these conditions, a measure of merit is selected (e.g. the weight, cost, or yield) which creates a ranking, resulting in the selection of the optimal combination [8]. The number of design variables is always constrained by efficiency considerations [9].
Since the mid-1960s with the advance of computer hardware and software more and more parts of the design process have been taken over by computers, particularly the heavy calculatory and draughting ele-ments of ship design. Simultaneously, the first com-puter-aided preliminary design software systems
were introduced, dealing with the mathematical parametric exploration of design space on the basis of empirical and simplified ship models for specific ship types or the optimization of design variables for specific economic criteria by gradient-based search techniques [10,11]. Also, computer-aided studies on optimization of the ship’s hull form for least resis-tance and best seakeeping behaviour (hydrodynamic design optimization) or of the ship’s midship section and structural design for least steel weight (structural design optimization) started to be introduced to the naval architectural scientific community until they led to mature results in more recent years [12,13].
[image:5.595.62.514.79.369.2]disciplines introduced in the general framework of ‘design for XXX’, namely ‘design for safety’ [15,16], ‘design for efficiency’, ‘design for production’, ‘design for operation’, etc., indicate the need for approaches and the availability of mature methods and computational tools to address holistically the ship design optimization problem.
The use of GAs, combined with gradient-based search techniques in microscale exploration and with a utility functions technique for MADM, provides the means for a generic type of optimization technique, producing and identifying optimized designs through effective exploration of the large-scale non-linear design space and a multitude of evaluation criteria. Several applications of this generic multi-objective ship design optimization approach by use of NTUA-SDL’s design software system, integrating the naval architectural software package NAPA [17], the optimi-zation software modeFRONTIER [18], the PDT, and various other application software tools, as necessary for the conceptual design, the evaluation of the stabi-lity, the resistance, the seakeeping, etc., may be found in the listed references. A sketch of the approach to generic ship design optimization is shown in Fig. 3.
In this paper, the holistic ship design approach will be implemented for the classical design prob-lem of large tankers for a given deadweight (DWT) with the following objectives:
(a) minimization of the EEDI;
(b) minimization of the ideal ship price (ISP);
(c) minimization of the displacement of the ship; (d) maximization of the ship’s speed.
Additionally, the holistic ship design approach will be implemented for the investigation of the benefits of designing slow-speed container ships in order to minimize their environmental footprint.
5 THE TOOLS
It is true that in the context of the holistic design approach there are more advanced methods and tools for treating the above problem. For example, hull opti-mization can be performed by the integration of NAPA, SHIPFLOW, and modeFrontier [13]. Nevertheless, they require the skills of a well-trained naval architect and also they are time consuming for the conceptual design phase. In that respect, the PDT is the ideal tool that can be easily used by all stakeholders (i.e. designers, builders, owners, and operators).
The PDT has been developed in MS EXCEL 2003 and recently upgraded to MS EXCEL 2007. It con-sists of four main functional elements:
(a) element I, a database of existing ship designs and their main particulars including the ship’s type, size, and other special features;
[image:6.595.109.509.85.343.2](c) element III, a tool for the design and the trade-off analysis around a design point;
(d) element IV, the ISP calculator.
The database of element I was recently extended to include the following:
(a) ro–ro cargo ships [19] and other ship data from partners of the LOGBASED Project;
(b) container ships [19];
(c) oil tankers built after 1995 with a DWT larger than 70 000 ton;
(d) bulk carriers with a DWT capacity from 500 ton up to 33 000 ton;
(e) bulk carriers built after 1995 with a DWT from 55 000 ton up to 322 000 ton;
(f) general cargo ships with a DWT from 500 ton up to 52 000 ton.
Element II is a query tool for filtering the design database. Three-stage filtering has been introduced on the basis of feedback from end users. In the first stage the user selects the subset of ships according to their date of build. In the second stage this subset is refined according to the speed range. The last fil-tering of the data set (i.e. the third stage) is achieved according to the cargo-carrying capacity, i.e. the DWTs for tankers, bulk carriers, and general cargo ships or the lane metres for ro–ro ships. Thus, at the end a subset of ‘similar designs’ according to the designer’s requirements is created. The statistical values of the main particulars and regression analy-sis formulae resulting from the selected subset are used for initiating the feasible alternative designs.
Element III is a simplified model of the traditional design spiral in the preliminary design stage. Starting from the basic requirements for the cargo-carrying capacity (DWT or lane metres), the speed, and the endurance and utilizing the information extracted from the database subset, an iterative pro-cess is used to balance the resulting main dimen-sions, the weights, and the installed horsepower of each design.
Element IV is a tool that calculates the ISP. The need for the development of such a tool was trig-gered by the large fluctuations occurring in the ship’s price market and the confidentiality of actual ship price data. Instead of estimating the actual building cost plus profit (a function of both the shipyard location and country and the time of building), the following methodology has been developed. Given the market’s freight rate (FR), the ISP is calculated by reversing the procedure method for the required FR calculation, namely on the basis of the zero net present value (NPV) of the
investment; in other words, the ‘ideal’ ship price that will zero the NPV for the given required FR is found. The feasibility of a project is evaluated by comparison of the resulting ‘ideal price’ designs with current market prices. The viability of an investment in purchasing a new building or an existing ship can also be assessed according to the preferred difference from the ISP.
The tool can also calculate the required FR if the ship price is given as the input from existing market data. The ISP is practically a special case of the zero NPV of Buxton’s [20] ‘permissible price’ concept. The ISP proves to be a very handy indicator for esti-mating very rapidly the feasibility of a business case according to the magnitude of the required invest-ment and its profitability given the actual market prices.
The core of the PDT is element III. Standard naval architecture methodologies are used in order to cal-culate the various lightship weight groups (struc-ture, machinery, and outfitting). For ro–ro ships, Watson’s [21] methodology and adjusting relevant semiempirical coefficients based on a verification of up-to-date designs recorded in databases of the LOGBASED design team are utilized. The machinery weight is estimated on the basis of the installed main engine’s horsepower while the outfit weight is based on the main deck’s area [8].
The resistance is estimated according to the method described by Holtrop and Mennen [22] and Holtrop [23] using appropriate margins for appen-dages, design, and sea conditions according to the usual contract specifications. The method is consid-ered very accurate for the types of hull forms of interest herein, and it is quite sensitive in capturing hull design alternatives. Transom sterns and bul-bous bows are taken into account. Thus, the employed method allows the definition of hull form variables in the form of a number of parameters which are used for minimization of the resistance and powering. It is worth noting that engine manu-facturers are using this method to estimate the required engine type for similar ship types [24].
number of carried TEUs by approximate empirical formulae accounting for the vessel’s main dimensions.
5.1 Energy efficiency design index
The EEDI is calculated herein on the basis of the IMO’s interim guidelines on the method of calcula-tion of the EEDI for new ships [25].
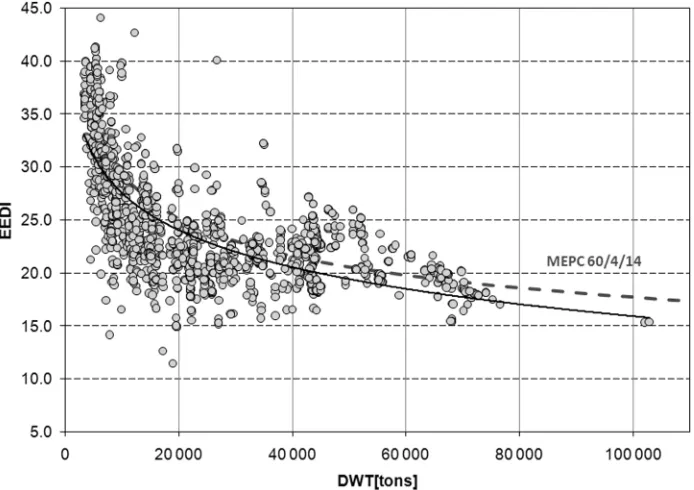
Using the procedure and the assumptions described in the interim guidelines an initial estima-tion of the EEDI for the ships in the PDT database was performed. The specific fuel consumption (SFC) was assumed to be 170 g/kW h for the main engine(s) and 190 g/kW h for the auxiliary engine(s). The results for bulk carriers are shown in Fig. 4 while the relevant graph for the tankers is shown in Fig. 5. In Fig. 6 the EEDI for container ships, using 65 per cent of their DWT as a measure for their utili-zation, is shown.
What is interesting to observe in Fig. 4 is that almost the entire existing fleet of bulk carriers (except for a few outliers) is above the baseline for-mula proposed in Document GHG-WG 2/2/7 [26], even though a reduced SFC has been used in com-parison with the values of 190 g/kW h and 210 g/kW h proposed in Document GHG-WG 2/2/7 [26]. This provides additional verification of the comments made by several delegations at the 60th session of the Marine Environment Protection Committee (MEPC) of the IMO [27].
In generating data for Fig. 5 (tankers), the same assumptions as in Document GHG-WG 2/2/7 [26] were used, i.e. an SFC for the main engine of 190 g/ kW h, an SFC for the auxiliary engine of 210 g/kW h, and CF= 3.13 g CO2/g fuel, whereCFis a conversion
factor between fuel consumption and CO2based on
the fuel’s carbon content. The sample set within the PDT database fits the proposed baseline very well.
In Fig. 6, using the same assumptions as above, the sample set of container ships within the PDT database verifies the baseline for the container ships proposed in reference [28].
From the graphs in Figs 4 to 6 it is obvious that, for a given DWT requirement, the EEDI may vary significantly, in terms of both the ship size and the ship type, emphasizing the fact that there is room for improvement in the efficiency of many represen-tatives of these types of ship.
The optimization procedure adopted herein employs the commercial software modeFRONTIERÒ [18] as the optimization scheduler and NAPAÒfor the naval architectural calculations and ship design. The important features of modeFRONTIER are as follows.
1. It is written 100 per cent in Java, making it com-pletely portable.
2. It offers a menu of several optimization algo-rithms: GAs, conjugate gradient method, quasi-Newton method, sequential quadratic program-ming, and simplex. Algorithms can be com-bined, e.g. GAs for a global search and another algorithm for a local search (refinement).
3. It can handle both real and integer variables. 4. It can integrate software on different platforms
in networks, e.g. a hull description in NAPA under MS Windows XP and a computational fluid dynamics code under UNIX on another computer.
5. It allows the boundary conditions to be checked first before an objective function is evaluated. This is important if the objective function requires far more central processing unit time than the (violated) boundary condition.
6. It runs on parallel architectures.
The data flow between the applications is shown in Fig. 7.
6 CASE STUDIES
6.1 AFRAMAX tanker
The application of the above optimization proce-dure to the conceptual design of an AFRAMAX tan-ker with a DWT capacity of around 112 000 ton was selected for the first case study. This work is com-plementary to previously published research work [14, 29], where the internal subdivision of a fixed-hull AFRAMAX tanker was optimized with respect to the carrying capacity and the oil outflow. In the present study, the internal subdivision was kept fixed, whereas the ship’s hull form was varied. Thus, the main dimensions of the hull form (i.e. the length, the breadth, the depth, and the draught) and the buoyancy distribution (i.e. the longitudinal cen-tre of buoyancy and the areas of the bulbous bow and transom) were varied herein, as they were con-sidered as the design variables. The speed and the range were kept constant.
(a) the total transportation cost per unit of cargo (in US dollars per ton);
(b) the EEDI; (c) the lightship;
(d) the specific gravity of the cargo at the homoge-neous full-load condition as a measure to max-imize the carrying capacity for the same required DWT.
The total transportation cost per unit of cargo is calculated by subdividing the annually delivered cargo (millions of tons) by the total costs (millions of US dollars). The total costs include the annual voyage costs, the non-voyage operating costs, and the capital costs.
A number of constraints were used in this optimi-zation as follows:
Fig. 4 The EEDI versus the DWT for bulk carriers with a DWT greater than 55 000 ton built after 1995
[image:9.595.113.460.88.320.2] [image:9.595.115.463.388.619.2](a) the metacentric height uncorrected for the free-surface effect;
(b) the maximum value of the cargo’s specific gravity;
Fig. 6 The EEDI based on the DWT versus the DWT for container ships according to Circular MEPC.1/Circ.681 (from reference [25] with permission)
[image:10.595.137.484.89.334.2] [image:10.595.142.479.397.690.2](c) the minimum and maximum block coefficients in order to create valid tanker designs;
(d) the adequacy of the capacity of the segregated ballast tanks to meet the relevant MARPOL requirements;
(e) the maximum draught according to the Load Line Convention (LLC) which should not be exceeded.
The range of variance of the design variables was selected on the basis of the available PDT database (element II) for a DWT range65 per cent around the required DWT. The data for the engines were taken from an engine database.
In the optimization procedure, 4000 different designs were generated. The scatter diagram of the total transportation cost in US dollars per ton versus the EEDI is shown in Fig. 8. In Fig. 9 the estimated lightship versus the cargo’s specific gravity for the homogeneous full-load condition is shown.
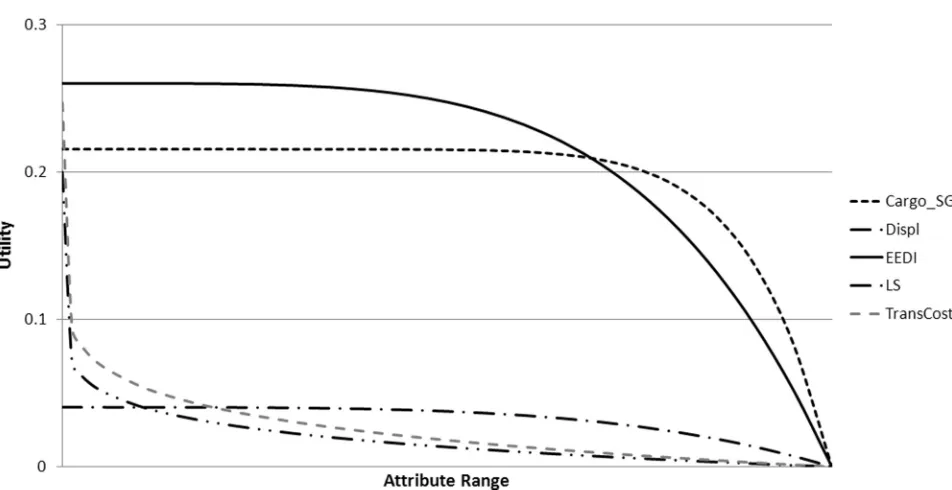
Based on the above results, the Pareto (non-dom-inated) designs could be identified. In order to select the optimum design, the preference of the decision maker should be taken into account. Using modeFrontier’s MCDM GA and requesting that the objectives should be ranked in descending order of importance, namely (herein as a demonstration example), first, the EEDI, second, the transportation cost, third, the lightship, and, finally, the maximum specific gravity of the cargo, a ranking of the Pareto designs was produced. The algorithm assists the decision maker in finding the best solution for a set of Pareto alternatives. It verifies the coherence of the expressed preferences and, if all pairwise comparisons are valid, it generates a valid utility function and ranking [18]. In the present case it resulted in the utility functions shown in Fig. 10.
Using these functions the Pareto designs can be ranked and the optimum can be identified.
The optimum design identified herein was design number 917 with the main dimensions and charac-teristics shown in Table 1.
Given the outcome of the conducted optimiza-tion, the decision maker has a comprehensive understanding of the physical and economic con-straints of the design problem in hand; the range of the variance of the objectives and the compromises that have to be made may be systematically explored in order to obtain the best design solution fulfilling the initial expectations.
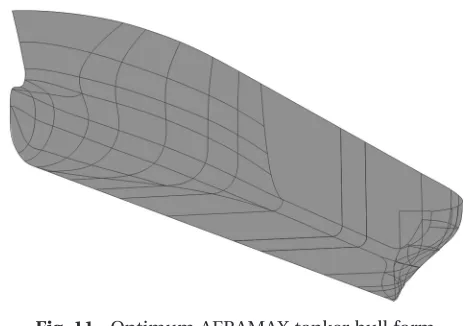
The results of the present PDT tool can be easily fed into modules 7 and 8 of the LOGBASED metho-dology, where the traditional design process takes place. For instance, a design software platform, such as NAPA, can be used in order to produce the ship’s hull form and the arrangement with the required characteristics as shown in Fig. 11. Optimization of the internal subdivision is a feature of the holistic design concept that has already been demonstrated [14]. Verification of the weight estimations and especially of the weight of the steel structure is a more tedious task, requiring the integration of struc-tural design software tools in the optimization, e.g. of classification-scanning software tools. This has also been addressed recently by NTUA-SDL in the framework of multi-objective tanker design optimi-zation, in which, together with the structural weight, the oil outflow and the internal subdivision were optimized [30].
6.2 Slow-steaming container ship
[image:11.595.44.529.83.279.2]deterioration in the on-time arrivals of vessels (see the latest Container Shipper Insight report by Drewry Shipping Consultants). Of nearly 1600 ships tracked in the 3 months between 1 October 2009 and 31 December 2009, Drewry’s report found that only 53 per cent arrived either on the scheduled day of arrival or a day prior to the scheduled day of arrival [31].
In order to investigate the impact of resetting the design point of future container ships with respect to the speed of service, a case study for the design Fig. 9 The lightship versus the specific gravity of the cargo for the homogeneous full-load
[image:12.595.68.551.87.281.2]condition
Fig. 10 Utility functions for ranking the Pareto AFRAMAX designs (SG, specific gravity; LS, lightship)
Table 1 Main dimensions of the optimum design
Length 241.00 m
Breadth 45.05 m
Depth 19.50 m
Draught 14.67 m
Block coefficient 0.827 Deadweight 116 000 ton Lightship 18 877 ton Main engine power 13 407 kW
EEDI 3.95
[image:12.595.71.547.331.576.2] [image:12.595.56.294.651.766.2]of two container ships with a carrying capacity of about 5000 TEU, but with different reductions in the speed, was launched. The first reduced the speed by 4 kn, namely from 25 kn to 21 kn, while the second corresponds to an even more radical speed reduc-tion by 9 kn, i.e. to 16 kn. Valuable relevant informa-tion was retrieved from the Quantum project of Det Norske Veritas (DNV) [32]. A container ship data-base with ships built after 1995 up to 2007 was used, including 2535 different ships of various capacities. Relationships and charts in the NTUA-SDL ship database were updated to account for the influence of the TEU cargo capacity on the main particulars of the vessels. Energy efficiency indices, such as the Heickel coefficient and the specific resistance (SR) [33] or the specific tractive force (STF) were intro-duced, when comparing different modes of trans-portation [34]. The SR or the STF is defined as the fraction of the installed power divided by the prod-uct of the weight multiplied by the speed. The for-mulation given by Akagi and Morishita [35] was used with the power expressed in kilowatts, the weight in tons-force, and the speed in kilometres per hour. Finally, the semi-empirical weight estima-tion formulae were updated to account for the con-tainer ship calculations.
In order to examine the impact of the design changes, module 4 (i.e. the transport system and design solution development) was updated with an economic model for the container liner service. The data used were deduced from the work of Stopford [36]. The trans-Pacific route was selected for the case study. The model includes the following:
(a) the service schedule based on a weekly sched-ule with seven port calls on the round voyage (e.g. Shanghai, Kobe, Nagoya, Tokyo, Sendai, Oakland, and Los Angeles);
(b) capacity utilization, 90 per cent for the east-bound leg and 40 per cent for the westeast-bound leg, recognizing the fact that there is much more cargo moving east in the selected route; (c) ship costs per day including operating
expenses (OPEX), capital costs, and bunker costs;
(d) port charges;
(e) the cost of containers and their handling includ-ing transhipment, inland transport, inter-zone repositioning, and cargo claims;
(f) the administration cost of running a global container service.
Thus, the updated module 4 includes all eight building blocks of liner costs [36] as follows:
(a) the ship and its characteristics; (b) the service;
(c) the capacity utilization;
(d) the daily ship costs (OPEX, capital costs, and bunker costs);
(e) the port charges;
(f) the deployment of the containers;
(g) the cost of containers and container handling; (h) the administration cost.
Given that the liner pricing is based on the cost per TEU, comparison of the economic efficiency of the designs in the following case studies was based on the average cost per TEU, i.e. the cost that the company should charge on both the eastbound leg and the westbound leg in order to cover all voyage costs.
6.3 The 21 kn container ship design
In this case, the implementation of the PDT as a fast decision support tool was investigated. Instead of performing a full optimization, the goal was to improve an existing design, producing radical changes in a short timeframe. In real life this could be accomplished during one or two executive meet-ings in a shipping company, with or without a major cargo owner.
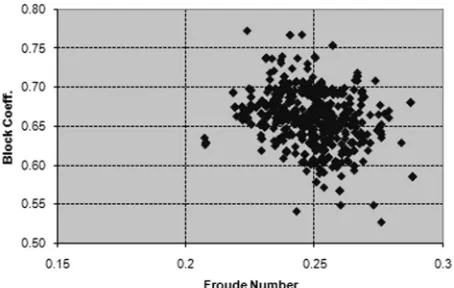
The analysis of the database revealed that most of the existing designs are located around the (Cb, Fn) = (0.65, 0.25) operation point, whereCbis the block
[image:13.595.38.271.603.766.2](Fig. 6) is remarkable. The reciprocal transport effi-ciency is defined as
Reciprocal transport efficiency = BHP(kW)
D(ton)Vs(km=h) (1)
where BHP is the brake horsepower,Dis the displa-cement, andVsis the service speed.
A subset of the database was used with designs having a TEU capacity of between 5000 and 6000 boxes. A reference ship was selected for verification of the PDT weight formulae. The general arrange-ment of the ship is shown in Fig. 14 and her main particulars are given in Table 2.
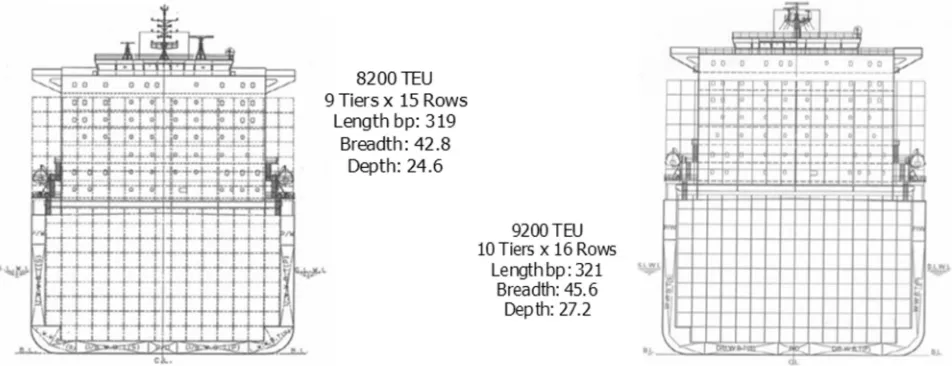
Based on only the TEU capacity, the PDT will normally design a typical post-Panamax ship, simi-lar to the reference ship. Hence, the design goal herein will be to design a slower and wider ship with the required capacity. The TEU capacity of a cellular box-type ship, such as a container ship, is a function of the cross-section capacity and of the cargo hold length (Fig. 15).
The design goal herein is to increase the capacity per section in order to reduce the length of the ship, noting that this may eventually reduce the structural weight and increase the payload capacity. The refer-ence design DWT is a function of the weight of the TEUs plus the weight (8670 tonf) of the bunkers. If the number of TEUs remains the same, then the number of bunkers is expected to be significantly reduced. It is assumed that the payload remains the same and the breadth of the ship is increased from 40 m to 45.6 m. This creates two additional rows both in the hold and on deck and will increase the capacity per hold by 72 TEUs. Therefore, one hold can be omitted, reducing the required length by 29.68 m to 233.32 m. This may be expected to lead to a reduced structural weight, in view of the reduced longitudinal bending and torsional moments.
Using the data from the reference design, its voy-age cost was calculated and its breakdown is shown in Fig. 16.
[image:14.595.64.291.89.233.2]Using the PDT a systematic evaluation of differ-ent designs was performed. Given the constraints in the main dimensions, only a small subset of the design variables was altered. This quick investiga-tion resulted in an improved design with the follow-ing particulars. The resultfollow-ing design is very close to DNV’s Quantum project design, with a reduced block coefficient. From Table 3 it is obvious that a significant reduction in the installed power was achieved (–48 per cent). This resulted in a reduction of 33 per cent in the EEDI, although the utilization was reduced. The capital value was also reduced owing to the smaller required main engine. A factor of 250e/kW was assumed for the machinery costs. All the above resulted in a reduction of 5 per cent in the average cost per TEU for the given ship. The problem, however, is that by operating this ship the company will have to put one more ship into service in order to maintain a weekly liner service. In Fig. 17 the reason for the small overall cost reduc-tion is obvious; the total ship costs were reduced for Fig. 12 The block coefficientCbversus the Froude
[image:14.595.322.560.114.223.2]numberFnof existing container ships
Fig. 13 The reciprocal transport efficiency versus the TEU capacity
Table 2 Main dimensions of the reference container ship
Length 263.00 m
Breadth 40.00 m
Draught 14.00 m
Block coefficient 0.61
TEU 5500
Speed 25 kn
BHP ’55 000 kW
EEDI 24.05
[image:14.595.63.289.301.444.2]the improved design, but the rest of the cost items are more or less inflexible.
6.4 The 16 kn container ship design
An even slower design travelling at 16 kn with a capacity of about 5000 TEUs was also investigated. This resulted in a ship with the particulars given in Table 4. It is an extreme container ship design, com-ing closer to slow cargo ship designs. Employcom-ing the traditional naval architecture methodology, the
[image:15.595.47.530.86.197.2] [image:15.595.51.527.240.423.2]design specifications and the owner’s requirements were transformed into requirements for the lines plan. The hull design was developed using data from the well-known FORMDATA Series [37, 38]. The preliminary body plan of the design is shown in Fig. 18, and the corresponding capacity plan in Fig. 19. The capital cost in this case was reduced both for the reduction in the machinery cost and for the reduction in the steel cost. The latter was assumed to be reduced by a factor of 3.53103US$/ ton, resulting in a reduction of US$93106on top of Fig. 15 The total TEU capacity as a function of the cross-section capacity
Fig. 14 GA of the reference container ship
[image:15.595.121.455.463.596.2]the machinery cost savings. The 16 kn improved design voyage cost breakdown is shown in Fig. 20.
The results of this case study show that the dras-tic reduction in the EEDI does not correspond to drastic changes in the average cost per TEU. On the contrary, the significant fixed cost of cargo handling, the reduced number of round trips per year, and the reduced TEU capacity by almost 9 per cent diminishes the gains made by a reduction in the speed (–3 per cent). In addition, two more ships are now required in order to maintain the schedule, which means a higher capital investment to provide the same liner service. However, it should be noted that herein the probable reductions in the outfitting weight and the related cost, in view of the reduced ship length and capacity, could not be exactly accounted for and were assumed conservatively with marginal impact on the ship’s capital cost. The same applies to consideration of the reduction in the machinery costs, noting that the reduction in the speed by 9 kn, or 36 per cent with respect to the reference ship’s speed of 25 kn, led herein to a reduction in the powering by merely 69 per cent,
although further reductions could be achieved with detailed hull-form optimization. Thus, the above conclusions will be conservative in general but show the techno-economic limits of slow steaming. In Table 5 the Quantum design developed by DNV, the reference ship, and the two designs developed by SDL are compared. All designs have adequate bal-last tank capacities and their maximum draughts meet the LLC requirements.
7 THOUGHTS ON THE EEDI
[image:16.595.84.539.78.454.2]Using the EEDI in the above studies as a merit func-tion for design optimizafunc-tion, it is inevitable that a few remarks should be made on this new environ-mental footprint index. The proper definition of the EEDI may be disputed. One main contradiction in the definition of the EEDI is that, although the aim is fundamentally to maximize the efficiency, the index in its present form should be minimized. Although this may be easily corrected by consider-ing the reciprocal value of the EEDI, another Fig. 17 21 kn improved design voyage cost breakdown
Table 3 Main dimensions of the 21 kn improved design
L 233 m
B 45.6 m
T 13.5 m
TEU 5500
Speed 21 kn
Displacement ’87 000 ton
Cb 0.59
Lightship ’22 200 ton
BHP ’29 000 kW (–48%)
EEDI 16.30 (–33%) Average cost per TEU US$1056 (–6%) Number of ships for the
schedule
5.6 (instead of 4.9); thus + 1 ship
Capital value US$823106 Depreciation time 20 years Interest rate 8%
[image:16.595.317.559.105.279.2]OPEX 7700 US$/day
Table 4 Main dimensions of the 16 kn improved design
L 230 m
B 44 m
T 13.0 m
TEU 4978
Speed 16 kn
Displacement ’105 000 ton
Cb 0.78
Lightship ’20 600 ton
BHP ’17 200 kW (–69%)
EEDI 9.725 (–60%) Average cost per TEU US$1086 (–3%) Number of ships for the
schedule
6.9 (instead of 4.9); thus + 2 ships
Capital value US$713106 Depreciation 20 years Interest rate 8%
Fig. 18 Body plan of the 16 kn container ship design (from reference [39] with permission)
[image:17.595.119.454.268.455.2]Fig. 19 Capacity plan of the 16 kn container ship design (from reference [39] with permission) Table 5 Comparison of the designs
Parameter (units) Value for the following
DNV Quantum design Reference ship 21 kn SDL PDT design 16 kn SDL traditional design
Length (m) 272.3 (overall) 263 (bp) 233 (bp) 230 (bp) Breadth (maximum/WL) (m) 49.0/42.5 40.0/40.0 45.6/45.6 44.0/44.0 Draught (m) 12.0 14.00 m 13.5 m 13.0 m
TEU 6210 5500 5500 5000
Cb 0.57 0.61 0.59 0.78
BHP (kW) 23 000* 55 000 29 000 17 200
Speed (kn) 21 25 21 16
DWT/TEU 8.78 12.36 11.76 16.96
[image:17.595.47.519.514.760.2]drawback cannot be remedied, namely that the phy-sics of the ship’s powering are not properly reflected in the EEDI; thus, the impact of the size of the vessel and the installed power are not taken into account in the existing formulation. It could be argued that for the naval architect there are some very tradi-tional and reliable measures for the assessment of the hull and propulsion efficiency, such as the well-known British Admiralty constant or the related
Heickel coefficientdefined as
K=
ffiffiffiffi D
p
PB
!1=3
U (2)
whereDis the displacement,PBis the engine power,
andUis the ship’s trial speed. Either the Admiralty constant or the Heickel coefficient could be modi-fied accordingly to take into account any improve-ments regarding the fuel consumption savings or the use of fuels that emit less CO2(i.e. have a lower CF). In this case an alternative EEDI* definition
could be in the form
EEDI= hull efficiency index3energy efficiency index3fuel CO2efficiency index (3)
Another effective way to assess the efficiency of transport vehicles (of any type, i.e. land-borne, air-borne, and waterborne vehicles) is the well-known Gabrielli–von Ka´rma´n (GK) [33] diagram. The diagram shows the required power per tonne of weight at a given speed of transport. The lower this ratio is for a given speed, the higher the efficiency. The GK diagram depicts the physical and technological limitations of the various means of transportation. In Fig. 21 the design points of the reference container ship and of the 21 kn improved design are plotted. It is obvious that, from the GK transport efficiency point of view, the improved design proves to be not better than the
initial design, although it demonstrates an improved EEDI, which is not considered herein.
8 CONCLUSIONS
The work presented herein demonstrated the applic-ability of a holistic ship design approach using a PDT to optimization at the conceptual design stage. The PDT developed initially for the implementation of the LOGBASED methodology in ro–ro ship design has been further enhanced to facilitate the design of other ship types, such as bulk carriers, tankers, and container ships. The tool can help the decision maker to assess the ship design space of the transportation system rationally in its business concept and to estimate the environmental impact and the economic incentives. Case studies of an AFRAMAX oil tanker, two 5500 TEU container ships, and one 5000 TEU container ship were presented herein to demonstrate the developed con-cept. The tool can also be used to assess the operating CO2index of a ship in a given trading scheme, using
the existing methods in the LOGBASED module 4. This is a further step in the initial LOGBASED methodology, thereby improving the interaction between yards, operators, and other market stakeholders when search-ing for optimal ship design solutions.
FUNDING
This work was partially supported by the NTUA-DNV Bilateral Gift Project (2007–2010) on Ship Design Optimization (grant number NTUA-63/16 66).
ACKNOWLEDGEMENTS
The authors are solely responsible for the contents of the paper and the expressed opinions, which do not necessarily represent the opinion of DNV.
[image:18.595.148.473.90.248.2]ÓAuthors 2011
REFERENCES
1 Solomon, S., Qin, D., Manning, M., Chen Z., Marquis, M., Avery, K. B., Tignor, M., and Miller, H. L.(Eds) Intergovernmental Panel on Cli-mate Change. Summary for policymakers. In Cli-mate change 2007: the physical science basis. Contribution of Working Group I to the Fourth Assessment Report of the Intergovernmental Panel on Climate Change, 2007 (Cambridge University Press, Cambridge).
2 Buhaug, Ø., Corbett, J. J., Eyring, V., Endresen, Ø., Faber, J., Hanayama, S., Lee, D. S., Lee, D., Lindstad, H., Markowska, A. Z., Mjelde, A., Nelissen, D., Nilsen, J., Palsson, C., Wu, W., Winebrake, J. J., andYoshida, K.Second IMO GHG study 2009. Report, International Mari-time Organization, London, UK, April 2009.
3 IMO Marine Environment Protection Committee, Prevention of air pollution from ships, Report of the Intersessional Correspondence Group on Greenhouse Gas Related Issues. Document MEPC
57/4/5 (Australia and The Netherlands), Interna-tional Maritime Organization, London, UK, Decem-ber 2007.
4 DG Research, Logistics-based (LOGBASED) Design Project STREP in the Sixth Framework Programme of the European Commission, 2004–2007.
5 Brett, P. O., Boulougouris, E., Horgen, R., Konovessis, D., Oestvik, I., Mermiris, G., Papanikolaou, A., and Vassalos, D. A methodology for logistics-based ship design. In Proceedings of the Ninth International Marine Design Conference (IMDC 06), Ann Arbor, Michigan, USA, 16–19 May 2006, pp. 856–869.
6 Johnsen, T. A. V.andVabø, T. J.Strategic planning for the Norwegian Rhine Line by use of operations research. Master Thesis, Norges Teknisk-Naturvi-tenskapelige Universitet, Trondheim, Norway, 2006. 7 Boulougouris, E. K., Gohari, C., and
[image:19.595.54.529.90.466.2]Papanikolaou, A. D. Ship design optimization in the multimodal logistics framework. Harbin Gong-cheng Daxue Xuebao (J. Harbin Engng Univ.), 2007, 27(Suppl. 2), 150–159.
8 Schneekluth, H. and Bertram, V. Ship design for efficiency and economy, 2nd edition, 1998 (Butter-worth–Heinemann, Oxford).
9 Erikstad, S. O.Introduction to marine systems design models and methods. Lecture Notes, University of Trondheim, Trondheim, Norway, August 2003.
10 Murphy, R. D., Sabat, D. J.,andTaylor, R. J.Least cost ship characteristics by computer techniques.J. Mar. Technol., 1965,2(2), 174–202.
11 Nowacki, H., Brusis, F., and Swift, P. M. Tanker preliminary design – an optimization problem with constraints.Trans. SNAME, 1970,78, 357–390. 12 Papanikolaou, A., Kaklis, P., Koskinas, C., and
Spanos, D.Hydrodynamic optimization of fast dis-placement catamarans. In Proceedings of the 21st International Symposium onNaval hydrodynamics
(ONR 96), Trondheim, Norway, June 1996, pp. 697–714. 13 Boulougouris, E. andPapanikolaou, A.Hull form optimization of a high-speed wave piercing mono-hull. In Proceedings of the Ninth International Marine Design Conference (IMDC 06), Ann Arbor, Michigan, USA, 16–19 May 2006, pp. 559–581. 14 Papanikolaou, A.Holistic ship design optimization.
Computer-Aided Des., 2010,42(11), 1028–1044. 15 SAFEDOR, Design, operation and regulation for
safety, Integrated Project 516278 in the Sixth Framework Programme of the European Commis-sion, Annual Public Report Year 1 and Annual Pub-lic Report Year 2, 2005–2009, available from http:// www.SAFEDOR.org.
16 Vassalos, D.Risk-based design: passenger ships. In
Risk-based ship design – methods, tools and appli-cations(Ed. A. Papanikolaou), 2009 (Springer). 17 NAPA Oy, NAPA software, 2008, available from
http://www.napa.fi/.
18 ESTECO, modeFRONTIER software v.2.5.x, 2003, available from http://www.esteco.com/home/ mode_frontier/mode_frontier.html.
19 Register of ships, CD-ROM, 2007 (LR-FAIRPLAY Ltd, Coulsdon, Surrey).
20 Buxton, I. L. Engineering economics and ship design, 1976 (The British Ship Research Associa-tion, Wallsend).
21 Watson, D. G. M. Practical ship design, Elsevier Ocean Engineering Book Series, 2002 (Elsevier Sci-ence, Oxford).
22 Holtrop, J. andMennen, G. G. J. An approximate power prediction method. Int. Shipbuilding Prog., 1982,29, 166–170.
23 Holtrop, J.A statistical reanalysis of resistance and propulsion data. Int. Shipbuilding Prog., 1984,31, 272–276.
24 Propulsion trends in bulk carriers. Report, MAN Diesel A/S, Copenhagen, Denmark, 2007.
25 IMO Marine Environment Protection Committee, Interim guidelines on the method of calculation of the energy efficiency design index for new ships. Circular MEPC.1/Circ.681, International Maritime Organization, London, UK, 17 August 2009.
26 IMO Greenhouse Gas Emissions Working Group, Recalculation of energy efficiency design index baselines for cargo ships. Document GHG-WG 2/2/
7 (Denmark), International Maritime Organization, London, UK, 4 February 2009.
27 IMO Marine Environment Protection Committee, Comments on the EEDI baseline formula. Docu-ment MEPC 60/4/15 (Greece), International Mari-time Organization, London, UK, 15 January 2010. 28 IMO Marine Environment Protection Committee,
Consideration of the energy efficiency design index for new ships – recalculated baseline for container vessels. Document MEPC 60/4/14 (Denmark, the Marshall Islands, and the World Shipping Council), International Maritime Organization, London, UK, 12 January 2010.
29 Papanikolaou, A., Tuzcu, C., Tsichlis, P., and Eliopoulou, E. Risk-based optimization of tanker design. In Risk-based ship design – methods, tools and applications (Ed. A. Papanikolaou), 2009 (Springer).
30 TANKOPT: optimization of AFRAMAX tankers. Ger-manischer Lloyd–National Technical University of Athens Bilateral Project, 2008–2009.
31 Baird Maritime, Drewry: slow-steaming no guaran-tee of service reliability, 17 March 2010, available from http://www.bairdmaritime.com/index.php? option=com_content&view=article&id=5945:drewry-slow-steaming-no-guarantee-of-service-reliability&cat id=111:general-shipping-news&Itemid=205&q=drewry
+ slow + steaming.
32 DNV Container Ship Update No. 1, Det Norske Ver-itas (DNV), Høvik, Bærum, Akershus, Norway, April 2010.
33 Gabrielli, G. and von Ka´rma´n, T. What price speed? Specific power required for propulsion of vehicles.Mech. Engng, 1950,72(10), 775–781. 34 Young, J., Smith, R., and Hillmansen, S. What
price speed – revisited.Ingenia, 2005,22, 46–515. 35 Akagi, S. and Morishita, M. Transport
economy-based evaluation and assessment of the use of fast ships in passenger-car ferry and freighter systems. In Proceedings of the Sixth International Confer-ence on Fast sea transportation (FAST 2001), Southampton, UK, 4–6 September 2001, vol. 1, 16 pp. (RINA, London).
36 Stopford, M.Maritime economics, 3rd edition, 2009 (Routledge, London).
37 Guldhammer, H. E. FORMDATA III, hydrostatic data for tanker and bulbous bow series, wetted sur-face, comparison with other series and existing ships, 1967 (Danish Technical Press, Copenhagen). 38 Guldhammer, H. E. FORMDATA IV, hydrostatic
data transom stern series of various stern breadths, 1969 (Danish Technical Press, Copenhagen). 39 Pavlou, A.Conceptual design of a slow steaming
con-tainer ship. Diploma Thesis, School of Naval Architec-ture and Marine Engineering, National Technical University of Athens, Athens, Greece, 2010.
40 Papanikolaou, A.Review of advanced marine vehi-cles concepts. In Proceedings of the Seventh Inter-national Symposium onHigh speed marine vehicles
![Fig. 1The LOGBASED methodology (from reference [5] with permission): module 1, businessconcept definition; module 2, performance expectations; module 3, competitive position;module 5, risk assessment; module 4, transport system and design solution development;module 6, decision-making support; module 7, ship functions; module 8, ship systems;module 9, performance evaluation](https://thumb-us.123doks.com/thumbv2/123dok_us/1681552.121546/4.595.140.477.76.401/methodology-businessconcept-performance-expectations-competitive-assessment-development-performance.webp)
![Fig. 2Comparison of the old approach and the new approach (from reference [7] with permission)](https://thumb-us.123doks.com/thumbv2/123dok_us/1681552.121546/5.595.62.514.79.369/fig-comparison-old-approach-new-approach-reference-permission.webp)
![Fig. 3Ship design optimization procedure (from reference [13] with permission)](https://thumb-us.123doks.com/thumbv2/123dok_us/1681552.121546/6.595.109.509.85.343/fig-ship-design-optimization-procedure-reference-permission.webp)