City, University of London Institutional Repository
Citation: Kulesza, T., Wong, W-K., Stumpf, S., Perona, S., White, R., Burnett, M., Oberst,
I. & Ko, A. J. (2009). Fixing the program my computer learned: barriers for end users,challenges for the machine. In: C. Conati, M. Bauer, N. Oliver & D. S. Weld (Eds.), Proceedings of the 14th international conference on Intelligent user interfaces. (pp. 187-196). ACM. ISBN 978-1-60558-168-2
This is the accepted version of the paper.
This version of the publication may differ from the final published
version.
Permanent repository link: http://openaccess.city.ac.uk/14848/
Link to published version: http://dx.doi.org/10.1145/1502650.1502678
Copyright and reuse: City Research Online aims to make research
outputs of City, University of London available to a wider audience.
Copyright and Moral Rights remain with the author(s) and/or copyright
holders. URLs from City Research Online may be freely distributed and
linked to.
City Research Online: http://openaccess.city.ac.uk/ [email protected]
Fixing the Program My Computer Learned:
Barriers for End Users, Barriers for the Machine
Todd Kulesza
1, Weng-Keen Wong
1, Simone Stumpf
1, Stephen Perona
1, Rachel White
1,
Margaret M. Burnett
1, Ian Oberst
1, Andrew J. Ko
21
School of EECS
Oregon State University
Corvallis, Oregon
{kuleszto, wong, stumpf, peronas, white, burnett,
obersti}@eecs.oregonstate.edu
2
The Information School
University of Washington
Seattle, WA
[email protected]
ABSTRACT
The results of a machine learning from user behavior can be thought of as a program, and like all programs, it may need to be debugged. Providing ways for the user to debug it matters, because without the ability to fix errors users may find that the learned program's errors are too damaging for them to be able to trust such programs. We present a new approach to enable end users to debug a learned program. We then use an early prototype of our new approach to conduct a formative study to determine where and when debugging issues arise, both in general and also separately for males and females. The results suggest opportunities to make machine-learned programs more effective tools.
Author Keywords
Machine learning, debugging, end-user programming
ACM Classification Keywords
H5.2. Information interfaces and presentation (e.g., HCI): User Interfaces
INTRODUCTION
How do you debug a program that was written by a machine instead of a person? Especially when you don't know much about programming and are working with a program you can't even see?
This is the problem faced by users of a new sort of program, namely, one generated by a machine learning system that customizes itself to the user. For example, intelligent user interfaces, recommender systems, and categorizers of email use machine learning to adapt their behavior to users' preferences. This learned set of behaviors is a program. These learned programs do not come into existence when the learning environment has left the hands of the machine learning specialist; instead, they are learned
on the user's computer. Thus, if these programs make a mistake, the only one present to fix them is the end user. These attempts to "fix" the system can be viewed as debugging—the user is aware of faulty system behavior, and wants to change the system's logic so as to fix the flawed behavior.
In this paper we present an approach to support end-user debugging of machine-learned programs. Because this notion of debugging is new, an exploration of fundamental issues and challenges is necessary. We therefore built a prototype based upon our approach, so that we could investigate both barriers faced by end users when debugging machine-learned programs, and challenges to machine learning algorithms themselves.
Using our prototype e-mail sorter as our research vehicle, we studied end users' difficulties in debugging the learned program's behavior. We analyzed the resulting set of barriers for patterns in their occurrence and how they related to the users' debugging progress. Since researchers have recently found evidence of gender differences in debugging (e.g., [24]), we also investigated the interaction of gender with these barriers.
The main contributions of this paper are:
• A new "why-oriented" approach to allow end users to debug the logic of a machine-learned program.
• Identification of barriers encountered by end users attempting to debug a machine-learned program. • Identification of gender differences in the barriers
encountered.
• A set of challenges for researchers developing machine learning algorithms, when the programs learned by these algorithms must be debugged by end users.
BACKGROUND AND RELATED WORK
e-Why Questions
Why will this message be filed to <Personal>? Why won't this message be filed to <Bankruptcy>? Why did this message turn red?
Why wasn't this message affected by my recent changes? Why did so many messages turn red?
Why is this email undecided?
Why does <banking> matter to the <Bankruptcy> folder? Why aren't all important words shown?
Why can't I make this message go to <Systems>?
Table 1: The Why questions.
commerce problems, visualizing events and transactions between services. The Whyline [10] is a debugging tool aimed at event-driven programs and has recently been extended to help users debug the document and application state in word processors [18]. None of this work, however, allows end users to change the logic of a program learned
by a machine.
Many end user debugging systems require users to have access to source code. This is particularly problematic for machine-learned programs, since there is no obvious "source code" behind the scenes to study. Recent studies have highlighted the need for explanation and visualization of the machine learning algorithm's reasoning. The first [19] examines the obstacles faced by developers familiar with machine learning who need to apply machine learning to real-world problems. The second [8] investigates the types of questions a research team would like to ask an adaptive agent in order to increase their trust in the agent. We tackle a more difficult problem, with end users who know nothing about machine learning but are required to interact with a learning system.
Much of the work in explaining probabilistic machine learning algorithms has focused on the naïve Bayes classifier [2, 12] and, more generally, on linear additive classifiers [20] because explanation is more straightforward. More sophisticated but computationally expensive explanation algorithms have been developed for general Bayesian networks [13]. All of these approaches, however, are intended to explain the reasoning of the algorithm, rather than let the user modify it.
Some Programming by Demonstration (PBD) systems learn programs interactively from users' examples using machine learning techniques [14]. However, in the few cases in which user feedback is permitted, this feedback is limited to certain interactions, such as correcting an object the system identified [15] or telling the system to "stop that!" [16], or it requires a familiarity with an underlying language syntax such as Lisp (e.g., [25]).
Thus, previous research on enabling people to interact with machine learning systems have focused on helping people more easily create a machine-learned program or
understand it, but not on enabling end users to debug it.
DEBUGGING OF LEARNED PROGRAMS
Inspired by the success of the Whyline's support of debugging [10, 18], we designed a method to allow end users to ask Why questions of machine-learned software. Our approach is novel in the following ways: (1) it supports
end users asking questions of machine-learned programs, and (2) the answers aim at providing suggestions for these end users to debug the learned programs.
Design of the Why Questions
We began by defining the universe of possible Why questions that could be asked in our domain. Our first step toward this goal was to inventory the domain objects, such as messages and folders. Our second step was to inventory all possible user actions we expected to support, which we obtained from an experiment involving a previous research prototype [23]. That prototype also provided an inventory of feedback effects from the system (such as folder prediction and word importance). From these inventories, we generated a query grammar of all legal combinations of objects, actions, and effects. This described our universe of Why questions.
To select from these, we then drew from earlier work on learning barriers for novice programmers [11]; we chose the questions that could help a user overcome one or more of these barriers. This resulted in the nine Why questions (and answers) depicted in Table 1. The textual answers include a mixture of static and dynamic text to make clear to users that the answers relate to their current situation. For example, the answer to Table 1's second question (with dynamically-replaced text in <brackets>) is:
The message will be filed to <Personal> instead of <Bankruptcy> because <Personal> rates more words in this message near Required than <Bankruptcy> does, and it rates more words that aren't present in this message near Forbidden. (Usage instructions followed this text.)
In addition to the textual answers, three questions are also answered visually. These are shown in Table 2. The bars indicate the weight of each word for predictions to a given folder; the closer to Required/Forbidden, the more/less likely messages containing this word will be classified to this folder. Providing the necessary dynamic content to these textual and visual explanations required support from the underlying machine learning algorithm. Details on the machine learning algorithm and how it was used to provide dynamic answers will be discussed in later sections.
Design Principles for End-User Debugging
In general, debugging involves inspecting concrete data about program execution. For example, debuggers provide access to variables' values and the stack. Therefore, one principle that guided the design of our prototype was that users should be able to "debug" by directly interacting with the words in actual e-mail messages.
the visualizations (Table 2) are actually representations of the learned program's code, because they are the only representation of the program logic available for human reading. Because of these dual purposes of the Why answers, our policy was to make these answers be faithful representations of the system logic. For this reason, we discarded variants of the visualizations that omitted details.
Consistent with the notion that these visualizations are the source code, and that what the user is trying to do is fix the code, it follows that the user must be able to manipulate the visualizations. These manipulations are the method users have to fix machine-learned bugs—they allow the user to directly change the logic the learned program will follow.
Machine Learning Design Considerations
For the purposes of investigating our basic approach and barriers, we decided to begin with an algorithm widely used in our study's setting. We chose naïve Bayes [21] because, first, it is a commonly used algorithm for spam filtering. Second, naïve Bayes is structured such that rich user feedback can be integrated in a straightforward manner. Third, we can readily generate rule-based explanations from the naïve Bayes classifier. Our previous work [22] has shown that rule-based explanations are the most easily understood types of explanations. Our bar graph visualization can be considered either a rule-based or a keyword-based explanation, since the rules are defined using keyword presence and absence. Fourth, when the user modifies the weight on a keyword, naïve Bayes will set the new value to be almost exactly the value specified by the user. In contrast, techniques like user co-training [23] assign a new value, which could potentially be quite different from the user-assigned value. User co-training assigns a value that is a combination of the user-assigned value and the classifier's internal weight. With the bar graph visualization used in this study, this behavior can be frustrating to end users, as it makes the algorithm appear to disobey the user's change.
In our visualization, naïve Bayes does in fact make a slight modification to the assigned weight. We treat the
user-specified folder assignment for the current email as a new training data point for the classifier. Thus, in addition to the user-assigned weights, the classifier (and hence the visualization) is also changed by the new data point formed from the current email and the user-specified folder assignment. This change was to make the classifier more sensitive to user feedback in the interactive setting.
How Debugging Works
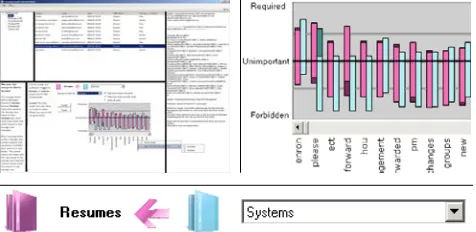
Figure 1 gives a bird's eye view of the prototype we built following these principles. It consists of the usual email client elements: a folder list (top left pane), a list of headers in the current folder (top center pane), and the current message (right pane). The two bottom panes contain the textual answers (left) and interactive visualizations for debugging (center).
If at some point the user wants to know why the program is behaving in a certain way, she can ask any of the Why questions through either the menu bar, or context-sensitive menus by right-clicking on the object (such as a particular word) she has questions about. For example, in Figure 1, the user has just asked why this message is not filed in Systems. The keyword bar graph shows the system's opinion of the importance of each word to the Resumes folder (dark pink), which is the current folder for this message, versus importance to the Systems folder (light blue). In the figure, the user is trying to debug the system's behavior by decreasing the weight of the word "please" to Systems.
In prior empirical work [23], we learned that users wanted access to a rich set of information, possibly even the entire set of keywords that the system has available. The keyword bar graph provides this—all words are available using this graph, and each can be manipulated. Users' changes to bar graph entries cause the system to immediately recalculate its predictions of all messages in the inbox. These changed folder predictions are listed textually next to each message header in the inbox, highlighting headers whose predictions have changed. For every manipulation, the user immediately sees both how the "source code" in terms of
Why does <word> matter to <folder>?
Why will this message be filed to <folder>?
[image:4.612.317.553.531.699.2]Why won't this message be filed to <folder>?
Table 2: Visual explanations for three Why questions.
Figure 1: (Top left): A thumbnail view of the prototype. (Top right): Blow-up of the visualization/debugging features. The
user has just decreased the importance of "please" to Systems by dragging the blue (light) bar downward. (Bottom): But the system still thinks the message belongs in
[image:4.612.55.293.537.653.2]importance of words has changed, and also how the resulting program output changes.
Answering the "Why?" Questions
The questions "Why will this message be filed to X?" and "Why won't this message be filed to X?" both require dynamically generated answers that rely on support from the underlying machine learning algorithm. Before explaining how these answers are generated, we define the following notation. An email message is represented as a "bag of words", which converts the email message into a Boolean vector W = (W1, …, Wm) in which Wi takes the value true if the ith word of a vocabulary of m words is present in the email message and false otherwise. The vocabulary in our experiment consists of the union of the words from the following parts of all the emails: the email body, the subject line, and email addresses in the To, From and CC parts of the email header. Stop words, which are common words with little predictive value such as "a" and "the", are not included in the vocabulary.
Answering: "Why will this message be filed in X?"
In previous work [22] we observed that end users understood how the presence of keywords influenced the classification, but they struggled with the concept of how the absence of keywords influenced the classification. We addressed this difficulty through the visualization of the naïve Bayes classifier, shown in the leftmost image of Table 2, in which the "weight" associated with each word in the vocabulary is depicted as a bar which slides between the two extremes of Required and Forbidden. For folder f, this weight is the probability P(Wi = true | F = f) where Wi is the random variable for the ith word and F is the random variable for the folder. Since P(Wi = false | F=f) =
1.0-P(Wi = true | F = f), the position of the bar can be interpreted in two ways. The higher the top of the bar, the more important the presence of the word is to the prediction. Alternately, the lower the bottom of the bar, the more important the absence of the word is to the prediction.
Answering: "Why won't this message be filed in X?"
If the current message is predicted to be filed under folder f, the user can ask why it won't it be filed in folder f'. The application answers this why question by displaying the two-bar graph shown in the middle image of Table 2. The two bars correspond to P(Wi = true | F = f) and P(Wi = true
| F = f') respectively. The purpose of this two-bar view is to allow the user to compare and contrast the importance of various words between the two folders. Furthermore, since the dual bar view only allows weights associated with the two folders f and f' to be manipulated, we can illustrate the degree that an email "belongs" to either folder f or f' based on the magnitude of P( F = f' | W1, …, Wm) and P( F = f |
W1, …, Wm) respectively. For instance, if folder f is the originally predicted folder for the email and P( F = f' | W1,
…, Wm) > P( F = f | W1, …, Wm) after the user interacts with the visualization, then the email will be filed under folder f'.In the visualization, we can illustrate the degree to which an email "belongs" to folders f and f' using the arrow shown at the bottom of Figure 1.
THE STUDY
Using a prototype of the above approach, we conducted a formative study. Our purpose was not to validate the approach, but rather to investigate fundamental issues relating to barriers and their impact on end users attempting to debug a machine-learned program.
The study involved a dialogue-based think-aloud design, in which two users verbally expressed their thoughts to each other while collaborating on a task. This encouraged participants to voice their reasoning and justifications for actions via typical social communication with their partners.
The participants consisted of 6 pairs of female and 5 pairs of male students with an even distribution of GPA, years in university, and email experience across gender. All participants were required to have previous email experience but could not have a computer science background. In order to eliminate a lack of familiarity with each other as a source of noise in our data, pairs had to know each other prior to the study and sign up together. Pairs also had to be same-gender, so that we could clearly identify any gender differences that might arise.
We ran the study one pair at a time. Each session started with the participants completing a questionnaire, which asked for background information and gathered pre-session self-efficacy data [6]. We then familiarized the pair with the software and examples of classification through a 20-minute hands-on tutorial. For the main experiment task, participants were asked to imagine that they were co-workers in a corporate department at Enron. Their department included a shared e-mail account to provide easy access to work communications that affected all of them. The premise was that new e-mail software had recently been installed, featuring the ability to learn from the users and automatically classify messages into a set of existing folders. They were told that their supervisor had asked them to get messages from the Inbox into the appropriate folders as quickly as possible, doing so in a way that would help improve later classification.
We used the publicly available Enron e-mail data set in our experiment. To simulate a shared mailbox, we combined messages from three users (farmer-d, kaminski-v, and lokay-m) that they had originally filed into five folders (Bankruptcy, Enron News, Personal, Resumes, and Systems). At the start of the experiment, each folder held 20 messages; these were used to initially train both the classifier and the participants about how messages were to be filed. The Inbox contained 50 messages for the participants to work on.
individually filled out a post-session questionnaire gathering their feedback and post-session self-efficacy.
DIALOGUE ANALYSIS METHODOLOGY
To analyze the dialogue, we developed two code sets (Table 3), capturing barriers and debugging activities. Regarding barriers, Ko et al. identified six types of learning barriers experienced by novice programmers using a new programming environment [11]. These barriers are appropriate to our investigation because our participants, like theirs, were problem-solving about how to make programs work correctly and were inexperienced with the provided facilities for debugging. The first five barrier names and the definitions as they apply to our environment are in Table 3. We did not use Ko et al.'s sixth barrier, searching for external validation, because all problem solving in our experiment was based on facts internal to our environment. Regarding debugging activities, previous research [7, 10] identified six common actions in fixing bugs in programming environments. We applied the two of these not involving data structuring or editing source code, and also introduced a fault detection code. These codes are also given in Table 3.
We then applied the codes to "turns". A turn consisted of sentences spoken by a participant until his/her partner next spoke. Speech by one participant that contained a significant pause was segmented into two turns. Coding iteratively, two researchers independently coded a 5-minute random section of a transcript. We calculated similarity of coding using the Jaccard index (dividing the size of the intersection of codes by that of the union). Disagreements led to refinements in coding rules, which were then tested in the next coding iteration. Agreement eventually reached 82% for a 5-minute transcript section, and 81% for a complete 40-minute transcript. Given this acceptable level
of reliability, the two researchers then divided up the coding of the remaining transcripts.
Code Meaning
Design Barrier Doesn't know how, where, or whether to give feedback. "Can we just click File It?" Selection
Barrier
Knows what to do, but not which object to change. "What kind of words should tell the computer to [file this] to Systems?"
Coordination Barrier
Doesn't understand how changes affect the rest of the system. "Why... why it won't go to Personal..."
Use Barrier Does not know how to determine the best weight of words. "So is [this word] 'unimportant'?"
Understanding Barrier
Doesn't understand system's feedback. "Why is 'web' more forbidden for [the] Systems [folder]?"
Fault Detection Noticing an incorrect folder choice by the system. "It's going to [the] Systems [folder]; we do not want Systems."
Diagnosing Figuring out the specific cause of a detected fault. "Well, 'e-mail' needs to be higher." Hypothesizing Proposing a general solution for a detected
[image:6.612.52.301.54.292.2]fault. "Let's move something else, and then maybe it'll move [the e-mail] to Systems."
Table 3: Coding scheme used in this study.
RESULTS
Barriers Encountered
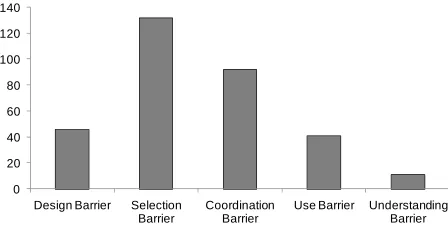
Participants ran into an average of 29 barriers during the 40-minute study (with a range from 7 to 66). Barriers were equally likely to be encountered at the beginning and end of the study. It is important to note, however, that everyone hit barriers, and some encountered them very frequently, underscoring the importance of addressing barriers in fixing machine-learned programs.
As Figure 2 shows, the most frequent barriers were
Selection barriers (40.99% of all barriers encountered). This type of barrierrelates to the difficulty of finding the right words or messages to modify to give feedback to the system, for example:
P712: "Then 'news'? Well, they like team players. Contributions? That would be more that you'd use for news then Systems."
Coordination barriers also arose often (28.57% of all barriers). Participants often wondered how the feedback they were about to give would change system behavior or why the system had responded to feedback as it did:
P732: "Resume? [user finds word, makes 'resume' required] Why didn't it change it? How about university?"
The fact that Selection and Coordination barriers accounted for the most observed barriers is confirmed by the questionnaires, where 16 of 22 respondents (72%) mentioned difficulty in determining which words were important when fixing misclassified mail. The prevalence of these types of barriers suggests the need for intelligent user interfaces to be able to direct end users to the most useful places to give feedback, such as which words will have the strongest effect on message reclassification.
Participants ran into Design and Use barriers less frequently (14.29% and 12.73%, respectively). While these barriers should not be neglected, the predominance of
Selection and Coordination barriers suggests that end users may have less trouble deciding on a strategy for how to give feedback (Design and Use), than on where to give
0 20 40 60 80 100 120 140
Design Barrier Selection Barrier
Coordination Barrier
Use Barrier Understanding Barrier
[image:6.612.323.547.583.702.2]feedback (Selection and Coordination).
0 2 4 6 8 10 12 14 16
Design Barrier Selection Barrier
Coordination Barrier
[image:7.612.334.545.55.205.2]Use Barrier Understanding Barrier
Figure 3: Average number of barriers per session encountered by males (dark bars) and females (light bars).
Gender Differences in Barrier Encounters
Males and females did not experience the same number of barriers: females encountered more barriers (average of 33.3 per session) than males (average 24.4 per session). This difference was despite the fact that males talked more (and thus had more opportunities to verbalize barriers) than females, averaging 354.6 turns per session, compared to 288.1 for females.
Figure 3 shows the average barrier count per session for intuitive clarity; the same differences were observed when comparing the average counts per turn. Females experienced more barriers in almost every category except
Coordination, where there was no difference, and
Understanding, where the situation was reversed. Selection
barriers, the most common barrier type, had a very large difference: females averaged 14 per session, about 1.5 times more than the male average of 9. Design barriers, too, exhibited a strong contrast, with the female average of 5.33 per session versus the male 2.8.
One reason for these differences may be that females
expected more problems, due to lower self-efficacy (a form of self-confidence specific to the expectation of succeeding at the upcoming task [1]). Females began the experiment with lower self-efficacy than males, scoring an average of 38 vs. 42.1 for males (via a self-efficacy question set [6]). Even with our small sample, this difference was significant (Wilcoxon Rank-Sum Test: z=-2.64, p<.01). This is consistent with similar self-efficacy differences for end users engaging in other complex computer tasks [3, 9, 24]. Our results about differences in barriers is consistent with this prior research in another aspect, too: these prior works showed gender differences in both features used, and the strategies by which end users tried to fix errors in spreadsheets.
Another reason for the gender dissimilarity may be due to differences in information processing. For example, work on the selectivity theory of information processing [17] has shown a number of differences in how males and females process information. According to this theory, females are more likely to work with information comprehensively, whereas males are more likely to pursue the first few portions of information and then move on. The following quotes illustrate the tendency of female pairs to examine several words at a time, versus males' propensity for moving on as quickly as possible:
Female Pair
P1131: "So that's really important. And then, um, probably 'updates' would be important. And then, um... virus?"
P1132: "Yeah. And then, uh, 'login'."
Male Pair
P1211: "It's correct. It's learned something, eh." P1212: "Um hmm."
P1211: "Lets go to the next message."
This theory is also consistent with our data, which revealed that females worked with a larger set of words than males did (106 unique words for females vs. 62 for males), perhaps to perfect the algorithm's performance. Males may have been more inclined to move on to the next message as soon as they obtained the desired effect.
Barriers and Transitions
When a participant encountered a barrier, what happened next? To answer this question, we investigated patterns in barrier transitions, that is, determining the subsequent barriers and activities to which a participant transitioned after encountering each type of barrier. Barriers/activities coded in participants’ verbalizations are simply states between which they can transition. To calculate the probability of each state (barrier or activity) following an initial barrier, we divided the subsequent states by the total number of states that followed the initial barrier. For example, if Selection followed Design once and
Diagnosing followed Design twice, then the probability of
Selection following Design was computed as 1/(1 + 2) = .33, or 33%, and the probability of Diagnosing following
Design was computed as 2/(1 + 2) = .66, or 66%. We use these probabilities for intuitive clarity only. Our graphs show the exact number of instances for completeness. Despite these numerical summaries included for clarity, note that the lack of preconceived hypotheses make inferential statistics on these data inappropriate, and we do not make them.
The distribution of transitions from Design barriers (Figure 4) was the most uniform of the barriers, especially for females. Subsequent Coordination barriers were most frequent, averaging 19.05% over all transcripts, but Design, Selection, Fault Detection, Hypothesizing, and Diagnosing
each followed this barrier at least 10% of the time. Males, however, followed Design barriers with some form of debugging activity an average 70% of the time, versus 46.88% for females.
barriers were either quickly overcome and led to
Diagnosing, or they cascaded, stalling participants. The relatively high instance of Selection barriers stalling participants suggests the need for machine-learned programs to point out which words or features would be most likely to change the program's behavior; we will discuss how this might be done in the Challenges for Machine Learning section. These participants, for example, could have benefitted from this sort of help:
P732: "And what about 'interview'? Oh, we just did that, so no. 'Working', maybe?" [finds word]
P731: "Well, no because 'working' could be used for anything really."
P732: "True." P731: "'Work', no."
P732: "What about... [scrolls left] 'scheduling'. No, that could be News."
P731: "That could be News, too." P732: "What about 'scientist'?" P731: "That could be Personal."
Males had a higher tendency of Hypothesizing following a
Selection barrier than females, 26.67% to 11.76%. Recall that Hypothesizing was coded when the pair discussed a possible fix but didn't include a specific word, whereas
Diagnosing indicates that the pair specified the word they intended to modify. Thus, males were more likely to follow a Selection barrier with a general solution, while females tended to first agree on a word to alter.
Like Selection barriers, Coordination barriers often led to
Diagnosing (30.95%) (Figure 6). Taken together with the other two debugging actions, Fault Detection (14.29%) and
Hypothesizing (20.24%), this barrier was followed by a debugging action 65.48% of the time. Males, however,
tended to follow Coordination barriers with more
Diagnosing than females (47.22% vs. 18.75% respectively), whereas females followed them with more
Hypothesizing than males (29.17% vs. 8.33%). Essentially, after having trouble coordinating changes to one area of the machine-learned program with other sections of the application, females frequently proposed a generic solution, whereas males tended to fix specific things. This appears to be yet another indication of the comprehensive problem-solving strategy associated with females [17], providing further evidence of the need to support both comprehensive and non-comprehensive problem-solving strategies.
Finally, Use barriers were strongly tied with Diagnosing
(44.12%); all the other transitions were below 15%. It seems that when a Use barrier was encountered, our participants' response was to adjust their specific solution, rather than move on to a different problem or generalize a solution. This appeared to be equally the case for males and females.
Gender Differences in Debugging Feature Usage
Previous researchers have reported gender differences in usage of debugging features in spreadsheets [3, 9, 25], and our data revealed that males and females used debugging features for the learned email program differently as well. Specifically, when interacting with the keyword bar graph (which was their only explicit way of specifying logic changes to the classifier), there were three differences between males and females.
The first difference was identifying the fault. The primary way to pursue a fault was to ask a "Why isn't this message in this folder?" question, since that was the way to bring up the bar graph showing the importance of words to both the
faulty and the desired folder (Figure 1, top right). Females asked considerably more of these "Why isn't this message in this folder?" questions than males did (average 12.16 per session for females, 9.6 for males).
The second difference was in the comprehensiveness with which males and females considered the state of the machine-learned program. Specifically, scrolling through the bar graph (in answer to the above why question) allowed the current weights of words, respective to folders, to be compared. Females scrolled through the bar graph more than twice as much as males (average of 189.3 scrolling movements for females per session vs. 89 for males), clearly demonstrating more comprehensive consideration of the words and their weights.
The third difference was in explicitly debugging the logic, i.e., adjusting the weights of the words. Logs of participants' actions revealed that females made more edits to words and their weights in the keyword bar graph than males (average 38.83 per session for females, 34 for males) in their debugging.
These differences in using specific features to effect changes to the program are corroborated by what the participants said about debugging: females’ verbalizations included more Fault Detection (average of 14.33 per session vs. 8.8 for males), more Hypothesizing (13.33 vs. 8.6) and slightly more Diagnosing (28.66 vs. 26.6) than males. These differences were despite males’ greater number of total verbalizations.
Males, on the other hand, focused more on filing messages in the present, with less regard for debugging to improve the future: they filed more messages away (average 15.4 per session) than females (average 11 per session), and dragged more messages directly to folders (average 4.2 per session for males, 2 per session for females).
There are several possible explanations for this behavior. Females' interest in more of the words is consistent with Meyers-Levy's work reporting females' greater tendency to process more information [17]. Our own prior work has also found gender differences consistent with this theory when end users debug spreadsheets [24]. Females may have also exhibited a greater responsiveness to social norms and obligations, as one participant articulated:
P512: "But if the computer does not learn from this, then the next group that comes in after us will have to do the same thing."
An important difference between adjusting words via the bar graph (done more by females) and filing or dragging messages (done more by males) was reversibility; word adjustments could be reset to their original values with the click of a button, but, as was emphasized during the tutorial, messages could not be moved once filed. This created a risk related to filing that did not exist with manipulating words. Our findings thus are consistent with existing literature reporting that females are more risk
averse than males (discussed in [3]). This suggests the need for features to lower perceived risk, such as the addition of an "Unlearn" capability.
CHALLENGES FOR MACHINE LEARNING Supporting The Why Questions
Can any machine learning algorithm provide informative and efficiently computed answers to these or other "Why" questions? Can a general "recipe" be used by any machine learning algorithm to answer these questions? For the "Why won't this message be filed to X?" question, the strategy employed by naïve Bayes can be easily extended to any other classifier. The "Why will this message be filed to X?" question is somewhat more restrictive. Any linear additive classifier of the form ,where wi is the ith weight and fi is the ith feature, can be visualized as a bar graph. Apart from naïve Bayes, many other machine learning algorithms are linear additive classifiers, including logistic regression, perceptrons, and linear support vector machines. The interpretation of the bar, however, will depend on the classifier, and the bar may not necessarily behave as the slider described above. Also, the bar graph visualization is more complicated to explain if the linear additive classifier requires regularization to deal with correlated features.
∑
i i i
f
w
In general, machine learning algorithms vary greatly in their comprehensibility and thus the bar graphs are not a one-size-fits-all solution. For instance, classifications by decision trees are visually understood while predictions from neural networks are much more difficult to explain. Furthermore, other machine learning algorithms are capable of providing much more in-depth explanations and can thus answer a greater range of "Why?" questions. As an example, Bayesian networks provide a sophisticated but computationally expensive mechanism for providing detailed explanations of how different pieces of evidence influence the final prediction made by the algorithm [13]. A current challenge for machine learning is to develop informative and efficiently computed explanations of statistical machine learning algorithms.
Sensitivity Analysis
One of the difficulties with visualizing a text classifier is the fact that there are approximately 16,000 features involved, where each feature corresponds to a word in the vocabulary. The sheer number of features makes finding a desired word in the bar graph particularly cumbersome for a user, even though we supported sorting by weight and by alphabetical order. Furthermore, modifying the weight on many of these words produces little or no change to the final prediction.
Bayesian network in response to changes to a single parameter in the network. The authors then develop bounds on the effect of these changes to the query. In future work, we will apply these bounds to the naïve Bayes classifier, which is a special case of a Bayesian network. The bounds will allow us to determine if a change to a parameter (i.e., the probability P(Wi | F)) has little or no effect on the predicted folder. We can then reduce the number of features displayed in the visualization by not displaying the bars which cause insignificant changes to the final prediction.
The Popularity Effect
Participants who concentrated on training the classifier to recognize emails for one specific folder at a time experienced a "popularity effect" in which the folder with the largest number of filed emails dominated the classifier's predictions for the rest of the emails in the inbox. This popularity effect is primarily caused by the high dimensional nature of the data, the relatively sparse training data, and the class imbalance of the email folders. These factors cause the classifier to overfit both the training data and the rich user feedback for the smaller folders.
To illustrate this point, suppose the user employs such a filing strategy. The dominant folder could be the Systems folder, which has keywords such as "Windows" and "McAfee" that are easily identified by the user. Once a large number of messages have been filed to the dominant folder and the classifier learns from this set of newly acquired training examples, the distribution for the dominant folder is accurately learned. However, the classifier is poorly trained on the non-dominant folders. In fact, the classifier overfits the training data for the non-dominant folders, and the rich user feedback for these folders may even exacerbate the overfitting. This overfitting makes all emails seem unlikely to be classified into the non-dominant folders, because they must match exactly the under-smoothed distributions for these folders. As a result, the classifier files many of the emails in the inbox under the dominant folder.
Although this can be remedied by providing sufficient training data for all folders, there remain some practical challenges: Specialized email folders tend to contain small numbers of emails, resulting in sparse training data for email classifiers, and email is known to be "bursty," with emails from a small handful of folders dominating the inbox at certain times. Due to the imbalance in the number of emails belonging to each folder, the popularity effect thus remains a real-world problem.
IMPLICATIONS AND CONCLUSIONS
In this paper we took a fresh look at end-user interactions with machine-learned programs. Efforts by end users to change the program's logic can be viewed as debugging, and taking this view, we developed a "Why-oriented" approach to support end users debugging these programs.
Using this approach as a basis for our investigation, our study revealed barriers faced by end users debugging machine-learned programs, as well as challenges for the design of the machine learning algorithms supporting such programs. Our primary results were:
• Every participant encountered barriers while debugging the learned program, demonstrating that these barriers present real obstacles for end users debugging in this domain.
• Selection and Coordination barriers were the most frequent obstacles to debugging the learned program. The sheer number of these instances strongly suggests the value of providing end users with information about where to give feedback to the machine-learned program in order to debug effectively. Sensitivity analysis may help to focus the end-user on where changes should occur.
• Gender differences were present in the number of barriers encountered, the pattern of barriers, and usage
of debugging features. These differences, and their ties to theories explaining possible roots, suggest that debugging tools for learned programs must support both comprehensive and non-comprehensive debugging strategies.
• Class imbalance can cause problems for end users interacting with machine learning algorithms, interfering with their preferred debugging strategies.
These results start us down a path to effectively supporting end-user debugging of machine-learned programs. Overcoming these barriers, both for the end user and the machine, will be an important step towards rich, intelligent guidance for intelligent user interfaces.
ACKNOWLEDGMENTS
We thank the participants of our study, along with Joe Markgraf, Amber Shinsel, and Akshay Subramanian for their assistance. This work was supported by NSF IIS- 0803487 and by the EUSES Consortium via NSF CCR-0325273.
REFERENCES
1. Bandura, A. Self-efficacy: Toward a unifying theory of behavioral change. Psychological Review 8, 2 (1977), 191-215.
2. Becker, B., Kohavi, R., and Sommerfield, D. Visualizing the simple Bayesian classifier. In Fayyad, U, Grinstein, G. and Wierse A. (Eds.) Information Visualization in Data Mining and Knowledge Discovery, (2001), 237-249.
3. Beckwith, L. Burnett, M., Wiedenbeck, S., Cook, C., Sorte, S., and Hastings, M. Effectiveness of end-user debugging software features: Are there gender issues?
Proc. CHI (2005), 869-878.
paradigm. International Conference on Software Engineering, 2003, 93-103.
5. Chan, H. and Darwiche, A. When do numbers really matter? Journal of Artificial Intelligence Research, 17
(2002), 265-287.
6. Compeau, D. and Higgins, C. Application of social cognitive theory to training for computer skills.
Information Systems Research, 6,2 (1995), 118-143. 7. Davies, S.P. Display-based problem solving strategies
in computer programming, Proc. Wkshp. Empirical Studies of Programmers, Ablex, (1996), 59-76.
8. Glass, A., McGuinness, D. and Wolverton, M. Toward establishing trust in adaptive agents, Proc. IUI (2008), 227-236.
9. Grigoreanu, V., Cao, J., Kulesza, T., Bogart, C., Rector, K., Burnett, M., Wiedenbeck, S. Can feature design reduce the gender gap in end-user software development environments? Proc. VL/HCC 2008, IEEE, (2008).
10. Ko, A. and Myers, B. Designing the Whyline: A debugging interface for asking questions about program behavior. Proc. CHI (2004), 151-158.
11. Ko, A., Myers, B., and Aung, H. Six learning barriers in end-user programming systems. Proc. VL/HCC 2004, IEEE Computer Society (2004), 199-206.
12. Kononenko, I. Inductive and bayesian learning in medical diagnosis. Applied Artificial Intelligence, 7, (1993), 317-337.
13. Lacave, C., and Diez, F. A review of explanation methods for Bayesian networks. The Knowledge Engineering Review, 17, 2, Cambridge University Press, (2002) 107-127.
14. Lieberman, H. (ed.) Your Wish is My Command: Programming By Example, Morgan Kaufmann Publishers, Inc (2001).
15. Little, G., Lau, T., Cypher, A., Lin, J., Haber, E., and Kandogan, E. Koala: Capture, share, automate, personalize business processes on the web. Proc. CHI
(2007), 943-946.
16. McDaniel, R. and Myers, B. Getting more out of programming-by-demonstration, Proc. CHI (1999), 442-449.
17. Meyers-Levy, J. Gender differences in information processing: A selectivity interpretation. P. Cafferata & A. Tybout, (Eds) Cognitive and Affective Responses to Advertising, Lexington Books (1989).
18. Myers, B., Weitzman, D., Ko, A., and Chau, D. H., Answering why and why not questions in user interfaces. Proc.CHI (2006), 397-406.
19. Patel, K., Fogarty, J., Landay, J., and Harrison, B. (2008). Investigating statistical machine learning as a tool for software development. Proc. CHI (2008), 667-676.
20. Poulin, B., Eisner, R., Szafron, D., Lu, P., Greiner, R., Wishart, D. S., Fyshe, A., Pearcy, B., MacDonnell, C., and Anvik, J. Visual explanation of evidence in additive classifiers. Proc. IAAI, (2006).
21. Russell, S. J., and Norvig, P. Artificial Intelligence: A Modern Approach. Upper Saddle River, NJ: Prentice Hall. 2003.
22. Stumpf S., Rajaram V., Li L., Burnett M., Dietterich T., Sullivan E., Drummond R., Herlocker J. Toward harnessing user feedback for machine learning. Proc. IUI (2007), 82-91.
23. Stumpf, S., Sullivan, E., Fitzhenry, E., Oberst, I., Wong, W.-K., and Burnett, M. Integrating rich user feedback into intelligent user interfaces. Proc. IUI
(2008), 50-59.
24. Subrahmaniyan, N, Beckwith, L, Grigoreanu, V., Burnett, M., Wiedenbeck, S., Narayanan, V., Bucht, K., Drummond, R, and Fern, X. (2008). Testing vs. code inspection vs. ... what else? Male and female end users' debugging strategies. Proc.CHI (2008), 617-626. 25. Vander Zanden, B. and Myers, B. Demonstrational and constraint-based techniques for pictorially specifying application objects and behaviors. Transactions on Computer-Human Interaction,2,4 (1995), 308-356. 26. Wagner, E., Lieberman, H. Supporting user hypotheses