This is a repository copy of Measuring determinants of post-compulsory participation in science: a comparative study using national data.
White Rose Research Online URL for this paper: http://eprints.whiterose.ac.uk/76190/
Version: Accepted Version Article:
Homer, MS orcid.org/0000-0002-1161-5938, Ryder, J orcid.org/0000-0002-2741-0152 and Banner, I (2014) Measuring determinants of post-compulsory participation in science: a comparative study using national data. British Educational Research Journal, 40 (4). pp. 610-636. ISSN 0141-1926
https://doi.org/10.1002/berj.3106
eprints@whiterose.ac.uk https://eprints.whiterose.ac.uk/
Reuse
Items deposited in White Rose Research Online are protected by copyright, with all rights reserved unless indicated otherwise. They may be downloaded and/or printed for private study, or other acts as permitted by national copyright laws. The publisher or other rights holders may allow further reproduction and re-use of the full text version. This is indicated by the licence information on the White Rose Research Online record for the item.
Takedown
If you consider content in White Rose Research Online to be in breach of UK law, please notify us by
Measuring determinants of post-compulsory
participation in science: a comparative study using
national data
Page 1 of 49
Matt Homer1, Jim Ryder, Indira Banner
Abstract
Increasing post-compulsory participation in science and science-related subjects is
seen as a key education policy priority in England and more widely. This paper uses
descriptive analysis of national data to investigate the effects of science attainment
at 16, gender, socio-economic status, and school science pathway on progression
into post-16 traditional and vocational science courses in state funded schools in
England. Comparisons are also made with progression into non-science subjects
(history, mathematics and psychology). Multi-level statistical modelling is employed
to provide independent estimates for all these effects, whilst also taking into account
mathematics attainment at 16, and whether or not the 14-16 school also teaches to
18.
The key findings of the descriptive analysis are that progression rates vary widely
across post-16 sciences in terms of both gender and socio-economic status, but that
other subjects too vary in these regards. Once prior attainment is accounted for, the
gender differences across science and some other subjects largely remain but those
due to socio-economic status are to some extent ameliorated. In terms of school
science pathways, those students doing ‘more’ science at 14-16 are found to be
more likely to progress to traditional science post-16. The statistical modelling further
1
Page 2 of 49
quantifies the relative importance of each of these effects in determining progression
and shows how, in comparison to other courses, there is more variation at the school
level in progression to vocational sciences. Further, the determinants of participation
in these vocational sciences courses are of a different character to the
non-vocational sciences.
Key words
post-compulsory science participation, national data, multi-level modelling
Introduction
Policy background
Since the introduction of the national curriculum in schools in England from 1989, the
study of elements of the three separate sciences has been compulsory for all
students in state maintained schools. However, once students reach age 16 this is
no longer the case and students remaining in education post-16 can choose whether
or not they include any science subjects as part of the mix of courses they might
study. In England there has been an ongoing concern for many years with the
number of students studying sciences post-16, and this is particularly true of the
physical sciences (Gill & Bell, 2011; Gorard & See, 2009; The Royal Society, 2011).
The concern centres on the view that a strong science base and the adequate
supply of scientist are key determinants of a successful modern economy, one that is
able to successfully compete on the global stage (HM Treasury et al., 2009). 2
2
Page 3 of 49
In part as a response to these long-term concerns, a major reform of the 14-16
science curriculum in England in 2006 stated as one of its key longer term aims to
increase the participation in post-compulsory sciences, thereby ensuring the
adequate supply of scientists and engineers (DfES, 2005; Ryder & Banner, 2010) .
Whilst this reform has a diversity of aims, a key aspect at 14-16 is to engage more
students in doing more science through the inclusion of elements of scientific
literacy, the study of the nature of science, and the discussion in science lessons of
socio-scientific issues (Banner et al., 2010; Millar, 2006). In the classroom, these
changes promote a move towards more discussion and consideration of ethical
issues, together with a greater understanding of ‘how science works’, and were
intended to make school science more appealing and therefore increase students’ disposition towards science. This in turn might encourage more students to continue
studying science post-16, particularly those from traditionally under-represented
sub-groups (Ryder & Banner, 2010).
In 2008, shortly after the 2006 curriculum reform, a policy of an entitlement to study
the separate sciences (GCSEs3 in biology, chemistry and physics – collectively
known as Triple award) at 14-16 was also introduced for highly achieving students
(HM Treasury et al., 2009; Fairbrother & Dillon, 2009). 4 Again, the aim was to
3
Students take a number of GCSEs (General Certificates of Secondary Education) typically at age 14-16. Progression to post-16 courses is often dependent on sufficiently high attainment in particular GCSEs.
4
Page 4 of 49
encourage more students to do more science at 14-16, with the expectation that this
could lead to higher participation rates in post-16 sciences. As Fairbrother & Dillon
(2009) point out, there is, however, evidence that for some students doing more
science at 14-16 could have the opposite effect to that intended.
In light of these policy developments, and the relatively high profile that science
education continues to play in the national and political discourse, it is natural to ask
what, according to national data, are the key determinants of whether or not students
continue their science studies post-16. With the first post-2006 cohort having now
completed their two-year post-16 courses, this paper provides a quantitative
snapshot of these determinants. In time, comparisons with later cohorts will provide
insight into if and how these determinants are changing as the system evolves. A
brief survey follows of what is known about these issues from the literature; the full
aims and scope of the paper are then detailed.
Key determinants of post-compulsory science participation
Some important influences on continuing the study of science post-16 are
well-known. Research review articles in this area include those of Tripney et al. (2010),
Wynarczyk & Hale (2011) and Boe et al. (2011). In addition, a recent European
research collaboration5 (IRIS) has demonstrated how these issues extend across
some other non-GCSE qualifications). Homer et al. (2011b) has more details of the nature of these science options at 14-16, and of their take-up over a five year period to 2010.
5
Page 5 of 49
different countries within Europe and beyond (Henriksen, Dillon, & Ryder,
forthcoming). This body of work shows that students with more positive experiences
of, and dispositions towards, school science are more likely to continue studying
science post-16 (Osborne, Simon, & Collins, 2003, Hazari et al). However, it is also
clear that such positive experiences do not necessarily lead to post-16 participation;
liking science is not of itself sufficient. Awareness of the extrinsic benefits of post-16
science courses, such as its contribution in progression into secure and well-paid
employment, is also important (Mujtaba & Reiss, 2012). The role of ‘significant
adults’, such as a family member or teacher, in encouraging consideration of a post
-16 science pathway is also often critical (Archer et al., 2010). Within this, the role of
the teacher, and associated teaching approaches, are central to the development of
positive dispositions. The interplay of personal student dispositions and broader
socio-cultural factors highlights the significance of ‘student identity’ in relation to
subject choice, with many students seeing science as ‘important, but not for me’
(Archer et al., 2012; Jenkins & Nelson, 2005). More recent research has
demonstrated the extent to which subject choice is a process that takes place over
time, rather than being a decision made at a particular point, and that dispositions
not to pursue science future science can be set early within compulsory schooling
(Maltese & Tai, 2010). Furthermore, such choice processes continue beyond key
decision points, leading many students to choose to leave, or consider leaving,
post-16 science courses before they have been completed (Henriksen et al.,
forthcoming).
Page 6 of 49
Whilst recognising this broad set of interacting factors, and their interplay over time,
the focus of this paper is on determinants of participation that are available in
existing national data for England. The crucial role that prior attainment has on
post-compulsory choices is clear (Rodeiro, 2007). Beyond attainment, there is the varying
role of gender, where girls are more likely to take up biology A-level6 compared to
boys, whereas they are very much less likely to take-up A-level physics (Mujtaba &
Reiss, 2012; Smith, 2011b). Studies have also shown that students from lower
socio-economic backgrounds tend not to choose science post-16 (Gorard & See, 2009)
although, this is to some extent driven by the lower average attainment of students
from poorer backgrounds. In addition, the impact of the nature of the science course
studied at 14-16 is also likely to affect post-16 science study. Following the ‘push’ for Triple award in England, there has been a large increase in the proportion of
students taking this pathway, and a consequent decline in the proportion taking Dual
award (Homer et al., 2011a). Whilst it is probable that students are more likely to
continue studying science post-16 having done Triple award, there has only been
only limited recent work (Broeke, 2010; Gill & Bell, 2011) quantifying some of these
effects, and little investigation of vocational science and other non-science courses
with regard to influences on progression.
6
Page 7 of 49 This study
This paper uses national data to first investigate descriptively how progression to
post-16 science courses varies by a range of student characteristics: prior science
attainment at 16, gender, measures of socio-economic status and 14-16 science
pathway. In a second analysis, using statistical modelling, these effects are
investigated together, alongside two additional measures: (i) prior attainment in
mathematics, as it is recognised that success in mathematics is commonly seen as
an important precursor to continuation of study in science beyond 16, especially for
physics (Gill & Bell, 2011); and, (ii) if the 14-16 school also teaches up to age 18; this
might, in part, be an important influence on student progression for some courses
(Bennett et al., 2011). This quantitative analysis is part of a larger project, the
Enactment and Impact of Science Education Reform (EISER), a three-year
longitudinal study involving database analysis alongside more in-depth school-based
case studies using qualitative methodologies7.
As well as including the three most popular separate sciences A-levelsin this
progression study (biology, chemistry and physics), attention is also given to two
post-compulsory vocational science courses that are rarely included in academic
studies; Applied science A-level and BTEC National Award Applied Sciences. The
former of these has a focus on how science is applied across a mixture of industries
and professions but, in common with other A-levels, is assessed largely through
formal examinations. The latter is designed as training towards particular scientific
7
Page 8 of 49
careers, and is assessed through a mixture of criterion referenced tasks including
projects, case studies, performance observations and time-constrained
assessments.
To assess the extent to which influences on progression are unique to science, this
study also analyses progression to three other popular non-science subjects –
A-levels in history, mathematics and psychology. These subjects were chosen partly
on the basis of popularity in terms of national uptake in England8, but also because
they vary in terms of when studying them as separate subjects usually begins. At
14-16 in England, students do not generally study psychology at all, whereas history is
optional at this age but mathematics is compulsory up to 16. Of course, within the
sciences, mathematics as a discipline plays a special role since post-16 students
studying physics, and to a lesser extent chemistry, might also be encouraged or
expected to study some mathematics.
8
Page 9 of 49
The key research questions this paper addresses are:
What is the degree of differential participation (i.e. stratification) by gender,
socio-economic status and 14-16 science pathway in post-16 science
courses, and how do the non-science courses compare in this regard?
To what extent is any stratification due to differential prior attainment in
science across sub-groups (e.g. girls, students from lower socio-economic
backgrounds)?
What are the independent effects of students and school characteristics on
participation in science, and in comparator subjects?
What are the strengths and weaknesses of this kind of analysis based on
national data?
The paper quantifies the independent influences on post-compulsory participation
across a wide range of science courses, both academic and vocational, and across
select non-science comparators. It complements other more focussed and/or
qualitative research, and aims to give policy makers and other stakeholders a better
understanding of the current national picture, in order to provide new insights into
how policy changes at 14-16 might impact on post-16 participation in science.
Whilst this study investigates progression, it is hoped that a follow-up study will use
similar data to investigate the influences on attainment in science post-16, and in
Page 10 of 49
Methods
National data for England
This study follows a single national cohort of students who completed their
compulsory education in 2008 at age 16. It investigates whether or not they were
then awarded, up to two years later (by 2010), any of the post-compulsory
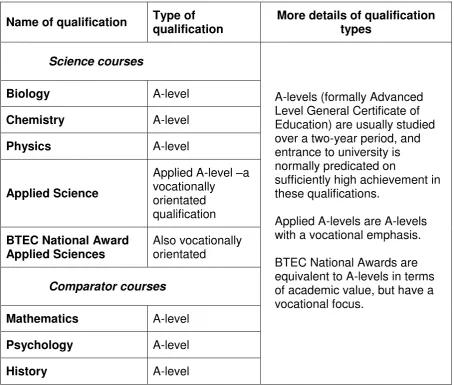
qualifications listed in Table 1.
Name of qualification Type of qualification
More details of qualification types
Science courses
A-levels (formally Advanced Level General Certificate of Education) are usually studied over a two-year period, and entrance to university is normally predicated on
sufficiently high achievement in these qualifications.
Applied A-levels are A-levels with a vocational emphasis.
BTEC National Awards are equivalent to A-levels in terms of academic value, but have a vocational focus.
Biology A-level
Chemistry A-level
Physics A-level
Applied Science
Applied A-level –a vocationally
orientated qualification
BTEC National Award Applied Sciences
Also vocationally orientated
Comparator courses
Mathematics A-level
Psychology A-level
[image:11.595.66.521.281.666.2]History A-level
Page 11 of 49
The data for the study is from the National Pupil Database (NPD)9, which contains
student and school level assessment data from all maintained schools and colleges
in England. Data from the NPD has been widely used in academic studies
investigating aspects of participation and attainment in science, and other subjects
(Homer et al., 2011a; Homer et al., 2011b; Noyes, 2009; Gill & Bell, 2011).
The NPD only contains information on qualifications actually awarded rather than
courses started but never completed. Hence, the terms ‘participation’ and
‘completion’ are used synonymously throughout this paper, as are ‘course’ and
‘qualification’. The NPD also contains student personal characteristics (e.g. gender
and free school meal eligibility, an indicator of socio-economic status), and
school-level measures such as the age-range the school/college caters for.
Descriptive analysis
Descriptive statistics detail the percentage participation within each post-16 course
(Table 1) by particular student-level characteristics: gender, free-school meal
eligibility and 14-16 science pathway. This initial analysis reveals the extent to which
these student characteristics impact on national participation rates in the
post-compulsory courses.
Progression to post-16 courses is to an extent predicated upon sufficiently high
attainment at age 16 in relevant 14-16 courses. In an attempt to control for this
9
Page 12 of 49
confounding factor, a descriptive analysis parallel to that above is carried out for the
sub-set of students who attained relatively highly in science at 16.
Modelling participation
It is recognised that calculating frequencies and proportions will only take one so far
in terms of understanding the key influences on progression to post-16 courses. For
each of the separate post-16 subjects listed in Table 1, a multi-level modelling
approach (Goldstein, 1995) is used to estimate the independent effect on
participation of each of a set of likely predictors, based on existing research
discussed in the Introduction. These include student-level measures of 14-16
attainment in science, 14-16 science pathway, gender and socio-economic status.
The full set of explanatory variables is listed in Table 2, which also gives further
Page 13 of 49
Predictor Type of
variable Further details
Mean prior attainment in science at 16
Continuous
Since students can do 1, 2 or 3 science qualifications (GCSEs) at 14-16 it is rational to use a mean value
across these to ‘score’ them on the same scale - see Homer (2011b) for more details on this issue. This scale is 0 (below GCSE) to 58 (mean grade A*) with 6 points between grades so that mean grade A=52, B=46 and so on.
Prior attainment in
maths at 16 Continuous
This is the GCSE points score the student achieved in mathematics. It is on the same scale as the prior attainment in science score (0 to 58)
Gender Dichotomous The reference group (coded 0) is female so the effect in
the model is for male (1).
Free school meal
eligibility (FSM) Dichotomous
This is a measure of socio-economic status based on whether the student is eligible and in receipt of free school meals (coded 1, eligible) or not (0).
Income deprivation affecting children index (IDACI)
Continuous
This is a second, distinct, measure of socio-economic status on a scale from 0.0 to 1.0 indicating the proportion of children under age 16 in the local area living in low income households. Lower values of this index relate to wealthier areas, and higher values to poorer areas.
14-16 science pathway: Triple award (TA)
Dichotomous
This indicates whether the student studied the three separate sciences at 14-16 (coded 1) or not (0). The reference group is those students who studied Dual award (DA).
14-16 science
pathway: Other Dichotomous
This indicates whether the student studied something other than TA or DA at 14-16 (coded 1) or not (0). Again, the reference group is those students who studied DA.
14-16 school also
teaches up to age 18 Dichotomous
[image:14.595.63.549.69.534.2]This indicates whether the 14-16 school also provides post-compulsory education up to age 18 (coded 1 for yes, and 0 for no).
Table 2: Predictors used in the multi-level logistic regression modelling
The multi-level model employed is a two-level random intercepts logistic regression
model with participation (Yes/No) as the outcome. This approach takes account of
the natural structure in the data with students (the lowest, level 1, units) nested in
schools (level 2 units). It results in a more accurate and insightful model compared to
Page 14 of 49
software (J Rasbash, Charlton, et al., 2009) is used for the estimation, with full model
details given in Appendix 1.
Odds ratios
For each predictor, the modelling produces an odds ratio estimate (Bland & Altman,
2000), from which the importance of the predictor in influencing participation can be
deduced. An odds ratio of exactly 1 implies that the predictor has no effect on the
outcome (doing or not doing the particular qualification), whereas an odds ratio
greater than 1 implies that cases with higher values of the predictor are more likely to
do the qualification, and an odds ratio less than 1 implies that this is less likely. See
Appendix 2 for more on interpreting odds ratios.
Variation at the school level
The multi-level modelling approach is used to account for the lack of independence
between students in the same school, but, importantly, also provides an estimate of
the proportion of the variance in the outcome (i.e. progression or not for each
course) that is at the school level, once all the predictors have been accounted for.
For each course (i.e. model), this gives an indication of the variation in progression
rates across schools nationally (i.e. the extent to which individual schools vary in this
regard). Hence, one can compare across courses the national ‘school effect’ on
progression.
Formally, this statistic is called the variance partition coefficient (VPC), and is
calculated as:
Page 15 of 49
based on an underlying latent variable approach (Goldstein, 1995, p110). Two
values of the VPC are given, one for a simple (null) model that includes no
predictors, and secondly for the full model when all predictors (Table 2) have been
included. These coefficients give an indication of the importance that schools are
making to the likelihood of participation in each course above and beyond any
predictors included in the modelling.
Limitations of the study
As already alluded to in the introduction, no attitudinal measures are available
national data, and this is an important but unavoidable limitation of this type of
analysis. Further, data from schools independent of state funding are not available,
and hence the analysis only includes maintained schools within England.
It is known that ethnicity play a complex role in educational attainment, and in
attitudes towards and decisions related to subject choices post-16 (Jones & Elias,
2005; Gorard & See, 2009; Strand, 2011; OECD 2007). However, for this study it
was decided not to include this student characteristic, partly for reasons of
parsimony, since variations in attainment by ethnicity are to a degree, but certainly
not completely, related to measures of socio-economic status which are included.
The influence of ethnicity on progression to post-16 science is worthy of a separate
study of national data on its own.
Finally, it is recognised that subject choices post-16 are not independent of one
another. In effect, students generally choose subject combinations, not individual
Page 16 of 49
quickly becomes large when considering national data. To keep the analysis
manageable, this study considers only progression to separate subjects rather than
to combinations, but it is recognised that this is an additional limitation of the study.
Results
Descriptive analysis
Table 3 shows the number of students completing a selection of post-16
qualifications in England. These include the three main A-level sciences, two
vocational science courses and three popular non-science A-level comparators (see
Table 1). For each course listed, the table also shows the percentage of females and
the percentage eligible for FSM completing each course, as well as a breakdown by
14-16 science pathway. The final two rows of the table give the overall percentages
for two base populations – (i) the combined group of students (n=127,819) who completed at least one of the post-16 qualifications listed in Table 1, and (ii) the
complete cohort at age 16, the end of compulsory schooling in England (n=606,618).
For each course, this allows for direct comparisons with the make-up of these two
Page 17 of 49
Cohort or qualification
Total number
of students
Percentage within row
Female FSM-eligible
14-16 science pathway
TA DA Other
Full cohort at 16 606,618 48.9 14.0 8.4 54.9 36.7
Post-16 science qualification
Biology 37,717 56.7 4.9 38.4 59.4 2.3
Chemistry 27,370 47.3 5.6 45.8 52.5 1.7
Physics 18,691 19.1 3.6 46.8 51.5 1.7
Applied Science 1,554 55.9 7.5 5.0 53.6 41.4
BTEC National Award
Applied Sciences 1,570 54.0 14.4 7.6 56.5 35.9
Post 16 comparator qualification
Mathematics 45,571 40.5 4.7 36.9 59.4 3.8
Psychology 42,974 73.9 6.2 16.2 73.3 10.5
History 33,238 51.8 3.8 21.1 70.1 8.8
Post 16 total
Group of students taking at least one of the eight courses above
[image:18.595.70.505.71.504.2]127,819 53.7 5.2 26.3 66.1 7.6
Table 3: Percentage female, FSM-eligible, from 14-16 science pathway
In terms of gender, Table 3 shows that female students are over-represented in the
majority of courses both in comparison with the 14-16 figure (48.9% female in the
final year of compulsory education) and also within the post-16 group of students
doing at least one of the courses listed (53.7% female in this group). This is
particularly true of biology (56.7%) and psychology (73.9%). In contrast, females are
strongly under-represented in physics (19.1%), and to a lesser extent in mathematics
Page 18 of 49
Turning to socio-economic status, FSM-eligible students are strongly
under-represented across the board in comparison with their overall presence at 14-16
(14.0%). Their weakest representation is in physics (3.6%), but they have a stronger
presence in the vocational courses, especially BTEC national award in applied
sciences (14.4%).
Finally, comparing 14-16 science pathways, Triple Award students are strongly
represented across all the traditional (i.e. non-vocational) A-level subjects in
comparison to at 16 (8.4% TA), and as one might expect this is particularly true in
the three sciences (38.4 to 46.8%). Conversely, TA students are relatively weakly
represented in the post-16 vocational courses (5.0 to 7.6%).
Controlling for prior attainment in science
Table 4 presents a similar analysis as in Table 3, but only includes the sub-sample of
students who were ‘highly’ achieving in science at age 16.The criteria for inclusion in this second analysis is to have obtained at least a (mean) grade of ‘B’ in science -
this is often the minimum requirement for acceptance on to A-level courses. 10 It is
acknowledged that the subsequent descriptive findings are partly conditioned by this
definition of ‘highly’ achieving in science – choosing a different threshold would impact on the exact figures.
10
Page 19 of 49
Cohort or qualification
Total number
of students
Percentage within qualification
Female FSM-eligible
14-16 science pathway
TA DA Other
Full cohort at 16 157,009 51.2 5.2 23.6 68.0 8.5
Post-16 science qualification
Biology 34,626 57.0 4.6 39.2 59.7 1.1
Chemistry 26,035 47.5 5.2 46.6 52.7 0.6
Physics 17,752 19.5 3.5 47.7 51.8 0.5
Applied Science 502 55.2 6.0 4.4 60.2 35.5
BTEC National Award
Applied Sciences 487 54.8 9.0 9.0 52.0 39.0
Post 16 comparator qualification
Mathematics 41,311 40.8 4.2 38.8 59.3 1.9
Psychology 26,714 73.4 5.0 19.4 74.2 3.0
History 22,900 53.5 3.0 25.2 70.0 4.8
Post 16 total
Group of students taking at least one of the above courses
[image:20.595.64.502.70.494.2]95,786 51.9 4.2 30.8 65.4 3.8
Table 4: Percentage female, FSM-eligible, from 14-16 pathway (amongst those
achieving mean grade B in science at 16)
To provide additional insight into the impact of taking prior attainment into account,
the figures from Tables 1 and 2 are represented together graphically in Figures 1, 2
and 3 showing the effect for gender, FSM-status, and 14-16 science pathway
Page 20 of 49
Figure 1: Percentage female within course/cohort
At 16 (the end of compulsory schooling), females make up 48.9% of the overall
cohort, but 51.2% of the higher achievers in science at this age. Females are 53.7%
of the group of students who took at least one of the courses listed in Table 1, but
form 51.9% of those who achieved highly in science. These figures imply that girls
are a little more likely than boys to participate in this set of post-16 courses, and that
taking into account prior attainment in science has little overall effect on any gender
effect in terms of progression. Across the individual post-16 courses, it is striking that
51.9 53.5 73.4 40.8 54.8 55.2 19.5 47.5 57.0 51.2 53.7 51.8 73.9 40.5 54.0 55.9 19.1 47.3 56.7 48.9
0 20 40 60 80
Group of students taking at least one of the above courses
History Psychology Mathematics BTEC National Award Applied
Sciences
Applied Science Physics Chemistry Biology Full cohort at 16
Percentage female
All students
Page 21 of 49
controlling for prior attainment in science consistently makes little difference to the
original variation in female participation rates. Hence, the strong
under-representation in physics and mathematics, and the over-under-representation in
psychology, remain having accounted for any differential prior attainment in science
[image:22.595.78.493.235.700.2]by gender.
Figure 2: Percentage FSM-eligible within course/cohort
4.2 3.0
5.0 4.2
9.0 6.0 3.5
5.2 4.6
5.2
5.2 3.8
6.2 4.7
14.4 7.5
3.6 5.6 4.9
14.0
0 5 10 15 20
Group of students taking at least one of the above courses
History Psychology Mathematics BTEC National Award Applied
Sciences
Applied Science Physics Chemistry Biology Full cohort at 16
Percentage FSM-eligible
All students
Those with mean science
Page 22 of 49
In the 14-16 cohort as a whole, 14.0% are FSM-eligible, but this drops to only 5.2%
for the high-science-achieving sub-group at this age. In terms of those going on to
study post-16 courses listed in Table 1, 5.2% are FSM-eligible, thus almost exactly
reflecting the proportion of high-science-achieving students at age 16. Further, only
4.2% of the higher-science-achieving students post-16 are FSM-eligible. Hence,
whilst FSM-eligible students tend to achieve relatively poorly at age 16, they do
progress to the set of post-16 courses at a rate similar to their representation in the
population having taken this into account.
At the subject level, a more nuanced picture emerges and whilst
under-representation remains, the strength of the effect is certainly weakened having
controlled for prior attainment. In physics (3.5% FSM-eligible) and history (3.0%)
there remains poor relative representation of FSM-eligible students once prior
attainment is accounted for, but in chemistry (5.2%), and especially the vocational
science courses (6.0 to 9.1%), they are perhaps over-represented. In biology (4.6%)
representation becomes broadly equitable having controlled for science attainment
Page 23 of 49
Figure 3: Percentage TA within course/cohort
Triple award (TA) students tend to be high achieving in both science and non –
science subjects (Homer et al., 2011b), and this is made clear when comparing the
TA proportion at age 16 (8.4%) with the TA proportion amongst those who achieved
highly in science at this age (23.6%). Within the post-16 population, 26.3% of
students had followed TA and 30.8% of the high-science achieving sub-group had
also. Hence TA students progress strongly into post-16 courses, and tend to be
amongst the highest (science) achievers at 16.
30.8 25.2 19.4 38.8 9.0 4.4 47.7 46.6 39.2 23.6 26.3 21.1 16.2 36.9 7.6 5.0 46.8 45.8 38.4 8.4
0 20 40 60
Group of students taking at least one of the above courses
History Psychology Mathematics BTEC National Award Applied
Sciences
Applied Science Physics Chemistry Biology Full cohort at 16
Percentage TA
All students
Those with mean science
Page 24 of 49
At the subject level, as might be expected, representation of TA in the three science
A-levels is strong, particularly for physics (46.8% TA) and chemistry (45.8%), and
accounting for prior attainment makes very little difference to these figures. TA
students are poorly represented in vocational science courses (5.0 to 7.6%), and
again controlling for prior attainment makes little difference. In terms of comparator
subjects, TA students are over-represented in mathematics (36.9%), but are
under-represented in history (21.1%) and psychology (16.2%). Again, accounting for prior
attainment in science makes little difference here.
Modelling participation
Table 5 presents the results (odds ratios) for eight separate multi-level logistic
regression models, predicting participation in each of the qualifications listed in Table
1 and using the set of predictors describe in Table 2. 11 As with all regression
modelling, the effect of any variable is estimated independently of any other.
Understanding this fact is crucial in accurately interpreting the findings from the
models.
The sample used in each model is 549,834 students in 3,402 schools. There is
missing data for approximately 55,000 students in comparison to the descriptive
analysis reported earlier (n=606,618), largely due to students who had either no
science or mathematics results in the NPD for the relevant year. These are most
likely students who were not entered for any examination in these subjects, and are
hence those towards the bottom of the attainment range. Whilst the issue of this
11
Page 25 of 49
missing data cannot be ignored, the impact on the veracity of the findings is limited
since these students are very unlikley to progress to any of the courses listed in
Page 26 of 49
Post-16 course
Odds ratios estimates for participation12
Percentage residual variance at
school level
Mean prior attainment in science at 16
Prior attainment in maths at
16
Gender: Male
Measures of socio-economic status
14-16 science pathway
14-16 school teaches to 18
Null (no predictors)
Full (all predictors)
FSM-eligible IDACI TA Other
Biology 1.237 1.008 0.652 1.052 1.281 2.550 0.132 1.077 23.8 6.6
Chemistry 1.260 1.068 1.177 1.313 2.702 3.435 0.138 0.963 30.3 11.3
Physics 1.188 1.133 7.683 0.971 1.076 2.275 0.168 1.239 31.7 9.9
Applied Science 1.074 1.007 0.849 0.846 0.824 0.298 2.106 2.020 75.2 69.3
BTEC National Award Applied Sciences 1.068 0.998 0.838 1.107 2.044 0.708 1.094 1.381 78.2 74.1
Mathematics 1.061 1.402 2.368 1.049 1.600 1.370 0.660 1.075 28.4 10.2
Psychology 1.076 1.034 0.292 0.856 0.780 0.715 0.453 0.967 13.9 8.4
[image:27.842.30.791.127.446.2]History 1.115 1.010 0.924 0.653 0.391 0.778 0.501 1.680 20.5 9.2
Table 5: Odds ratios and residual variance for two-level logistic regression models predicting participation in each post-16 course
12
Page 27 of 49
For example, the results for biology are interpreted in detail in Table 6:
Predictor for participation in biology A-level Odds ratio for predictor Effect size13
Interpretation in terms of participation in biology A-level
(all other variables held equal) Mean prior
attainment in science at 16
1.237 (0.118)
One additional mean point in science attainment at 16 increases the odds ratio by 23.7% - hence, as might be expected, higher attainment at 14-16 in science implies a greater likelihood of participating.
Prior attainment in
maths at 16 1.008 (0.004)
One additional point in mathematics attainment at 16 increases the odds ratio by 0.8%. This means that higher attainment in mathematics tends to increase participation, although the effect is small.
Gender: Male 0.652 -0.236 The odds ratio is 34.6% lower for males – so males are less likely to participate.
Measures of socio-economic
status
FSM-eligible 1.052 0.028
The odds ratio is 5.2% higher for FSM-eligible students (but is not statistically significant at the 5% level). In other words, there is a greater likelihood of FSM-eligible students participating, but this is not statistically significant.
IDACI 1.281 (0.137)
A change in IDACI from 0% (no children in poor households in the area) to 100% (all children are in poor households in the area) increases odds ratio by 28% - this means that students in more deprived neighbourhoods are more likely to participate.
14-16 science pathway
TA 2.550 0.517
Odds ratio is 155.0% higher for TA compared to DA – so students who did TA are more likely to participate than those who did DA after having accounted for (mean) prior attainment in science at 16.
Other 0.132 -1.119
Odds ratio is 87.8% lower for Other compared to DA – this means that students who did Other courses are less likely to participate compared to DA.
14-16 school teaches
to 18 1.077 0.041
[image:28.595.65.541.149.600.2]If the school teaches 16-18 as well as 14-16 then the odds ratio for participation is 7.7% higher. So students in such schools are more likely to participate.
Table 6: Interpreting the odds ratios from modelling biology A-level participation
A comparison across courses of the effect of each predictor is as follows:
13
Page 28 of 49
Prior attainment in science – the odds ratios are of the same order of magnitude
for the three science A-levels and history, but for the other courses (vocational
sciences, psychology and mathematics) are not so large, indicating that for these
latter courses prior attainment in science is not as important a predictor of
participation. 14
Prior attainment in mathematics: Unsurprisingly, mathematics attainment at 16
has its strongest effect in predicting mathematics participation post-16. This is
followed by physics, chemistry and biology. Attainment in mathematics at 16 has no
predictive power in determining participation in either of the post-16 vocational
science courses. For physics, the odds ratios for prior attainment in science and
maths are very similar.
Gender –the gender ‘bias’ in favour of boys’ participation is strongest in physics,
and then mathematics and chemistry, whereas the ‘bias’ in favour of girls is
strongest in psychology and then biology. In the vocational science courses, there
is a smaller 'bias' in favour of girls.
Socio-economic status – FSM-eligible students are more likely than their
non-eligible peers to participate in chemistry, but are less likely to participate in
psychology or history. There is an interesting difference between the two vocational
courses, with FSM-eligible students more likely to participate in BTEC national
award science, but less likely to participate in applied science A-level, although both
of these effects are non-significant at the 5% level. Broadly speaking, the odds
14
Page 29 of 49
ratios for IDACI tell a similar story to that of FSM, with students from poorer areas
less likely to participate in psychology and history.
14-16 science pathway– Compared to Dual award students, Triple award
students are more likely to participate in the three separate sciences and
mathematics, with the strongest effect for chemistry and the weakest for physics
amongst the three traditional sciences. The Triple award ‘effect’ is in the opposite
direction for history and psychology, but is strongest in this regard for applied
science A-level. Correspondingly, the only post-16 courses for which following the
'Other' 14-16 science pathway increases the likelihood of participation are for the
vocational science courses.
14-16 school teaches to 18 – This predictor has its strongest effect in the two
vocational science courses and for history, followed by physics. In all these cases
being in a school at 14-16 that taught up to 18 increases the likelihood of
participation.
A further comparison within each course indicates that strongest independent predictors of
participation vary as follows:
biology and chemistry: following Triple award science at age 14-16
physics, mathematics and psychology: gender – with boys much more likely to
participate in the first two of these, but girls much more likely in the latter.
applied science – not doing Triple award science at age 14-16, and the school
teaches up to 18
BTEC national award applied sciences – lower levels of socio-economic status
Page 30 of 49
history– higher levels of socio-economic status, and the school teaches up to 18
Finally, Table 5 also includes two values for the percentage of residual variance at the
school level. These figures for the three main sciences courses, mathematics and history
are of the order of 20-30% in the null model, but this decreases to 7 to 11% once all the
predictors are included. 15 So, for these five courses, approximately a quarter of the overall
variance in likelihood to participate can be attributed to schools, but when other factors
(predictors) are accounted for this drops significantly. For psychology, the residual school
variance is relatively small (14% in the null model), which decreases to 8% in the full
model.
Arguably, the most interesting of these figures are those for the vocational courses where
the residual school variance is much higher than for other courses, and does not decrease
significantly once predictors are included. This indicates that there is much more variation
by school in the likelihood to participate in post-16 vocational science courses compared
to the other post-16 courses. In other words, there are schools that tend to encourage
participation to these courses whilst others do not. This is likely to be an ‘availability’ issue in that a minority of schools offer these courses, whilst the majority do not.
15
Page 31 of 49
Discussion
Issues of equity
Previous studies have demonstrated the importance of prior science attainment as an
influential factor in student participation (Gorard & See, 2009; Rodeiro, 2007). The present
study adds to this work by revealing the patterning of this prior attainment factor across
the different sciences, and how these patterns relate to other factors such as gender and
socio-economic status. This reveals several issues of equity as explored below. We have
also included selected non-science subjects within our analysis, as comparators. For
example, our analysis of physics post-16 participation shows that mathematics attainment
at age 16 is as important an influence on progression as is science attainment.
In the ‘traditional’ sciences our modelling analysis indicates that, provided students from
poorer backgrounds attain sufficiently highly at 16, they do go on to study science in the
broadly the same proportions as their peers from higher up the socio-economic scale 16.
Thus, the heavy under-representation of lower socio-economic status students within
post-16 science courses reflects largely the strong correlation between attainment at post-16 and
socio-economic status (Gorard & See, 2009). Thus, addressing concerns about social
equity within post-16 science participation involves reducing attainment gaps between
social groups wherever they appear in compulsory schooling. This is arguably the most
significant message for policy makers from our research.
16
Page 32 of 49
Furthermore, our more fine-grained ‘between sciences’ modelling shows that chemistry is a distinctive science subject in that lower socio-economic status appears as a positive
influence on post-16 participation, in comparison with biology and physics, once prior
attainment and other factors have been taken into account. Interestingly, a different study
of participation within England and Wales using descriptive statistics shows an
over-representation of ethnic minority students within chemistry post-16 (Elias, Jones, &
McWhinnie, 2006). Elias et al. suggest that this over-representation arises from specific
career aspirations prevalent amongst particular ethnic minority groups, for example,
pharmacy. A-level chemistry is typically the only pre-requisite science for entry to
university pharmacy courses in England. Should these ethnic groups be over-represented
within lower socio-economic groups (Gorard and See, 2009; Strand, 2011) then this could
account for the distinctiveness of chemistry within our modelling analysis. The significance
of careers education as an important influence on post-16 choices has been identified in
several other studies (Mujtaba & Reiss, 2012). In policy terms, this points to a need for
additional focus on education about the potential career opportunities arising from biology
and physics in particular, targeted at students from lower socio-economic groups.
In contrast to socio-economic status, differential participation within the sciences by
gender is not significantly reduced by controlling for prior science attainment. Gender
patterns are also strongly conditioned by the specific science discipline. Thus, it is
inaccurate and unhelpful to talk of girls being under-represented in post-16 science
courses. Rather, our analysis shows that girls are heavily over-represented in biology,
slightly under-represented in chemistry courses, and heavily under-represented in physics
courses. Significantly, girls are slightly over-represented within applied science courses,
Page 33 of 49
and distinctive patterns point to the significance, for gendered participation, of factors not
represented in our quantitative analysis. A recent quantitative analysis in England
(conducted as part of the TISME research initiative cited earlier) identifies the differential
influence on intention to participate in physics for 15-year old boys and girls of a range of
factors such as emotional response towards physics lessons, competitiveness and home
support for achievement in physics (Mujtaba and Reiss, 2012). Another TISME study
demonstrates how girls inclined towards physical sciences course choices are often
involved in significant ‘identity work’ in order to reconcile their own identities with subjects
that tend to be associated with ‘cleverness’ and masculinity (Archer et al., 2010).
Findings from international studies such as PISA in 2006 (OECD, 2007) and the
Relevance of Science Education (ROSE) project, a comparative study across
approximately 40 countries of students’ views of science and science education (Jenkins
et al, 2006), indicate that in the UK, attitudes towards science show a large variation by
gender in comparison with many other countries. Overall, all these studies point to the
need for both qualitative and quantitative methodologies in the exploration of gender
equity issues with regard to progression to post-16 science.
Subject pathways
Triple/Dual Award
The findings in this paper indicate that students who follow Triple award at 14-16 are much
more likely to study sciences post-16, even after accounting for their higher average
attainment at 16. Arguably, this is not surprising since those students age 13-14 years with
Page 34 of 49
guided towards) the Triple award science pathway than other pathways, in schools where
such multiple pathways are available. However, Broeke (2010) has gone further to
suggest a causal connection between the Triple award pathway and post-16 science
participation. Their analysis of the national dataset in England identified those schools that
either stopped, or began offering, Triple award over the academic years 2001/02 to
2002/03. They then analysed the post-16 participation of these ‘adjacent’ student cohorts
to identify any trend associated with schools stopping offering, or starting to offer, Triple
award. They found significant positive effects on post-16 science participation related to
Triple award, particularly amongst boys and pupils from lower socio-economic groups.
This might suggest, for policymakers, that a shift to more students following a Triple award
pathway would certainly enhance post-16 science participation. We would urge some
caution here. Our evidence relates to student cohorts at the beginning of a policy of
enhanced Triple award entitlement, whilst the Broeke study involves GCSE cohorts
examined in 2002/2003, at a time when the numbers studying Triple award were
approximately half the number they are today. It is not necessarily the case that a positive
impact on science participation would be sustained as larger numbers of students follow a
Triple award pathway. The mix of students studying Triple award in England is changing
over time with more students as a whole, and especially more girls, studying the separate
sciences at 14-16 (Homer et al., 2011a). Additional study is needed to see whether or not
the ‘Triple award effect’ indicated above is sustained as the Triple award student
population increases and broadens. Furthermore, it is important to consider other potential
consequences of a shift to Triple award science. The problem of fitting three separate
sciences into an already crowded 14-16 curriculum remains a major challenge in many
schools (Millar, 2011; Fairbrother & Dillon, 2009). There is already much anecdotal
Page 35 of 49
time as that for Dual award, with potentially damaging effects on the student and teacher
experience. The existence of multiple routes into post-16 science also results in an
additional problem for schools, with students in the same post-16 class potentially starting
their studies with very different levels of content familiarity and understanding, Millar
(2011).
Vocational pathways
Participation within vocational science pathways has rarely been the focus of academic
research (Donnelly, 2009). For the cohort in our study, 14.9% of students completed
vocational science qualifications within 14-16 education (Homer, Ryder & Donnelly, 2011).
However, only 2.4% of students completing one or more of our focus post-16 qualifications
completed a post-16 vocational science qualification (Table 3). Thus, this science pathway
within 14-19 education in England is currently a small but significant one at 14-16, that
shrinks substantially post-16.
Our analysis indicates that influences on post-16 participation in the two vocational
science courses are of a different character to those in the traditional sciences (Table 5).
Attainment in science and mathematics at 16 is not so important, the 14-16 pathway is
generally different (e.g. is not Triple award), and schools have a greater variation in
influencing participation. In addition, according to the descriptive analysis, students eligible
for free school meals are overrepresented in both vocational courses, particularly the
BTEC National award, even after accounting for differences in prior attainment in science
(Figure 2). However, it is notable that the more sophisticated modelling analysis (Table 5)
indicates that socio-economic factors are less important once a range of additional
Page 36 of 49
These findings underline some of the tensions and ambiguities in current policy. The goal
of encouraging more students to participate in science post-16 tends to be operationalised
in terms of participation in the ‘traditional’ science courses. The role of enhanced
participation on vocational science courses 14-19 in achieving this policy goal is often not
articulated (Donnelly, 2009). Currently, vocational science courses tend to have a lower
academic status and policy visibility, as compared to traditional science courses. This may
be related to the extent to which these provide meaningful routes into either employment
or further and higher education (Donnelly, 2009; Woolf, 2011). Our research suggests that
vocational science routes (14-19 and beyond) appear to attract students with distinctive
characteristics into post-16 science education, and therefore promise to contribute to the
policy goal of broadening post-16 science participation. However, the provision of 14-16,
and particularly 16-19, vocational science courses within schools in England is far from
universal. Arguably, an initial policy goal would be to enhance uptake of such courses
across a broader range of schools. However, given concerns over the potential for social
stratification across academic/vocational courses (van Langen et al, 2008), it is important
that the socio-economic status of students following these courses is monitored. The
approaches followed in this paper provide one mechanism for such monitoring.
Subject comparisons
A distinctive feature of the analysis in this paper is the use of non-science comparator
subjects. This has highlighted that the gender imbalance is not confined to participation in
traditional science subjects. For example, boys are strongly over-represented in post-16
mathematics courses, even after other factors such as prior attainment are accounted for
Page 37 of 49
science 14-19 pathways, it is striking that girls are slightly over-represented within post-16
vocational science courses, although the absolute student number on these courses is
small. These findings suggest that this ‘science-related’ pathway may be one way of broadening girls participation in post-16 science (on a related issue, the particularly strong
over-representation of girls within psychology is discussed below).
In terms of socio-economic status, Table 5 suggests that participation in A-level
psychology and history appears particularly inequitable: both showing
under-representation of students from lower socio-economic backgrounds. However, some
caution is required here. The socio-economic inequity within A-level history may reflect
differential attainment within 14-16 history, and the humanities more broadly, across
different social groups, factors not included in the modelling here. Further research,
accounting for broader subject attainment, is needed to investigate these issues in detail.
Although not categorised in our analysis as a science, school psychology has arguably
more the character of a science than a humanities course. Furthermore, there are large
numbers of students completing A-level psychology courses in England; for every A-level
physics student there are 2.3 A-level psychology students (Table 3). The large number of
students following this ‘science-related’ A-level makes it an important comparator for
determinants of post-16 science participation. Psychology is the only science-related
A-level to show, across both available measures, a statistically significant
under-representation of lower socio-economic status students within the modelling analysis
(Table 5). In terms of gender, using descriptive statistics (Table 3), psychology is second
only to physics in the extent of the gender imbalance, with girls comprising 73.9% of
Page 38 of 49
are around nine female A-level psychology students, and a large gender imbalance
remains within the modelling analysis (Table 5). Psychology, then, is by far the most
popular science-related A-level for girls, but has a curriculum that includes not only
science content from the biological sciences, but also content from mathematics
(statistical analysis) and often the physical sciences (e.g. forensics). We argue that further
research to investigate the choice rationales, and experiences, of girls following A-level
psychology would inform the development of broader policy reforms to increase female
participation in the sciences. It is possible that ‘new’ science-related school science
courses would provide more open and flexible opportunities for girls’ ‘identity work’ (Archer
et al., 2012). Studies within the higher education sector also suggest that new,
multi-disciplinary courses that include aspects of several of the traditional sciences, such as
forensic science, are also preferentially attractive to girls (Henriksen et al., forthcoming).
School effects
One advantage of the multi-level modelling approach is that it provides a national measure
of the variation between schools in influencing progression to post-16 courses. The figures
for the non-applied A-level subjects are all of the order of 10% in this regard (Table 5, final
column). The source of this variation is likely to be across multiple unmeasured factors
including, for example, teacher effects and school policies with regard to course options
and progression. From school effectiveness research it is known that around 5-20% of the
variation in student progress (i.e. value-added attainment) can be attributed to schools
(Rasbash et al., 2010). The findings in this paper, concerning influences on
post-compulsory participation, are mostly of a similar magnitude (the exception being the
vocational courses, where this effect is much larger). It is important, therefore, to note that
Page 39 of 49
participate in science post-16 (Bennett et al., 2011), the analysis presented here indicates
that the overall difference schools make nationally is limited once a range of student and
school factors (as listed in Table 2) are taken into account.
Methodological considerations
The modelling approach taken here is different to that of some other studies such as that
of Gill & Bell (2011). Gill & Bell model post-16 participation in A-level physics using as a
population those students studying at least one A-level in any subject. By way of contrast,
the current study is interested in the a priori influences on progression amongst the whole
national population at 16, arguably a more parsimonious approach in the sense of being
less restrictive. The issue of which ‘population’ to choose as the basis for modelling
progression, and the consequences of such a choice on model estimates, could prove an
interesting area for future work. A second methodological point relates to the inclusion of
two measures of socio-economic status in the modelling. Whilst there are clear benefits to
their both being included, as they do capture different information (Table 2), the
interpretation of the subsequent model estimates needs to be done carefully. These are
independent effects so that the estimate for each is based on holding the other constant.
A natural follow-up to this study would look at influences on attainment (rather than
progression) in post-16 sciences, using value-added techniques applied to the same or
similar data to that presented here. Methodologically, such a study would be likely to
employ similar methods to that of Homer et al. (2011b) to assess, for example, the impact
Page 40 of 49
work would help complete the picture as to what types of students tend to do the post-16
sciences (and comparators), and, importantly, how they achieve once on these courses.
Internationally, it would be useful to compare the findings of this study with those from
other countries or jurisdictions where similar such national (or equivalent) data is available
(e.g. in Denmark; Henriksen et al., forthcoming). However, there is very little current
evidence in the literature of such work, although this might change in the future with the
Page 41 of 49
Conclusions
Smith (2011a) argues that UK government educational policy over the last 40 or so years,
including making science participation compulsory at ages 14-16, has had little overall
impact on A-level participation in the science. Nevertheless, at the time of writing (January
2013), school science policy in England is in flux, with the ongoing national curriculum
review, and recent changes to accountability measures working their way through the
system (DFE, 2010). It is likely that ‘applied’ science routes, already with lower status, will be squeezed out of 14-16 provision and that the ‘push’ for Triple award will continue.
These changes at 14-16 science are likely to have important impacts on participation in
post-16 sciences and influences thereon. For a particular cohort and prior to these policy
changes, this paper has quantified the key determinants of post-16 science participation
using national data. This study is not in a position to refute Smith’s argument about the ineffectiveness of policy, but future studies, looking for changes in patterns of participation
using similar methods, and comparing their findings to the basline results presented here,
might be able to.
Acknowledgments
This work has been funded in part by the Economic and Social Research Council and the
Page 42 of 49
References
Archer, L., DeWitt, J., Osborne, J., Dillon, J., Willis, B., & Wong, B. (2010). 'Doing' science versus 'being' a scientist: Examining 10/11-year-old schoolchildren's constructions of science through the lens of identity. Science Education, 94(4), 617-639.
Archer, L., DeWitt, J., Osborne, J., Dillon, J., Willis, B., & Wong, B. (2012).
“Balancing acts'': Elementary school girls' negotiations of femininity,
achievement, and science. Science Education, 96(6), 967-989.
Archer, L., DeWitt, J., Osborne, J., Dillon, Justin, Willis, B. & Wong, B. (2012) Science
Aspirations, Capital, and Family Habitus: How Families Shape Children’s
Engagement and Identification With Science. American Educational Research Journal. Available from:
<http://aer.sagepub.com/content/early/2012/01/17/0002831211433290> [Accessed 21 March 2012].
Banner, I., Donnelly, J., Homer, M. & Ryder, Jim (2010) The impact of recent reforms in the key stage 4 science curriculum. School Science Review, 92 (339), pp.101–109. Bennett, J., Lubben, F. & Hampden-Thompson, G. (2011) Schools That Make a Difference
to Post-Compulsory Uptake of Physical Science Subjects: Some comparative case studies in England. International Journal of Science Education, pp.1–27.
Bland, J.M. & Altman, D.G. (2000) The odds ratio. BMJ, 320 (7247), p.1468.
Boe, M.V., Henriksen, E.K., Lyons, T. & Schreiner, C. (2011) Participation in Science and
Technology: Young People’s Achievement-Related Choices in Late-Modern Societies. Studies in Science Education, 47 (1), pp.37–72.
Broeke, S. (2010) Does Offering More Science at School Increase the Supply of Scientists? The Impact of Offering Triple Science at GCSE on Subsequent Educational Choices and Outcomes. Department of Economics, Royal Holloway University of London. Available from:
<http://ideas.repec.org/p/hol/holodi/1001.html> [Accessed 22 June 2012]. Chinn, S. (2000) A simple method for converting an odds ratio to effect size for use in
meta-analysis. Statistics in Medicine, 19 (22), pp.3127–3131.
Cohen, J. (1988) Statistical Power Analysis for the Behavioral Sciences. Routledge.
DFE (2010) The Importance of Teaching - The Schools White Paper 2010 [Internet]. Available from:
<https://www.education.gov.uk/publications/standard/publicationdetail/Page1/CM% 207980#downloadableparts> [Accessed 11 April 2012].
DfES (2005) 14-19 Education and Skill. London, HMSO. Available from: