eurostat
STRUCTURAL DATA BASE
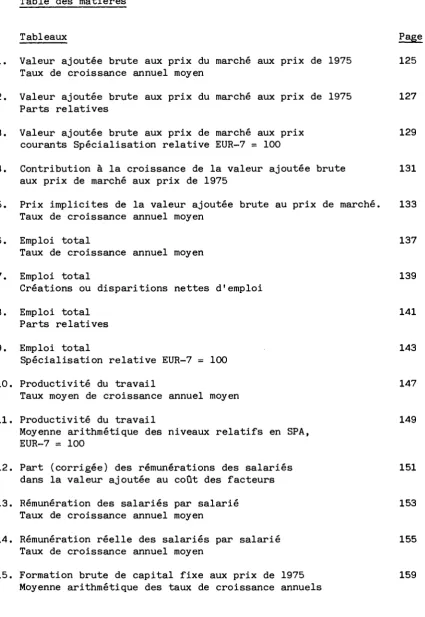
TABLES BY BRANCH 1960-1981
Studies of national accounts — No 4
LA BASE DE DONNEES STRUCTURELLES
TABLEAUX PAR BRANCHE 1960-1981
eurostat
STATISTICAL OFFICE OF THE EUROPEAN COMMUNITIES
OFFICE STATISTIQUE DES COMMUNAUTÉS EUROPÉENNES
L-2920 Luxembourg-Kirchberg — Tél. 43011, Télex: Comeur Lu 3423
Studies of national accounts — No 4
STRUCTURAL DATA BASE
TABLES BY BRANCH 1960-1981
This publication has been prepared by Marco Pecci-Boriani of the Statistical
Office of the European Communities with the help of Jean Leroy and Françoise
Lenoir.
Études de comptabilité nationale — N° 4
LA BASE DE DONNÉES STRUCTURELLES
TABLEAUX PAR BRANCHE 1960-1981
Cataloguing data can be found at the end of this publication Une fiche bibliographique figure à la fin de l'ouvrage
Luxembourg: Office des publications officielles des Communautés européennes, 1984
ISBN 92-825-4185-1