This is a repository copy of
Experimental and Modelling Investigations of Air Exchange
and Infection Transfer due to Hinged-Door Motion in Office and Hospital Settings
.
White Rose Research Online URL for this paper:
http://eprints.whiterose.ac.uk/90703/
Version: Accepted Version
Article:
Hathway, E.A., Papkonstantis, I., Bruce-Konuah, A. et al. (1 more author) (2015)
Experimental and Modelling Investigations of Air Exchange and Infection Transfer due to
Hinged-Door Motion in Office and Hospital Settings. International Journal of Ventilation, 14
(2). pp. 127-140. ISSN 1473-3315
https://doi.org/10.5555/2044-4044-14.2.127
This is an Accepted Manuscript of an article published by Taylor & Francis in The
International Journal of Ventilation on 2 September 2015, available online:
http://www.ijovent.org/doi/pdf/10.5555/2044-4044-14.2.127.
eprints@whiterose.ac.uk https://eprints.whiterose.ac.uk/ Reuse
Unless indicated otherwise, fulltext items are protected by copyright with all rights reserved. The copyright exception in section 29 of the Copyright, Designs and Patents Act 1988 allows the making of a single copy solely for the purpose of non-commercial research or private study within the limits of fair dealing. The publisher or other rights-holder may allow further reproduction and re-use of this version - refer to the White Rose Research Online record for this item. Where records identify the publisher as the copyright holder, users can verify any specific terms of use on the publisher’s website.
Takedown
If you consider content in White Rose Research Online to be in breach of UK law, please notify us by
Experimental and modelling investigations of air exchange and infection transfer due to
hinged-door motion in office and hospital settings.
Abigail Hathway1, Ilias Papakonstantis2, Adorkor Bruce-Konuah1, Wernher Brevis1
1. Department of Civil and Structural Engineering, University of Sheffield, Sir Frederick Mappin Building, Mappin Street, Sheffield, S1 3JD, UK
2. Department of Water Resources and Environmental Engineering, School of Civil Engineering, National Technical University of Athens, Greece
*Corresponding email: a.hathway@sheffield.ac.uk
Abstract
Occupants spend a significant amount of time indoors where temperature and air quality has an important impact on their comfort, health and work performance. Understanding the role of airflow exchange between spaces is crucial to describe the processes of mixing and transport of substances driven by air motion and therefore essential for evaluating indoor air quality. This work presents the results of field measurements and laboratory experiments designed to characterise door operation and to quantify its influence on air volumes exchanged between rooms due to door motion. The field study was conducted to identify typical total door cycle times in single person offices. The laboratory experiments were conducted in a scale model to investigate the exchange flow between two generic rooms. The model consisted of a water filled tank divided into two equal rooms, which were connected by a computer-controlled hinged door. Flow visualisations were used to describe flow patterns and concentration measurements of Rhodamine WT were performed to quantify exchange volumes. With hold open times of between 0s and 26.67s the total fluid volume exchanged was found to be between 67% and 98% of the total volume swept. Based on the exchange volume found in these experiments combined with the Wells-Riley equation the effect of ventilation rate on the probability of occupants in an adjacent room becoming infected was investigated. With ventilation rates for a medium air quality the risk of infection is low (<0.05). However, the probability of infection quickly rises with lower ventilation rates.
Keywords: ventilation, indoor air quality, door motion, risk infection, volume exchange, flow visualisation
1. Introduction
The international drive towards more energy efficient buildings has increased the demand to understand and design suitable ventilation systems to improve indoor air quality. There is growing
“ B “
require ventilation rates of up to 25 l/s/person UK “ et al
Activities such as the movement of people also have the potential to distribute contaminants and impact on the local ventilation regime. This movement will generate mixing as well as opening/closing air pathways between spaces. Contaminants may be transferred between spaces due to airflow across a doorway. These airflows can be generated by convective effects due to indoor temperature gradients, but also due to the operation of doors and people movement.
Experimental studies have been used to assess the potential contribution of door operation to air and contaminant transport. The main focus of these studies have been the quantification of mass exchange between rooms and the description of flow dynamics. Several studies have been presented for the flow induced by buoyancy and door motion (e.g. Kiel et al 1989; Wilson et al 1990), a setting particularly important for external doors where the temperature gradients across the opening can be high. However, in the case of internal doors the temperature difference is likely to be small and mixing and transport will be primarily driven by the door or human motion. Interest in the escape of infectious material from isolation rooms has led to a focus on this mixing in clinical environments (e.g. Tang et al 2005; Eames et al 2009; Kalliomäki et al 2012; Tang et al 2013; Fontana et al 2014). More specifically, Tang et al (2005 and 2013) and Eames et al (2009) conducted experiments for the visualization of the flow generated by the motion of a door separating two rooms. The experiments were conducted in a scale laboratory model, consisting of a tank filled with water with a door separating two rooms. Food dye was used as a tracer and indicative pictures and figures were provided to describe the exchange flow generated by the door motion. Fontana et al (2014) also considered the air exchanged through a doorway using a water scaled model with two rooms separated by a doorway. Kalliomäki et al (2012) provided one of the few examples of full scale results available. Their experiments were based on the use of smoke and gases to visualise and quantify the flow exchange between rooms.
The volume which is exchanged between two rooms due to door motion has also been quantified. Kiel et al (1989) performed experiments in a scale model to determine the fluid volume that is exchanged through an external doorway. Since the experiment mainly concerned the buoyancy induced flow, the study was based on the Densimetric Froude number. Full scale measurements with tracer gas were also carried out. At a density difference between rooms of zero, it was found that the exchange volume increases linearly with door speed. They also showed that the volume exchanged was found to be almost constant with the hold open time, which is the time the door is held at the maximum opening angle. A typical value of the volume exchanged was found to be about 50% of the swept volume (door height x door width2 Considering experiments with isothermal flow Eames et al (2009) tested several door opening angles and found that the exchanged volume varies from about 1.5% to 5% of the room volume and it is comparable to the volume swept by the door. Kalliomäki et al (2012) also quantified the effect of a range of door opening times and hold open times on the exchanged volume. The results show that the exchanged volume increases with hold open time and total cycle time (opening, hold open and closure), while it does not vary with door speed for a certain hold open time. Several discrepancies can be found in these previous studies. For instance, Kiel et al (1989) found that door speed is the most important variable dictating the amount of volume flux, whereas Kalliomäki et al (2012) showed that the total cycle time, and in particular the hold open time, is the main control parameter.
as they walk along a straight line, and the ability of contaminants to be spread in the persons wake, has been shown for corridors (Wood et al 2014) and aircraft cabins (Poussou et al 2010). Considering the combination of human movement alongside door motion Tang et al (2013) included a visualisation of human movement demonstrating that as a health care worker walks through a door way there is flow both ways, into and out of the room. Kalliomäki et al (2013) compared the volume of air exchanged between rooms from door opening alone, and door opening and manikin movement combined. Kalliomäki that there is a slightly greater exchange when manikin movement is also considered; the movement increased the volume exchanged due to door motion alone by approximately one quarter. Total air volumes exchanged were approximately 1.2-2.2m3 (dependent on the varied parameters) with an increase of 0.3 - 0.4m3 when a moving person was included. It was however acknowledged that, due to the variation in results and the other parameters studied, more work would be required to fully quantify this. Choi et al (2012) used CFD analysis to study the air transferred between rooms due to door and human motion, they found results of a similar order to Kalliomäki et al (2013). The air volume estimated to be transferred by human movement was found to be approximately 32% of that moved by a swinging door alone. Using CFD analysis Lee et al (2014) approximated the total cumulative air volume exchanged to increase from approximately 0.4m3 to 0.7m3 at of a door. The study by Lee et al (2014) indicates a greater proportion of the fluid is moved between rooms due to person motion than was shown by Choi et al (2012) or Kalliomäki et al (2013). However, in L the volume transferred due to door motion alone appears to be smaller which may be due to variation in other experimental parameters (e.g. room size).
The majority of previous studies have tended to focus on isolation rooms, however, it is also worth considering other areas both within and outside the health care environments. For instance, understanding the draught created by a door may be important for designing local extract ventilation in industrial settings. Further, understanding and limiting the spread of infection in non-critical environments is also necessary. In fact many infections are spread in everyday situations or in non-critical health care environments, before the patient has been fully diagnosed. Epidemiological models are commonly used to assess the benefit of infection control methodologies on the spread of disease. In this context, the Wells-Riley model was developed several decades ago (Riley et al 1978) to investigate the role of ventilation in reducing the spread of airborne diseases (such as Measles and Tuberculosis (TB)). The application of the model has been discussed by several authors (e.g. Aliabadi et al 2011; Beggs et al 2003; Sze To et al 2009). There have been many advances in the application of the Wells-Riley model, for instance using a stochastic formulation (Noakes et al 2009) or considering the unsteady concentration of infectious material in the air (Gammaitoni et al 1997). However, despite these advances it is still considered a useful model today to evaluate the role of ventilation in simple comparisons. In order to evaluate the risk of infection in neighbouring rooms it is necessary to combine the Wells-Riley model with an understanding of the transfer of infectious material across a doorway. Therefore, this study aims to understand the risk of infection transfer in adjacent spaces due to motion of the door separating these spaces by; (i) evaluating typical door usage in a non-isolation settings; (ii) visualising the flow induced by door motion and quantifying the fluid volume exchanged between rooms due to door motion for a range of hold open times in isothermal conditions; and (iii) evaluating the risk to a person due to infectious substances being transferred between rooms by door opening.
Based on the three main objectives outlined above the methodology is split into three components. (i) Initially a field study was conducted on single occupancy offices to understand the characteristics of use. This was followed by (ii) an experimental investigation of the exchange flow induced by the door motion, including flow visualization, and concentration measurements for estimating the volume exchanged between the two rooms for different hold open times. Finally, (iii) epidemiological modelling was carried out to assess the probability of infection transfer due to door opening in a variety of scenarios.
2.1 Field studies
There is little information available on door speed and use, particularly in non-critical environments. Therefore we monitored door usage in eleven single person offices in order to understand how non-automatic doors in standard settings are used. The offices are of a similar size and located in two separate multi-storey buildings. The rooms have centrally controlled heating and openable windows. The offices are mixed between south and north facing. The offices were monitored for two months each in different seasons, equating to over 400 office days in total. Measurements were taken of the total door cycle time. Magnets were attached to both frame and door, which connected when the door was closed. State monitors (Tempcon, UK) logged a timestamp when the state changed and the door opened (magnets disconnected) and then when the door was fully shut (magnets re-connected). The difference in time between the state changes from closed to open and from open to closed was used to evaluate typical total door cycle times. This does not monitor the angle of opening.
2.2 Experimental study
Experiments were conducted in a 1:10 laboratory scale model consisting of a plexiglas tank (0.90 m x 0.70 m wide x 0.20 m high) of horizontal bottom (see Figure 1). The tank was divided into two equal parts by means of a wall (Figure 1). A hinged door of dimensions 0.20 m by 0.09 m was placed in the middle of the tank. The door is full height (allowing clearance room 5mm). This reduces the flow generated over the top of the door and allows the analysis, in first instance, of vertical axis flow structures. The door motion was provided by means of a computer controlled door actuator (Figure 1). The opening angle was approximately 90o. The time for the door opening was 0.7 sec (time in the experiment), approximately equal to the time required for the door closure. The total time and acceleration profile was repeatable and monitored by using an in-house Labview® script, through which various hold open times (th) could be specified. The tank was closed by means of a Plexiglas lid bolted on the vertical sides of the tank, this ensured the development of an enclosed space as in real rooms, rather than approximating the flow dynamic by means of a free surface flow. Four round openings (Figure 1) of diameter about 0.05 m were made on the lid (two in each room) to allow for dye injection, for stirring the mixture and for concentration measurements. During the door motion, the openings were covered with cylindrical lids, resulting in a smooth ceiling in the tank.
2.2.1 Scale model experimental methodology
Water was used as working fluid and the modelling was based on the Reynolds number matching between the model and a generic full scale reference. For a viscosity ratio between air and water of
/ w = 15 (20 o
C) and for a length ratio Lm/Lf=1/10 between model (m) and full scale (f), the time
The tank was filled with tap water, closed, and air bubbles removed using a syringe linked with a catheter submerged through the four openings, before each experiment. Water of one room was coloured using food dye to visualise the mass flux. The mixture was sufficiently stirred and was left to rest before each experiment. The tank was homogeneously illuminated by means of two LED floodlights. A digital camcorder, (Panasonic HC-V720) was placed beneath the tank and a second camcorder (Panasonic HC-V210) was placed to face the side of the tank. Both cameras provided video of resolution 1920 x 1080 pixels at a frequency of 50 fps. The MovieShop Framer® software was used for extracting characteristic video frames.
Rhodamine WT was used as a tracer to measure the fluid volume exchanged between the two rooms. Prior to the Rhodamine injections, the water in the tank was left for over 60 hours to promote chlorine decay. Measurements of Rhodamine concentration were carried out by means of Cyclops fluorometer (Turner Designs®). This instrument was linked with an analogue to digital converter, USB-1208LS by Computing Measurement®. For the data acquisition the TracerDAQ® software was used. The instrument was calibrated daily. The relation between the measured voltage and the concentration was found to be linear with an excellent accuracy. A concentration of approximately 300 ppm was created in one room, and 20-50 ppm in the second room. The bottom of the tank was covered with a black surface to avoid any reflections. After the door motion (opening, hold open and closure) the mixture of both rooms was stirred sufficiently to obtain a uniform concentration. Then, the concentrations in each room were measured again. The volume Vx
exchanged between the two rooms, termed here as A and B, can be obtained from the conservation of Rhodamine mass. For room A the following relation can be written:
(1)
CoA and CoB are the average concentrations before the door motion in rooms A and B respectively, CA
is the average concentration in room A after the door motion, and V is the volume of each room. A similar equation can be written for room B and the final volume exchanged, Vx, was estimated as the
average from both equations. The experiment investigated a variation in hold open time with a constant opening time. Results from ten experiments with three different hold open times are presented in section 3.2.
2.3 Infection modelling
well-mixed air and that the injection of infectious material is continuous over time. Although there have been advances in this model over the past decades its original form is deemed most suitable here to gain an initial understanding of the risk of infection spread due to door motion under a range of basic ventilation scenarios. The model can be used to calculate the number of susceptible people ( who become infected ( ).
(2)
Where is the probability that a person will become infected. This probability can be calculated as:
(3)
where is the average pulmonary ventilation rate of the susceptible occupants (m3/min), taken as 0.01m3/min, which is in line with that used by both Beggs et al (2003) and Nardell et al (1991). The exposure time to infection is represented by t (min), is the number of infectors (taken as 1), QB (m3/min) is the ventilation rate in room B and is the quanta generation rate (quanta/min). The Wells-Riley model is usually concerned with an infectious individual being located in the same space as the susceptible occupants, with a rate of generation of infectious material (quanta/minute). However, here we are concerned with the spread of infection between rooms and therefore is taken as the amount of quanta that is transferred through the doorway, averaged over the period between door openings (quanta/minute).
(4)
Where is the volume of fluid exchanged (m3), is the time between door openings (minutes) and is the concentration of quanta in room A (quanta/m3). The air is assumed to be uniformly mixed immediately after the door opening. The quanta of infectious material in room A is calculated using the standard dilution equation (and not including the dilution due to door opening).
(5)
Where is the amount of quanta entering the room from outside in the ventilation air (in this case zero), is the volume of room A, is the initial quanta generation rate in room A (values defined in 2.3.1), and QA is the ventilation rate in room A (m
3 /min).
2.3.1 Modelling Scenarios
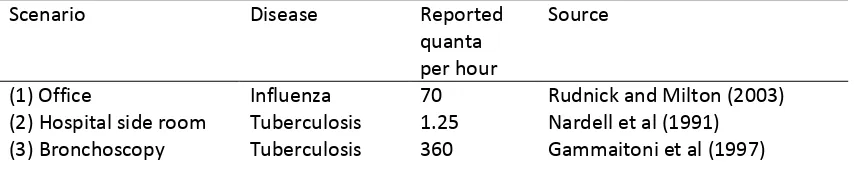
For this study, specific examples from the literature that best represent our scenario are used to provide appropriate values for the quanta of infectious material produced (Table 1).
Table 1: Quanta of infectious material for outbreaks of specific diseases. These are the values of input into equation (5) for the three scenarios.
Scenario Disease Reported
quanta per hour
Source
(1) Office Influenza 70 Rudnick and Milton (2003)
(2) Hospital side room Tuberculosis 1.25 Nardell et al (1991) (3) Bronchoscopy Tuberculosis 360 Gammaitoni et al (1997)
The three specific scenarios in this study include: an office outbreak of influenza, a patient with undiagnosed TB in a single room, and a patient with TB undergoing bronchoscopy. For each scenario a selection of ventilation rates are considered as outlined in Table 2. The office and single room are chosen deliberately as being non-critical situations where there is no isolation protection. The first considers the spread of infection in a typical office environment, with an index case in a single office attached to a larger, multi-occupied outer office. Ventilation rates are based on what is required for fresh air for different classifications of indoor air quality (IAQ) as defined by BS EN 13779. A busy period is considered initially with the office door opened every 10 minutes. This is then compared to periods when the door is opened once every 30 or 60 minutes. Similarly the second case considers a hospital single room, where a patient may be placed whilst awaiting diagnosis or transfer, this is connected to a larger public area. The final scenario considers the generation of infectious material due to a Bronchoscopy. Bronchoscopy is well known to create aerosols and as such there are specified ventilation rates to protect health care workers, in the UK the number of air changes per hour required is defined as 15 ac/h (Department of Health 2007). This is compared to a ventilation rate in line with a moderate IAQ classification to assess the risk due to poorly maintained ventilation
or inadequate design. For both scenarios the door is assumed to be opened every 10 minutes.
Table 2: Ventilation rates in room A and B for the investigated scenarios.
Scenario Ventilation Rate
(l/s/person unless stated)
Source
Room A Room B
1(a) Office outbreak of influenza
12.5 12.5 Medium IAQ standard (BS EN 13779)
(b) 8 8 Moderate IAQ standard (BS EN 13779)
(c) 8 5 (A) Moderate and (B) low IAQ standard
(BS EN 13779)
(d) 5 8 (A) Low and (B) moderate IAQ standard
(BS EN 13779) 2 (a) Side room
outbreak of TB
6 ac/h 6ac/h Recommended air change for (A) single room and (B) general ward
(Department of Health 2007)
(b) 12 ac/h 6ac/h Recommended total air change for (A)
[image:8.595.74.536.556.755.2]3(a) TB outbreak due to Bronchoscopy.
15 ac/h 6ac/h Required air flow for (A) endoscopy suite and (B) general ward
(Department of Health 2007)
(b) 3 ac/h 6ac/h Ventilation rate for (A) moderate IAQ
standard and (B) general ward (BS EN 13779; Department of Health 2007)
3. Results and Discussion
3.1 Field measurements of door cycle times
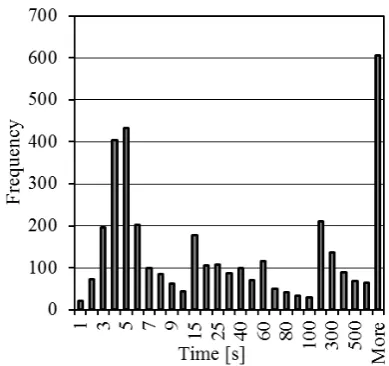
The results from door monitoring gave values between 1 s and several hours. For the purpose of this research any open time longer than 1 hour has been removed. Figure 2 shows a histogram of 3710 instances of door opening, with the frequency of each time period of opening. Periods of the door
greater than 1 hour). As can be seen from the data there is a large spread of results with a third of the instances having a period between 3 and 6 s, and some as short as 1s. This is faster than the cycle time previously considered in scaled water tanks (e.g. Tang et al 2013; Eames et al 2009). For this paper an opening time of approximately 0.7 s in the model ( 4.7 s full scale equivalent) resulting in a minimum full scale total cycle time of approximately 9 s is used.
3.2 Experimental investigation of air flow across a door way.
The volume exchanged between the two rooms for three different hold open times (full scale values of 0 s, 6.67 s, and 26.67 s) is shown in Figure 3. The solid symbols correspond to the average volume for each hold open time. The obtained volumes and times had been scaled up, i.e. the values shown in Figure 3 refer to full scale. Figure 3 shows the volume exchanged increases with hold open time, for clarity a linear trendline has been shown through the available results. This increase in volume exchanged with hold open time is in accordance with the findings of Kalliomäki et al (2012) who found a similar linear relationship with full scale measurements. Although limited to three hold open times our findings support this linear relationship, providing confidence in the ability of our scaled model to mimic the real environment. This finding is in contrast to the results reported by Kiel et al (1989), who concluded that hold open time had negligible impact on the exchange volume. Previous studies have normalized their results by the room volume Vr (Eames et al 2009) or the volume swept
by the door Vd (Kiel et al 1989). The present dimensionless volume Vx/Vr varies from 0.013 to 0.019,
this is lower but of the same order as the values reported by Eames et al (2009). The average values for Vx/Vd are between 0.67 and 0.98. This is higher than the typical dimensionless volume of 0.50
reported by Kiel et al (1989), but generally in agreement to Eames et al (2009) who reported that the exchange volume is comparable but smaller to the volume swept by the door.
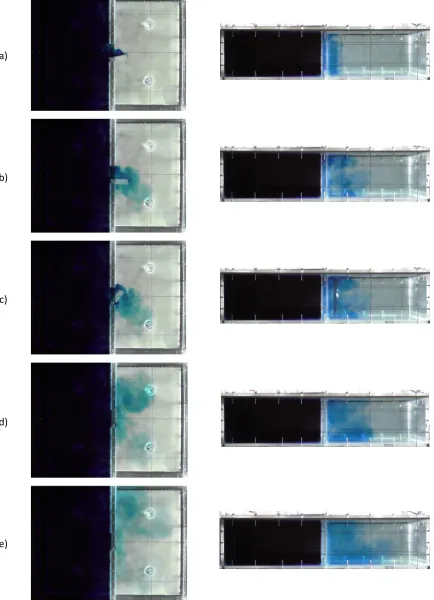
3.3. Flow Visualisations
promoting what we define here as the first phase of the mass exchange. Theseobservations seem to be in accordance with the observations by Tang et al (2005) and Eames et al (2009). From the side visualization view it is possible to observe that the vortex structure appears to initially be two-dimensional, however its dynamics becomes clearly three-dimensional later. The second phase of the process occurs when the door returns to the closed position (Figures 4c and 4d). Analogous to phase one, the vortex is formed due to the strong velocity gradient induced by the door movement. In this phase the vortex is shed towards the upper left side of the domain (along the interface between the rooms). The vortex shedding is associated with a jet-like motion, which propagates in the clock-wise direction attached to the domain walls (Figures 4d). This jet-like motion and the vortex interaction with the ambient fluid in the right room, promotes an efficient mass distribution within the right volume. This can have implications for any hazardous operations occurring adjacent to the door and along the perpendicular wall as the generated vortex may break down the local extract if it is not strong enough. Further investigation of the flow structures and velocity measurements would enable the risk of this interacting with local extracts to be evaluated and mitigation strategies developed.
3.4 Risk of infection
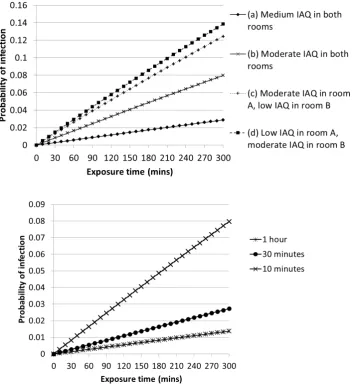
Based on the results from the experiments a hold open time of 6.67 s (full scale) was considered, providing an exchange volume of 0.9m3 which was applied in equation 4. For the following results the probability of infection transfer (calculated using equation (3)) is plotted over a period of five hours exposure time.
1) Spread of influenza in a typical office space
The probability of infection for the four ventilation scenarios with a door opening every 10 minutes is shown in Figure 5 with a comparison for door opening schedule. As would be expected the higher ventilation rates for the medium quality environment provide the lowest risk of infection in the adjacent room. The short time period and low levels of quanta present in the air result in a function that appears straight, although it is in-fact just a small part of an exponential function. By increasing the air change rate by approximately 50% the risk of infection is reduced by more than half. A higher air exchange rate in the source room provides a greater benefit than increasing the ventilation in the room of susceptible people, although the reduction in risk is not great. To put the probabilities below in context, if we were to calculate the number of new occupants now infected using equation (2), this would show that by changing the ventilation in one room to 5l/s we would result in one of the ten occupants in room B becoming infected. As well as an impact on health and wellbeing, the new infection, due to a reduction in ventilation, would have economic impacts for the company due to an extra person either taking a day off work ill or performing below their best abilities.
2) Spread of TB from a hospital single room
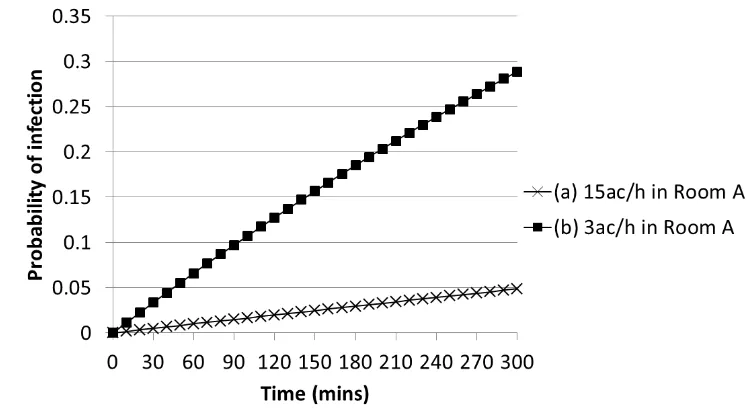
3) Spread of TB from a Bronchoscopy suite
Figure 7 presents the probability of infection transfer from a Bronchoscopy suite where the quanta of infectious material generated can be very high. The figure shows that current ventilation
standards in the UK (15 ac/h) give a low probability of another person becoming infected in the adjacent room. However, it also highlights the importance of designing and maintaining ventilation systems properly in these situations as with a poorer ventilation regime the number of new infections in our 10 susceptible people would be 1 after 90 minutes.
The visualisations shown in figure 4 demonstrate the way the infection material may circulate in the room, clearly giving a larger dose to anyone located adjacent to the door on the side of the jet. Visualisations such as these are valuable to understand how infectious material may circulate and can provide some simple solutions such as ensuring places people are likely to wait (e.g. receptionist desks, nurses stations or simple seats) are located away from these zones, thereby reducing the risk of being caught in an infectious jet before it has been well diluted. However, these results will be affected by the movement of people which is not currently included, as the motion of people may increase mixing and also drag contaminant across a space. Infectious particles may escape from one room and be transported in the wake of a person along a corridor where it has been shown the contaminant may move significantly further than the person (Woods et al 2014).
The results shown in figures 5-7 present simplistic scenarios assuming that the infectious quanta is immediately well mixed in the room air. Door motion alone has been considered to transfer the infectious particles between spaces with a single defined opening angle, speed and hold open time. In reality this will vary both by use and also by location. The results presented in section 3.1 are only for office doors. Hospital doors may well have different hold open times; in some cases doors are automatic which usually means they move more slowly or multiple health care workers may enter a room at once requiring the door to be open for a longer period. This study ignores the effect of a person walking between the rooms which has been shown to increase the exchange of infectious material between rooms. Although the contribution of human motion to airflow exchange is not well established, the increase in volume of air exchanged can be estimated to be approximately 30% (+/- 5%) (Kalliomäki et al 2013; Choi et al 2012). This study also only considers isothermal conditions. If a temperature gradient exists between the two spaces the volume exchanged will also increase. Therefore, the volume exchanged estimated here are likely to be lower than those encountered in real settings. These results also assume that there are two spaces joined with a door opened at regular intervals. In reality the way people interact and move between spaces is more complex. In order to improve our understanding of the risk of airborne infection transfer these should be taken into account, and the stochastic behaviour of people used to identify the range of possible air paths and resulting risk. However, the current study provides a useful evidence base to begin to estimate the role of human activity on the risk of infection transfer in a range of occupied spaces.
4 Conclusions
open time on the volume flux between rooms alongside epidemiological models to investigate the infection risk with the following main findings:
A linear relationship between door hold open time and volume flux between rooms was found. The volume of air exchanged being 67% to 98% of the volume swept by the door for a full scale hold open time between 6.67 s and 26.67 s.
The door opening promoted the development of a well-defined mechanism of mass exchange between rooms. The opening and closing stages, are translated into two clear phases, each governed by the formation and movement of a large-scale vortex. The vortex and the jet-like motion associated with the second phase govern, based on qualitative evidence, the transport and mixing within the visualised room.
The risk of infection in an adjacent room when moderate levels of ventilation are used is low. However, risk in the adjacent room increases when the air exchange rate is reduced in either room. In the example shown here of an influenza outbreak in a busy office the difference between low IAQ ventilation rates in just one room versus moderate ventilation in both could lead to the difference in a new case of infection occurring or not.
Acknowledgement
T Q H I V
B E P “ ‘esearch Council (grant number
EP K T EP“‘C . The second author undertook this work whilst based at the University of Sheffield, UK as a research associate. The contribution of the technical staff and especially by Mr Cargill and Dr Bentley to experimental setup is acknowledged.
References
AIA. Guidelines for Design and Construction of Hospitals and Health Care Facilities , The American Institute of Architects Press. Washington D.C. 2001.
Aliabadi AA, Rogak SN, Bartlett KH, Green SI. P
A P M . 2011 ID 124064.
Beggs CB, Noakes CJ, Sleigh PA, Fletcher LA, Siddiq K. The transmission of tuberculosis in confined spaces: an analytical review of alternative epidemiological models Int J Tuberc Lung Dis. 2003 7 pp 1015-1026.
BS EN 13779. Ventilation for non-residential buildings. Performance requirements for ventilation and room-conditioning systems , European Committee for Standardisation. 2007.
Choi JI, Edwards JR. Large-eddy simulation of human induced contaminant transport in room compartments , Indoor Air. 2012 22 pp77-87.
Department of Health. Health Technical Memorandum. 03-01: Specialised ventilation for healthcare premises. Part A: Design and Validation The Stationary Office. London. 2007
Eames I, Shoaib D, Klettner CA, Taban V. Movement of airborne contaminants in a hospital isolation room J R Soc Interface. 2009 6 pp S757 S766.
Fontana L, Quintino A. E
, Build and Environ. 2014 81 pp 81-91.
Gammaitoni L, Nucci MC. U M , Emerg Infect Dis.
1997 3 pp 335-342.
Kalliomäki P, Koskela H, Saarinen P, Mustakallio P, Sandberg E, Tang JW, Nicolle AD, Klettner CA, Tham KW. Air leakage from hospital isolation room during passage through a hinged door , In: Proceedings of the 10th International Conference on Industrial Ventilation, Paris, France, 17-19 September 2012.
Kalliomaki P, Koskela H, Saarinen P, Tang JW, Klettner C, Nicolle A. A
, In: Clima 2013 11th REHVA World Congress, Prague, Czech Republic, June 16-19 2013.
Kiel DE, Wilson DJ. Combining door swing pumping with density driven flow , ASHRAE Trans. 1989 95 pp 590-599.
Lee S, Park B, Kurabuchi T. T ,
In. Indoor Air 2014 13th International Conference on Indoor Air Quality and Climate, Hong Kong, July 7-12 2014.
Milton DK, G PM W MD Risk of sick leave associated with outdoor air supply rate, humidification, and occupant complaints Indoor Air. 2010 10 pp 212-221.
Nardell EA, Keegan J, Cheney SA, Etkind SC Airborne infection: theoretical limits of protection achievable by building ventilation Am Rev Respir Dis. 1991 144 pp 302-306.
Ninomura P, Bartley J. New Ventilation Guidelines for Health-care Facilities ASHRAE J. 2001 43 pp 29-33.
Noakes CJ, Sleigh A. M
, J R Soc Interface. 2009 6 pp S791-S780.
Poussou “B M “ P MW “ PE C Q F
CFD , Atmos Environ.
2010 44 pp 2830-2839.
Riley RL, Mills CC, O G F “ LU, WittStadt F, Shivpuri DN. Infectiousness of air from a tuberculosis ward Am Rev Respir Dis. 1962 85 pp 511-525.
Rudnick SN, Milton DK Risk of indoor airborne infection transmission estimated from carbon dioxide concentration Indoor Air. 2003 13 pp 237-245.
“ J L H N WN Ventilation rates and health: multidisciplinary review of the scientific literature Indoor Air. 2011 21 pp 191-204.
Sze To GN, Chao CYH. ‘ W -Riley and dose-response
Indoor Air. 2010 20 pp 2-16.
Tang JW, Eames I, Li Y, Taha YA, Wilson P, Bellingan G, Ward KN, Breuer J. Door-opening motion can potentially lead to a transient breakdown in negative-pressure isolation conditions: the importance of vorticity and buoyancy airflows J Hosp Infect. 2005 61 pp 283 286.
Tang JW, Nicolle AD, Pantelic J, Klettner CA, Su R, Kalliomaki P, Saarinen P, Koskela H, Reijula K, Mustakallio P, Cheong DKW, Sekhar C, Tham KW. Different Types of Door-Opening Motions As Contributing Factors to Containment Failu H I ‘ PLoS One. 2013 8 e66663.
Tellier R. Aerosol transmission of influenza A virus: a review of new studies J R Soc Interface. 2009 6 pp S783-S790.
Wells W Airborne contagion and air hygiene Massachusetts, Harvard University Press. 1955
Wilson DJ, Kiel DE. Gravity driven counterflow through an open door in a sealed room Build and Environ. 1990 25 pp 379-388.
WHO. Global Tuberculosis Report , World Health Organisation. Geneva, Switzerland. 2014 WHO/H TM/T B/2012.6.
Wood R, Borman DJ, Noakes CJ W AW C
Figure 1. The experimental apparatus showing the side view (left) and bottom view (right) indicating door motion.
Figure 2: Histogram of total indoor door cycle times
[image:15.595.143.495.533.726.2](a)
(b)
(c)
(d)
[image:16.595.89.524.75.676.2](e)
Figure 5: Comparison of different ventilation rates on the probability of infection ( ) from an outbreak of flu in scenario (1) an office (top) and different door schedules for a ventilation rate of
Figure 6: Probability of infection ( ) in scenario (2) due to TB spreading from a side room for two ventilation regimes.
[image:18.595.107.480.335.544.2]