PROGRAMME FOR RESEARCH AND ACTIONS ON THE
DEVELOPMENT OF THE LABOUR MARKET
ANALYSIS OF THE DYNAMICS
OF THE JOB CREATION PROCESS
IN THE UNITED STATES AND AN
EVALUATION OF MEDIUM AND
LONG TERM PROSPECTS
VOLUME I: THE ROLE OF DEMOGRAPHIC FACTORS IN U S JOB CREATION - PERFORMANCE SINCE 1 9 7 0
COMMISSION
OF THE EUROPEAN
COMMUNITIES
DOCUMENTO!
This document has been prepared for use within the Commission. It does not necessarily represent the Commission's official position.
Cataloguing data can be found at the end of this publication.
Luxembourg: Office for Official Publications of the European Communities, 1 987
Vol. I : ISBN 92-825-7583-7 Vol. Mil: ISBN 92-825-7586-1
Catalogue number: CB-04-87-001-EN-C
© ECSC-EEC-EAEC, Brussels · Luxembourg, 1987
Reproduction is authorized, except for commercial purposes, provided the source is acknowledged.
Commission of the European Communities
Programme for Research and Actions on the development of the Labour Market
ANALYSIS OF THE DYNAMICS OF THE JOB CREATION PROCESS IN THE UNITED STATES AND AN EVALUATION OF MEDIUM AND
LONG TERN PROSPECTS
Volume I: "The role of demographic factors in U.S. job creation Performance since 1970"
This document has been prepared for use within the Commission. It does not necessarily represent the Commission's official position.
Copyright ECSC-EEC-EAEC, Brussels - Luxembourg, 1987
Commission of the European Communities
Programme for Research and Actions on the development of the Labour Market
ANALYSIS OF THE DYNAMICS OF THE JOB CREATION PROCESS IN THE UNITED STATES AND AN EVALUATION OF MEDIUM AND
LONG TERM PROSPECTS
Author: Rodney Stares
Employment Initiatives, Inc.
for the Corporation for Enterprise Development
Volume I: "The role of demographic factors in U.S. job creation Performance since 1970"
Study No. 85/1
The research (Study 85/1) on which these reports were based was financed by the Commission of the European Communities as part of its programme for Research and Actions on the Development of the Labour Market.
The analysis and conclusions are the responsability of the authors.
CONTENTS
Page No,
PART ONE THE ISSUES
1. Introduction
2. The Framework of Analysis
1
2
PART TWO DEMOGRAPHIC, HOUSEHOLD AND LABOR MARKET PARTICIPATION TRENDS
3. Changing Demographics 5
4. Changes in the Size and Composition 7 of Households and Families
5. Changes in Labor Market Participation 12
PART THREE THE IMPACT ON SPENDING AND EMPLOYMENT
6. Tracing Change at the Macro Level
7. Tracing Change at the Micro Level
14
27
PART FOUR SOME PRELIMINARY CONCLUSIONS
TABLES
Page No,
3.1 Economie Dependency Ratios for Selected Years 8 4.1 The Growth in the Number of Households, 1970-1980 8 4.2 Changes in the Numbers of Households and Families 9
by Type and Number of Earners, 1970-1980.
4.3 Household, Family and 'Primary Individual' 11 Incidence Rates, 1970-1980
4.4 Families Led by Women as a Percentage of All 11 Families by Age of Household Head, 1950-1980.
4.5 Fertility Rates (Births per Woman), 1955-1995 11 6.1 Percentage Changes in Various Indices of Incomes 15
and Prices, 1972/3-1980/1
6.2 Total Money Income of Households and Families: 15 1973-83 ( in 1983 dollars )
6.3 Average Income Gain of Males by Age Group and Period 17
6.4 Interview Survey Comparisons: 1972/3-1982/3 19 6.5 Diary Survey Comparisons: 1972/3-1982/3 19
6.6 The Changing Household Budget 20 6.7 The Household Food Budget 20 6.8 Changes in the Real Value of Aggregate Consumer 22
Expenditures by Principal Categories over Selected Periods
6.9 The Changing Relative Importance of Different 23 Household Types at Different Points in Time
6.10 Sectors with Positive Output and Employment Trends: 25 1969-1984
6.11 Negative Output and Employment Trends, 1979-84 26 6.12 Positive Output and Negative Employment Trends, 26
1969-84
TABLES {_ CONTD ]_
7.1 Major Areas of Service Sector Employment Growth 29 1973-84
7.2 Changes in Patterns of Family Food Expenditures 34 196/1-1980/1
7.3 Housing Starts and Mobile Home Shipments 36 7.4 The Components of Housing Growth 1970-80 38 7.5 Household Construction and Related Services 1973-84 38
FIGURES
2.1 How Demographic Changes Might Work Themselves 3 Through to Change Employment
PART ONE THE ISSUES
Introduction
One of the great unresolved questions about the U.S. economy concerns the factors driving its ι e mar kabl e job creation performance since 1973. It was a performance made all the more impressive since it occurred during a period in which the rate of income and output growth was both erratic and below the trends of the previous two decades, and the number of new job seekers rose rapidly as the baby boom generation reached working age.
Analyses made of the performance of the goods-producing sectors of the economy which stress changes in the terms of trade for manufactured exports appear to explain - at least up to 1979 - the modest employment growth of that sector, but there is far less clarity let alone unanimity as to what has been powering the far larger, more diverse and more dynamic service sector.
Much is known about who took the jobs, in what states and in what sectors they occurred and what role small and large businesses had to play in the process. Far less is known as to the why of employment creation. All too often, reference is made to the parallel phenomenon of large numbers of new labor market entrants, both from the baby boom generation and women from the population cohorts that preceeded it, as if the sheer increased supply of labor was itself a sufficient explanation.
Among the explanations proffered, are changes in relative factor prices, the income elasticity of labor intensive services, changes in technology and consumer preferences, the redrawing of the boundaries between the goods producing and service sectors, and, last but not least, an amalgam of so called 'demographic factors. '
The aim of this paper is to examine what is known or can be deduced about the operation of such demographic factors. It begins by suggesting some of the possible ways that demographic change might effect job creation and by delineating which of these will be examined in this paper. It then goes on to briefly review the changes brought about in the age structure of the population and by the maturation into adulthood of the baby boom generation and describes some of the major changes that have been happening to the American household and family.
Armed with this background knowledge, the paper pursues two separate lines of enquiry,
at the macro economic level it attempts to see if changes in demographic factors have influenced the
pattern of expenditure in ways favoring job creation.
at the micro level, it looks at what is known about the factors powering the growth of the largest job creating sectors and subsectors.
c o n c l u s i o n s about t h e s c a l e and s i g n i f i c a n c e of the demographic f a c t o r s examined.
2. The Framework of A n a l y s i s
One of t h e p r o b l e m s c o n f r o n t i n g any a t t e m p t t o a s s e s s t h e r o l e of demographic v a r i a b l e s i-: t h a t they a r e so embedded in t h e b r o a d e r m a t r i x of f a c t o r s t h a t i t i s d i f f i c u l t t o s e e c l e a r l y w h e r e t h e y b e g i n and l e a v e off and w h e t h e r t h e y a r e c a u s e , e f f e c t or p e r h a p s b o t h . For e x a m p l e , i t i s p a r t of t h e c o n v e n t i o n a l wisdom t h a t t h e m a t u r a t i o n of t h e baby boom g e n e r a t i o n to working age had a s i g n i f i c a n t d e p r e s s i v e i m p a c t on a v e r a g e r e a l i n c o m e g r o w t h - w h e t h e r t h i s i s a t e m p o r a r y p e r m a n e n t phenomenon i s a m a t t e r of d i s p u t e . At t h e same t i m e , s t a b l e or f a l l i n g r e a l income a r e a l l e g e d t o have l e d t o t h e p o s t p o n e m e n t of m a r r i a g e p l a n s and c h i l d b e a r i n g - a l l of which may have changed the l e v e l of d i s c r e t i o n a r y h o u s e h o l d i n c o m e or t h e o v e r a l l p a t t e r n of e x p e n d i t u r e s in way f a v o r a b l e to more l a b o r i n t e n s i v e a c t i v i t i e s . M a r r i a g e and f a m i l y p o s t p o n e m e n t , for t h e e a r l i e r baby boomers a t l e a s t , may a l s o have been due t o a ' m a r r i a g e s q u e e z e ' s t e m m i n g from a s h o r t a g e of e l i g i b l e o l d e r male p a r t n e r s . Then a g a i n , i t may have more t o do w i t h c h a n g e s i n women's e x p e c t a t i o n s and s o c i e t y ' s o v e r a l l p r e f e r e n c e s .
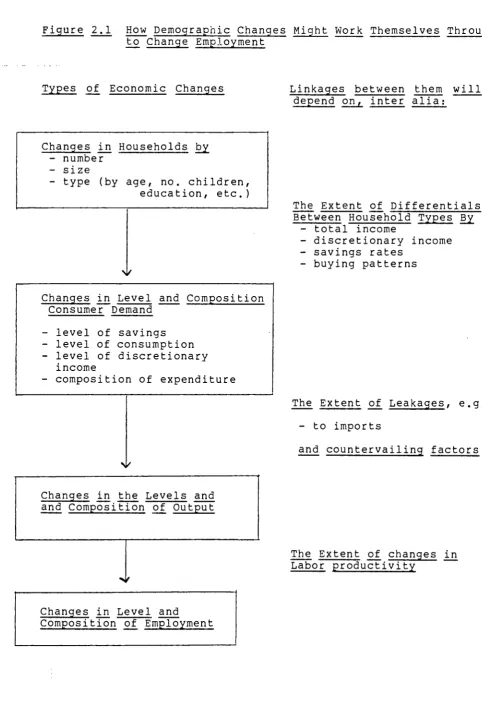
Given t h e s e c o m p l e x i t i e s , i t s e e m s s e n s i b l e t o b a s e t h e a n a l y s i s on some r e l a t i o n s h i p s t h a t have l o n g b e e n p a r t of economic t h e o r y . Four p r o p o s i t i o n s making up a c a u s a l c h a i n can be h y p o t h e s i z e d ,
t h a t a m a j o r and s u s t a i n e d i n c r e a s e i n t h e b i r t h r a t e w i l l h a v e a wave l i k e e f f e c t on t h e s i z e and age s t r u c t u r e of t h e p o p u l a t i o n and h e n c e on t h e l e v e l of household f o r m a t i o n
t h a t d i f f e r e n t p h a s e s of t h e f a m i l y l i f e c y c l e from f o r m a t i o n to d i s p e r s i o n give r i s e to d i f f e r e n t l e v e l s and p a t t e r n of consumer spending
t h a t s u b s t a n t i a l changes in the mix of h o u s e h o l d s w i l l change t h e l e v e l and c o m p o s i t i o n of consumer demand
t h a t changes in t h e l e v e l and c o m p o s i t i o n of a g g r e g a t e c o n s u m e r demand w i l l i n f l u e n c e t h e l e v e l of e c o n o m i c a c t i v i t y and employment.
Figure 2.1 How Demographic Changes Might Work Themselves Through to Change Employment
Types of Economic Changes Linkages between them will depend on, inter alia :
Changes in Households by - number
- size
- type (by age, no. children, education, etc.)
Changes in Level and Composition Consumer Demand
- level of savings - level of consumption - level of discretionary
income
- composition of expenditure
Changes in the Levels and and Composition of Output
Changes in Level and
Composition of Employment
The Extent of Differentials Between Household Types By
- total income
- discretionary income - savings rates
- buying patterns
The Extent of Leakages, e.g.
- to imports
and countervailing factors
Turning to the literature on this topic for guidance reveals a rather schizophrenic picture. On the one hand, there is a very considerable body of marketing literature on the likely impact of the baby boom on different classes of expenditure and sectors. On the other, it is a field that has attracted little serious academic study except by those interested in the debate about the effects of demographics on income inequality.
PART TWO CHANGING DEMOGRAPHICS, HOUSEHOLD SIZE AND COMPOSITION AND LABOR MARKET PARTICIPATION
3. Changing Demographics
During the period from 1970 to the early 1980's, three factors were working to change the age structure of the U.S. population; the maturation of the post-war baby boom generation, the inflow of migrants and increased life expectancy especially for older people. Of these, the first was by far and away the most significant.
Defined as the cohort born between 1946 and 1964, the baby boom generation has been described by Louise Russell as "a discontinuity in the age structure of the population, [one] unique in the history of the United States." (1)
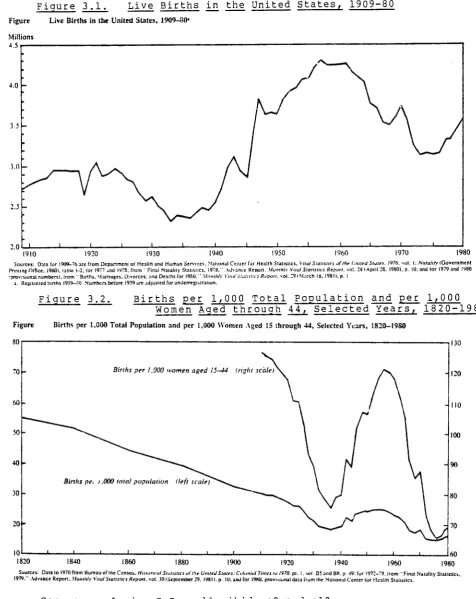
As can be seen from Figures 3.1 and 3.2, the number of live births per year during most of this period exceeded 3 million and reached 4.3 million in the highest year 1957. From a low point just before WWII, the number of births per 1000 women of child bearing age increase by a factor of 50% until 1957 then fell back to its previous low point by the early 1970's. This spectacular rise in fertility was the product of the comparatively small female cohorts of the 1930's marrying earlier and in larger numbers, starting families earlier and in larger numbers and most importantly going on to have more children.
Between 1970 and 1980, the vast bulk of the baby boom generation came of age and began to make economic and family decisions. On its own the maturation of such a large number of people had the effect of significantly changing the balance between the population of working age and the dependent young such that in 1970, the ratio was more favorable than at any time since the early 1900's. This position was improved further by the child bearing behavior of the early baby boomers who substantially reversed the reproductive habits of their parents with the result that the number of live births continued to drop for most of the 1970's and was only reversed towards the end of the decade as a result of the sheer weight of numbers of women in the reproductive age band.
The very different reproductive behavior of the baby boomers was the product of four forces.
a smaller percentage of the cohort getting married; seemingly, in the early 1970's, at least, as a result of a "marriage squeeze" caused by a shortage of more senior male partners. [58.5% of women aged 20-24 in 1985 had never married, compared to 44.3% in the same age band in 1970. ]
F i g u r e 3 . 1 . Live B i r t h s i n t h e U n i t e d S t a t e s , 1909-80 Figure Live Births in the United States, 1909-SO·
1910 1920 1930 1940 1950 1960 1970 1980
Sources: Dala for 1909-76 are from Department of Health and Human Services. National Center for Health Statistics. Viial Statistics of the United States. 1976. vol. I: Natality (Government Pnnnng Office. 19801, table 1-2: for 1977 and I97S. from 'Final Natality Statistics. 1978.' Advance Report. Monthlt Vital Statistics Report, vol. 291 April 28. 19801. p. II); and lor 1979 and 1980 'provisional numbers!, from "Births. Marriages. Divorces, and Deaths for 1980."' Monthly Vuol Stottsf.es Report, vol. 29 ( March 18. 1981). p. 1
a. Registered births I959-S0 Numbers before 1959 are adjusted forunderregistratiun.
B i r t h s p e r 1,000 T o t a l P o p u l a t i o n a n d p e r 1,000 Women Aged t h r o u g h 4 4 , S e l e c t e d Y e a r s , 1 8 2 0 - 1 9 8 0 F i g u r e 3 . 2 .
Figure Births per 1.0OO Total Population and per 1,000 Women Aged 15 through 44, Selected Years, 1820-19S0
30
Births per 1.000 women aged 15—(4 fright scale)
10 1820
130
1840 I860 1880 1900 1920 1940 I960
60 1980
Sources; Data to 1970 from Bureau of the Census. Historical Statistics afilie United States: Colonial Times to 1970. pi. I. ser. B5 and BH. p. 49: for 1972-79. from "Final Natality Statistics. 1979." Advance Report. Monthly Vital Statistics Report, vol. 30 (September 29. 19811. p. 10: and for 19X0. provisional data from the National Center for Health Statistics.
[image:16.595.52.529.98.698.2]a marked tendency towards later marriages.
[Whereas 54% of the 1935-39 cohort of women had married by the time they were 21, the corresponding percentage for those in the 1950-54 cohort was 45%]
the delaying of childbearing once married.
[The proportion of women having children in their first 3 years of marriage declined from 78% in the late 1950's to 58% in the early 1970's]
far fewer children per couple with a fall from an average of 3.4 per couple to 2.1.
To summarize, whereas in 1960 of women ages 20-25, 72% were married and 55% were mothers, the corresponding figures for 1985 were 41% and 34%.
As a result of these trends, the dependency ratios, which were already more favorable in 1970 that at any time since the early 1900's, continued to improve throughout the Seventies for all groups except the elderly (see Table 3.1).
4. Changes in the Size and Composition of Households and Families
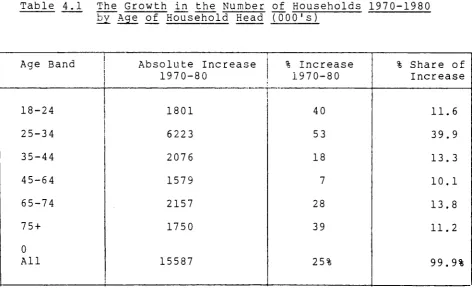
In the decade 1970-1980, there was a rapid growth in the number of households. As can be seen from Table 4.1, an overall rate of growth of 25% led to the creation of over 15 million new households. The fastest rates of growth were at either end of the age pyramid and the largest absolute contribution was among the central baby boom cohort, the 25 to 34 year olds.
This phenomenon was the product of two somewhat separate forces.
the very rapid expansion in the numbers of persons in the age band that typically begins to form households as the baby boomers moved through the age structure. an increase in household incidence rates (the propensity to form households) for most age groups but very particularly among both the younger and older cohorts. Over the period, incidence rates for the 25-34 age group moved up closer to those for the 35-64 year age group.
Besides the change in the number of households, there were four important changes in the composition of those households.
Firstly, within the vastly expanded total of households the importance of 'primary individuals' increased substantially. 'Primary individuals' are defined by the Census Bureau as households where the household head lives alone or with a non-relative.
Table 3.1 Economic Dependency Ratios* for Selected Years
Age Band
Under 16 years 16-64 65 + Overall
1955
74.9 51.4 16.4 142.8
1965
81.3 50.6 19.9 151.8
1975
61.1 43.4 20.5 125.0
1984
47.9 34.9 21.7 104.5
1995(est)
46.1 28.2 24.0 98.4
* Defined as the number of persons in the relevant age band not in the labor force as a percentage of all those who are.
Source: Based on CPS data.
Table 4.1 The Growth in the Number of Households 1970-1980 bv Age of Household Head (000's)
Age Band
18-24 25-34 35-44 45-64 65-74 75 + 0 All
Absolute Increase 1970-80
1801 6223 2076 1579 2157 1750
15587
% Increase 1970-80
40
53
18
7
28
39
25%
% Share of Increase
11.6 39.9 13.3 10.1 13.8 11.2
99.9%
[image:18.595.62.535.377.679.2]Table 4.2: Changes in the Numbers of Households and Families by Type and Numbers of Earners 1970-1980
Category
Married Couple Families
No Earners One Earner Two'Earners Three or more
Women-led Families
No Earners One Earner Two or more
Men-led Families
No Earners One Earner Two or more
TOTAL FAMILIES
Primary Individuals
TOTAL HOUSEHOLDS
1970
44,832
3,252 16,117 18,592 6,872
5,968
1,326 2,648 1,993
1,261
132 530 600
52,061
11,416
63,477
1980
49,316
5,903 13,900 22,446 7,067
9,416
2,216 4,612 2,589
1,969
244 891 835
60,701
18,363
79,064
Absolute Increase 1970-1980
4,484
2,651 -2,217 3,854 195
3,448
890 1,964 596
708
112 361 235
8,640
6,947
15,587
%
Increase 1970-1980
10%
80.9
20.7
57.8%
67.1 74.0 29.9
56.1%
84.8 60.2 39.2
16.6%
60.8
25%
10
As can be seen from Table 4.3, between 1970 and 1980, the incidence rate for household formation by families* hardly rose, and indeed dropped for the large 25-34 year old cohort, while the corresponding rates for primary individuals took off. As a result by 1980 more than 20% of all households headed by people aged 25-34 were primary individuals. Among these, the vast majority were living on their own. For the younger age groups this tendency appears to have been due to a postponement of marriages while for older groups it is linked to the rising divorce rate.
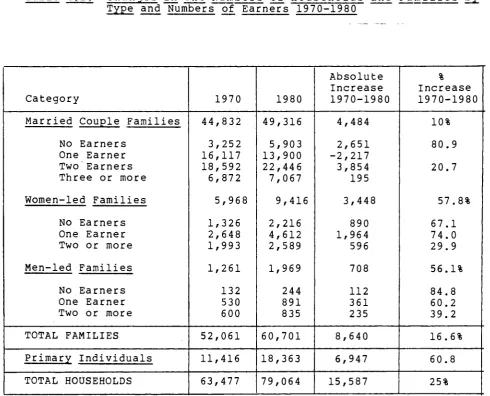
Secondly, within the total of families, there was a marked upward trend in the number and percentage of families headed by women. (See Table 4.4.)
Thirdly, the percentage of families without children has risen.
Lastly, as a result of a variety of factors, there has been a decline in average family size. Whereas married women aged 18-24 and 25-29 planned to have on average 3.1 and 3.4 children respectively in 1960, by the mid-seventies, the aspirations of their eguivalents had dropped to only slightly more than two on average.
Table 4.5 below shows how these expectations actually turned out and are projected to continue.
Since 1980, these trends have continued albeit at a slightly less dramatic pace,
the rate of growth of households has dropped back from 2.5% p.a. to 1.5% p.a.
non-family households are still growing in numbers more rapidly than family households, but the differential in rates of growth has narrowed from 5 to 1 to 2.5 to 1.
the fastest growing household category is now those headed by a male or female single parent.
the numbers of married couples with children are falling rapidly due to a combination of continued divorce rates and 'nest clearing' among older families.
the continued rise of the independent elderly living apart from their children. [66% of all post 65 year old households in 1985.]
11
T a b l e 4 . 3 : C h a n g e s i n H o u s e h o l d , F a m i l y a n d ' P r i m a r y I n d i v i d u a l ' I n c T i d e n c e Rates~*( H o u s e h o l d s p e r 1000 P e r s o n s i n Age G r o u p ) by Age of H o u s e h o l d Head : 1970-80
Age Band
18-24 25-34 35-44 45-64 65-74
75+
! % Change 1970-1980
All
Households +14.8% + 7.2 + 6.6 + 1.8 + 3.0 + 11.6
Families -12.6 -8.0 + 1.3 -0.6 + 1.0 + 0.3
Primary Individuals
+ 20.2 +140.8
+ 68.3 + 13.5 + 6.6 + 23.2
S o u r c e : C a l c u l a t e d from R u s s e l l , i b i d . T a b l e 5 - 2 , p94
Table 4.4: Families Headed by Women as a Percentage of all Families by Age of Household Head: 1950-1980
Age of
Household Head 15-25
25-34 35-44
1950 1960 1970 1980
4.4 19 4 16 7 16
Source: Based on Census data,
T a b l e 4 . 5 : F e r t i l i t y R a t e s ( B i r t h s p e r Woman) By Year and Race
Group
White Black
1955
3.4 4.1
1965
2.8 3.6
1975
1.7 2.2
1982
1.8 2.3
1995 (projected)
1.9 2.0
[image:21.595.56.545.101.522.2]12
5. Changes in Labor Market Participation
The 1970's Were characterized by two main trends, the rapid rise in women's participation in the labor force and the gradual withdrawal of the older age groups especially males over 55.
As far as women's participation is concerned, two trends were apparent.
each successive cohort of women reaching maturity exhibited a higher level of labor force participation rate than the one that preceeded them (i.e. the whole labor curve moved up).
the age profile of female participation didn't just move up, but also changed its shape as the valley caused by the lower rates for women aged 30-39 gradually disappeared (i.e the shape of the curve changed).
During the early 1970's, the rate of change in these trends was very rapid, but by the late 70's it had slowed down considerably. In part, the rising participation rates were a function of the growing percentage of unmarried women -- who traditionally have higher participation rates. However, increasingly, married women and women with children (and even with children under 1 year of age) began to participate.
Between 1970 and 1985, the number of married women working doubled. By March 1985, 49.4% of married women (and 48% of all mothers) with children less than a year old worked outside the home. This was an increase of 10 percentage points in 5 years and a doubling since 1970.
This performance was unique among OECD countries, not in the rate of growth of female labour market participation - the Netherlands and Italy grew faster - but in the fact that it occurred from an already high base level. Countries such as the U.K., France and Germany which also started the period with high levels of participation registered low or stagnant growth rates.
Among the principal factors cited as lying behind this development are the decline in fertility allowed by the spread of simple low cost birth control technology, higher levels of educational attainment and consequent aspirations among women and
the economic pressures on the family produced by stagnant or falling real wages.
13
14
PART THREE THE IMPACT ON SPENDING AND EMPLOYMENT
6. Tracing Change at the Macro Level
6.1 Typically, changes in the pattern of consumer expenditure are seen to depend on prices and incomes in the shorter term and changes in products, consumer ■; references and
demographic factors over the longer 2rm. Given the
difficulty of handling changes in products and preferences in any systematic way, emphasis tends to focus on incomes, prices and demographic effects. The following sections review what light the various official statistics can throw on these issues.
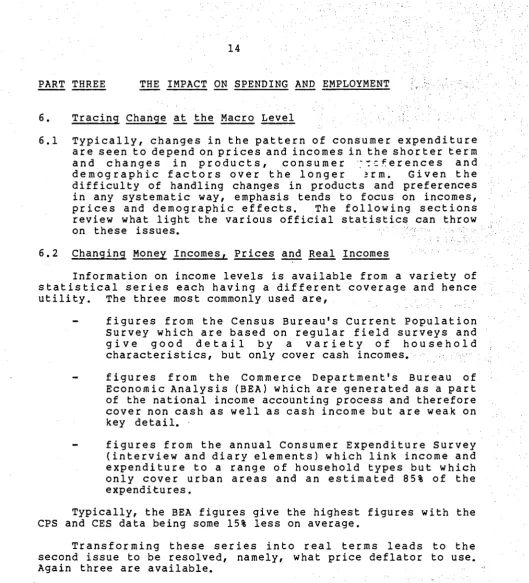
6.2 Changing Money Incomes, Prices and Real Incomes
Information on income levels is available from a variety of statistical series each having a different coverage and hence utility. The three most commonly used are,
figures from the Census Bureau's Current Population Survey which are based on regular field surveys and give good detail by a variety of household characteristics, but only cover cash incomes.
figures from the Commerce Department's Bureau of Economic Analysis (BEA) which are generated as a part of the national income accounting process and therefore cover non cash as well as cash income but are weak on key detail.
figures from the annual Consumer Expenditure Survey (interview and diary elements) which link income and expenditure to a range of household types but which only cover urban areas and an estimated 85% of the expenditures.
Typically, the BEA figures give the highest figures with the CPS and CES data being some 15% less on average.
Transforming these series into real terms leads to the second issue to be resolved, namely, what price deflator to use. Again three are available.
the traditional Consumer Price Index (CPI-U).
a modified CPI designed to put shelter costs on a rental equivalency basis of measurement instead of the CPI-U's asset purchase approach.
the implicit GDP deflator from the national accounts system.
[image:25.595.36.566.29.613.2]15
Table 6.1: Percentage Change in .Various Indices of Incomes and Prices, 1972/3-1980/1
1972/3 - 1980/1
Avg. Ann. Pre-Tax Income per Consumer Unit
" " (full reporters only)
(Excluding students & non-reporters)
Avg. Ann. Pre-Tax Income Per Person
Consumer Expenditure Survey Diary
Survey
56%
72%
88%
92%
Interview Survey
61%
63%
CPS
78%
CPU
CPI-U CPI-UXI
94% 81%
Source: Consumer Expenditure Survey 1980-81. Diary Survey p.5
Table 6.2: Total Money Income of Households and Families: 1973· 83. (in 1983 dollars)
ALL RACES
No. Households
Median Income Mean Income
No. Families
Median Income
1973
69,859
23,567 27,255
55,053
27,017
1975
72,867
21,843 25,507
56,245
25,395
1977
76,030
22,313 26,430
57,215
26,320
1979
80,776
22,595 2F,d40
59,550
26,885
1981
83,527
20,895 24,962
61,019
24,525
1983
85,407
20,885 25,401
61,997
24,580
[image:26.595.67.531.511.691.2]16
[image:27.595.40.548.7.842.2]estimate being that at the average level real incomes per household stagnated or fell slightly. However, when changes in the incidence of taxation are also taken into account, the likelihood is that the final post tax household income loss was even worse.'
Table 6.2 shows how real household and family income changed over the period 1973 to 1983 as Itllated by the traditional consumer price index. Average household incomes were depressed for a variety of reasons; within the total workforce younger workers just starting out made up a bigger share, the adult/youth wage differential widened appreciably and unemployment rates moved up substantially over the period.
While average post tax income levels per household unit fell overall during the period, the impacts at the family and the per capita level were substantially different.
at the family level (i.e., leaving aside the non-family households), the decline in real incomes appears to have been slightly less than the fall in household incomes (9% as compared to 11.4%) over the period. This was probably due to the differences in the average numbers of earners in families as compared to non-traditional households and the higher average age of family heads tending to give them higher average wages.
at the per capita level, incomes did better; rising in real terms by 2.8 % (CPS) or 11.4% (BEA) between 1973 and 1983 due to the 14% fall in the average size of consumer units.
Within these overall aggregates, different sub groups had significantly different experiences.
all families with children suffered a decline in their median real income (down 8.3% between 1973 and 1984).
the post 65 age group did best, especially between 1979 and 1984, when their incomes rose 13% in real terms. As a result, a far lower percentage were in poverty at the end of the period and the incidence of poverty had fallen to below the overall national average (12.4% compared to 14.4%).
the under 25's did worse with a fall in their real incomes of 18% between 1979 ard 1984.
In short, the increase in agg "gate purchasing power between 1973 and 1984 arose from the rapid increase in the numbers of household units and wage earners without a corresponding rise in the number of dependent persons. In addition transfer payments made a bigger contribution than hithertoo. This contrasts sharply with the 1950's and 60's when increased purchasing power stemmed from steady increases in real wages.
17
Without their contribution most families would have seen their incomes fall and in many cases, fall below the poverty level.
The improvement in the relative position of older people appears to have derived from their access to retirement incomes from both public and private transfers, and the cushion afforded by owning their own homes during a period of rapidly rising housing costs.
The principal victims of the period were the younger half of the baby boom generation, especially males, who experienced a major reduction in their income earning prospects relative to what their fathers had experienced on getting started in the labor market.
Table 6.3 illustrates this by looking at the gain that different age bands of male wage earners the 10 years prior to 1973 and that after it.
[image:28.595.71.538.376.495.2]real income received over
Table 6.3: Average Income Gain of Males by Age Group and Period
Age Group
% Income Gain
Males Passing from age 25 to 35 % Income Gain
Males Passing from age 40 to 50 in period
1963-1973
110%
25%
1973-1983
16%
-14%
Source: The Economic Futuxe of the Baby Boom: Frank S. Levy & Richard MicheïT prepared for Joint Economic Committee of U.S. Congress, December, 1985.
6.3 Changes in Consumption Levels and Patterns
Despite the less propitious overall economic environment of much of the post 1973 period and the poor performance of real wages and average family incomes, consumption per capita rose more rapidly than during the expansionary 50's.
Two other factors, acart from rising per capita incomes, seem to have contributed to higher consumer expenditures; a reduction in savings rates and an increase in consumer and family debt burdens.
in 1981, young families saved less than 1% of their after tax income, compared to 4% for a similar group in 1973.
Commission of the European Communities
Programme for Research and Actions on the development of the Labour Market
ANALYSIS OF THE DYNAMICS OF THE JOB CREATION PROCESS IN THE UNITED STATES AND AN EVALUATION OF MEDIUM AND
LONG TERM PROSPECTS
Volume I: "The role of demographic factors in U.S. job creation Performance since 1970"
This document has been prepared for use within the Commission. It does not necessarily represent the Commission's official position.
Copyright ECSC-EEC-EAEC, Brussels - Luxembourg, 1987
18
in 1983, 77% of families in the 25-34 age bracket had incurred some form of installment debt compared to 67% in 1970.
in 1980, nearly one third of first time home buyers got financial assistance from their relatives (1978, 10%).
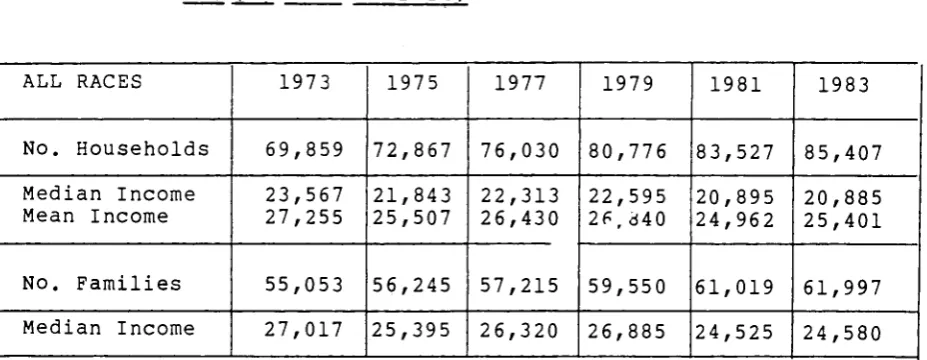
Changes in the composition of consumer expenditures within this expanding toto., are revealed by a comparison between the Consumer Expenditure Surveys of 1972/3 and those of 1982/3. Tables 6.4 and 6.5 compare - for the Interview Survey and the Diary Survey respectively - the absolute changes between the two years, the percentage change for each class of expenditure and how it compared to the relevant part of the Consumer Price Index. Several points stand out,
several areas of major expenditure increases (fuels utilities and public services, gasoline, owned dwellings) have been due to corresponding price increases.
expenditure on alcoholic beverages appears to have increased far faster than inflation, but part of this is attributed to previous under-reporting problems.
average food expenditures failed to keep up with inflation, but within the total, food away from home expenditures outpaced price rises.
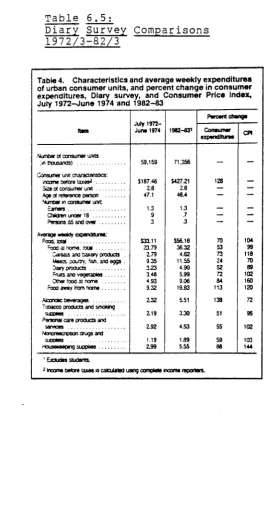
Another way of looking at these changes is to see how the percentage distribution of the total household budget has shifted. Tables 6.6 and 6.7 show the figures from the Interview and Diary Surveys. They indicate that between 1972/3 and 1982/3
(the latest date for which there are figures).
the share of the total budget taken by food has increased slightly (1% point), but that this has been in the form of eating out, not food at home.
the rise in total housing related costs would have been far higher were it not for a reduction in the share of house furnishing expenditures.
transportation took a larger bite of the household budget in 1982/3 than 1972/3 mainly through the increased running costs element.
recreation and alcoholic beverages registered small gains in t^eir shares while health slipped back.
the major losers were apparel and other goods and services.
19
T a b l e : 6.4
I n t e r v i e w Survey Comparisons
1972/3-1982/3
T a b l e 6 . 5 :
D i a r y Survey Comparisons
1972/3-S2/3
Table 3. Characteristics and average annual expenditures of urban consumer units, ana percent change in consumer expenditures, Interview survey, and Consumer Price Index, 1972-73 and 1982-831
item
Numb« of consumer units (in thousands)
Consumer umt cftaraaensics: Income before taxes? Size of consumer unit Age oí reference person . . . Number in consumer unit:
Earners Venues Children under 18 Persons 65 and over Totaf exDendrtures
Food Food at home Food away from home AJchohottc beverages Housng
Shelter Cwned dwellings Rented dwellings Other lodging Fuels, utilities, and public
services Household operations Housefurmshings and equipment . Apparel and services
Transportation Vehicles
Gasoline and motor ori Other vehicle expenses Public transportation Healthcare Entertainment Personal care services Reading
Educarjon Tobacco Miscellaneous Cash contributions
Personal insurance and pensions Life and other personal
nsurance
Retirement, pensions. Social Security 1972-73 58.948 S12.388 1 8 47.1 1.3 1.8 1.0 .3 SS.421 1.675 1,313 362 39
1 6 3 8 1 £07
746 544 117 581 :33 411 -22 1.762 709 404 540 Π 0 432 389 106 50 126 131 102 372 318 367 1982-83 70.329 S23.027 2.6 46.6 1.4 1.8 .7 3 S19.128 3.175 1238 337 236 5.869 3.309 '.547 '.065 296
' 512 275 773 1.039 3,766 1,425 1.076 1.034 231 334 379 178 128 257 208 274 586 1.651 252 '.388
Percent change Consumer expenditures 103 90 Ό 159 221 122 120 161 55 153 160 99 42 114 101 156 31 110 33 126 58 156 104 59 169 35 104 CPHI 118 113 130 76 -59 3154 3192 127 71 58 142 3130 232 3102 146 154 38 103 3119 3126
< Expenditure categories for 1972-73 were adjusted to correspond wrthl 982-83 definrrjons; estimates for 1982-83 exclude students.
2 Income before taxes is calculated using complete income reporters. 3 Estimated.
Table 4. Characteristics and average weekly expenditures of urban consumer units, and percent change in consumer expenditures, Diary survey, and Consumer Price Index, July 1972-June 1974 and 1982-83
Item
Number of consumer units (in thousands)
Consumer umt charactensucs:
Age of reference person Number m consumer unit
Average weekly expenditure·: ^ood at home, total
Cereals and bakery products . Meats, poultry, fish, and eggs . Fruas and vegetables Other food a home Food away from home
Aleonóte beverages Tobacco products and smoking Personal care produca and
suocaes July 1972-June 1974 59,159 $187.46 1 8 47.1 1.3 9 3 S33.11 23.79 1 7 9 9.35 3.23 3.48 4.93 9.32 1 3 2 1 1 9 1 9 2 1.19 1 9 9
1982-831 71.356 $427.21 1 8 48.4 1.3 .7 .3 $56.16 36.32 4.82 11.55 4.90 5.99 9.06 19.83 5.51 3.30 4.53 1.89 5.55 Percent Chang· Consumer expenditure* 128 70 53 73 24 52 72 84 113 138 51 55 59 86 CP1 104 99 118 70 89 102 160 120 72 95 102 103 144 1 Exaudes students.
2 Income before taxes rs calculated using complete income reporters.
[image:32.595.40.555.65.827.2] [image:32.595.46.276.94.614.2] [image:32.595.289.554.95.628.2]20
Table 6.6
Interview Survey Data
T a b l e 6.7
D i a r y Survey Data
The Changing Household Budget
Total Expenditures =
TOTAL EXPENDITURES
Food
Food at Home Food Away from Home
Alcoholic Beverages & Tobacco
Housing Shelter
Fuels, Utilities. Public Services housenold Operations Hcusefurnishings & Equipment
Apparel and Services
Transportation Vehicles
Other, Incl. Vehicle Expenses
Health 2nd Personal Care
Recreation
Other Goods and Services
100c/o
Eariy 1970's 10G.0PÓ 17.8 13.9 3.8 2.3
2 3 0 16.0 P2 1.5 4.4 7.3 18.7 7.5 11.2 5.7 4.1 15.6 Ε3ΠΥ IG:O'S 100.0% 18.3 14.1 4.7 2.5 -95 ¡6.5 7.4 1.5 4.1 5.5 201 5.8 13.3 5.3 44 13.8
The Household F o o d Budget Total Food at Home = 1 0 0 %
(Annual Expenditures)
FOOD AT KOME-TOTAl
PERCENT DISTRIBUTION
Cereal and bakery products
Cereal and cereal products Breed
Other bakery products
Meat
Beef Pork Other meats
Poultry
Fish and seafood
Dairy producís
i:resh milk and cream
Cheese Other
Fruits and vegetables Fruits
Vegetables
Other foods
Fats and nils
Sugar and other sweets All other ■
Nonalcoholic beverages
Early 1970s
SI.231 45 S1
100.0% 119 3.1 3.5 5.3 28.9 15.4 8.8 4.7 4.6 2.8 13.8 6.8 2.8 4.2 Early 1930s 775.75 100.0% 12.6 4.0 3.2 5.4 24.5 13.1 6.8 4.6 4.4 3.1 13.4 7.0 3.7 2.7 14.4 6.7 7.7 16.3 2.8 3.0 10.5 7.3 15.6 8.2 7.4 17.5 2.8 3.6. 11.1 8.9
Source; How Consumers Spend Their Money; Conference Board
[image:33.595.44.546.27.692.2]21
Table 6.8 contains some crude data on the categories of expenditure that experienced the largest absolute increases over the period 1972/3 to 1982/3. Column one gives estimates for total consumer expendi ture on the particular item, column two gives actual figures for urban consumers covered by the interview survey element of the Consumer Expenditure Surveys for each year. Several interesting points can be noted,
on the basis of the expenditure patterns of urban consumers the expenditures on house ownership appear to make up the largest single component of the increase in aggregate real consumer expenditures over the period.
expenditures on entertainment suprisingly provided the second largest increase in aggregate expenditure.
food away from home experienced a major increase in expenditure but the increase in overall food expenditure was brought down by the fall in expenditure on food for consumption at home.
expenditure on alcohol was also a major common item as was home furnishing and equipment and transport.
Even allowing for a degree of under-recording of alcohol and away from home food expenditures in 1972/3, the size of the expenditure increases in both categories (128.6% and 35.1% respectively) clearly goes some way to explain the major expansion that occurred in eating and drinking establishments during the period. Taking together the expenditure increases on entertainment and reading and also allowing for the fact that a part of the increase in household furnishing and equipment would consist of entertainment equipment (TV's, VCR's) it would appear that the entertainment industry has also been a very dynamic sector.
Several expenditure categories are not covered in the table; cash contributions, personal insurance and pension and miscellaneous, of which the last was both the largest and has experienced the biggest increase in nominal terms. Unfortunately price indices are not available for these categories so it is not possible to calculate what has happened in real terms.
One way of attempting to find out to what extent this pattern of increases in aggregate expenditure was the product of changing demographics is to look at how the proportions of different household groups changed over the period since these provide the weights that go to determine the overall picture.
Table 6.9 shows the changes over a variety of time periods as they affected three different categories of households; by type, by size and by age of household head. While some of the
trends appear constant throughout the whole period, others seem to be in the process of reversing themselves,
22
Table 6.8 Changes in the Real Value of Aggregate Consumer Expenditures by Principal Categories over Selected Periods ($bn 1982/3 prices)"
Home Ownership
Entertainment
Home Furnishings & Equip.
Food
- Away from home - At home
Alcohol
Transport
Fuels & utilities
Apparel & Service
Reading
Education
Tobacco
Household Operations
Health
1972/3-1982/3 (2)
n/a
24.1
13.6
19.5 -7.1
13.2
10.3
7.2
7.6
4.4
n/a
-0.1
-1.4
n/a
1972/3-1982/3 (1)
21.3
18.7
12.9
16.8 -7.5
11.1
13.5
6.3
5.7
2.5
1.3
-0.7
0.9
-6.0
(1) Based on average annual expenditures of urban consumers by expenditure class deflated by the corresponding consumer price indices and multiplied by universe of consumer units.
(2) Based on aggregate expenditure figures grossed up (to include rural as well as urban consumers) for purposes of comparison with Personal Consumption Expenditures in the National Accounts.
Sources;
Column 1. Giesman & Rogers, Monthly Labor Review, June '86, P. 17.
[image:35.595.45.527.44.563.2]23
Table 6.9 The Çhjançj__ij}_g_ R£l..a t_iv.e_ Importance of Different Household Types at Different Points in Time
A. Type of Household Single Household
- No earner - One earner Consumer Units of Two or More
- No earner - One earner - Two earners - Three or more
B. Size of Household - One Person - Two
- Three - Four - Five - Six
C. Age of Household Head - Less than 25
- 25-34 - 35-44 - 45-54 - 55-64 - 65 +
1972/3 10.1 12.6 11.0 27.6 28.2 10.5 100.0 25.1 26.6 16.1 14.8 8.7 8.7 100.0 9.5 20.5 16.9 18.3 15.8 19.0 100.0 1980/1 9.8 16.9 9.1 20.6 31.8 11.8 100.0 26.7 29.3 16.9 14.7 7.1 5.3 100.0 10.9 23.6 16.7 14.2 15.2 19.4 100.0 1982/3 9.9 18.8 10.1 21.0 30.0 10.1 100.0 28.7 29.3 15.8 15.0 6.7 4.5 100.0 9.8 24.0 18.2 14.0 14.6 19.4 100.0 1985(E) 100.0 23.7 31.6 17.6 15.7 11.2 100.0 6.3 23.1 20.0 14.6 15.1 20.9 100.0 Source; Consumer Expenditure Surveys 1972/3, 1980/1, 1982/3 and
[image:36.595.39.540.105.638.2]24
among different sizes of household the proportion of one person households has continued to rise while that for those with five plus has continually fallen. The middle categories have experienced a variety of trends.
among different age groups the 25-35 age band initially rose and is now falling again, the 35-45 band has seen its percentage rise throughout as has the post 65 group. Those between 45 and 65 first rose in percentage
terms and now seem to be slipping back.
Using the proportions of different household groups in 1972/3 as weights it is possible to calculate what aggregate expenditure would have been on each expenditure category in 1982/3 had household composition stayed the same as in 1972/3. For most of the major expenditure categories there would have been little change. Expenditures on food for home consumption would have been 6.8% higher and those for transport, utilities and entertainment would have been 3.5%, 4.0% and 3.9% higher respectively. Overall therefore it would not appear that changes in the mix of household types has had a major impact on aggregate spending.
6.4 Changes in Output and Employment
As with income statistics, there is more than one series that can be used to review output trends. The two principal sources are,
the figures on Gross Duplicated Output (sector sales, deflated by the price index for the industry mix of goods and services produced) that the Bureau of Labor Statistics, Economic and Employment Projections System, generates for all 150 sectors of the economy.
the figures on Gross Product Originating (Net output or
Value added) that are produced by the Bureau of Economic Analysis as part of the National Income Accounts.
While the Gross Product Originating figures are more commonly used as a measure of output, they are not available for
detailed industries. Also, sales levels, rather than net output are likely to better reflect the demand for labor.
Tables 6.10, 6.11, and 6.12 compare the annual average trend rates of growth of output and employment for the 150 principal U.S. sectors from 1969 to 1984. Table 6.10 identifies those where both trends are positive. Table 6.11 groups those with a positive output trend, but no employment growth, while Table 6.12 has those with negative trends on both measures.
25
[image:38.595.47.530.155.648.2]Table 6.10 S e c t o r s w i t h P o s i t i v e Output and Employment T r e n d s , 1969-84
Table 4. Positive output trend and positive employment trend, average annual rate of change,1 1969-84
Industry Output EmpJoyiiMit Muttry Output
Agriculture: Food and teed grans Agricultural products, n.e.c Forestry and fishery products
Agricultural, lorestry, and fishery services . . .
Wrung: Coal mining
CiwracaJ ano 'erSizer minerai mining
Construction:
Maintenance and repar oonstnjcoori
Moncjraole occos manufacturing: Meat products
Canned and frozen foods Soft chnfcs and flavorings Food products, n.e.c Fabricated tense products, n.e.c. Paper products
Penocucal and boo« emsig, puotenro
PrffTbng and pubtsfwg, n.e.c
Industrial inorganic and organic dienecafa -Agricultural chemicals
Drugs
Cleaning and toilet preparatiorts Petroleum retiring and related products Piasses products, n.e.c
Durable goods manulactunng: Logging
vWwonr, pfywood, and wood products. ne.c Furniture and fixtures, except household . . . Primary aluminum and aluminum praxes . Fabricated structural metal products Fabricated metal products, n.e.c Construction, inning, and oilfield machinery Metahvortong machinery
General industrial machinery Nonelectrical macrenery, n.e.c Computers and peripheral equipment Typewriters and office equipment Service industry macunes FJectnc tratenvsson eouprnent Radio and rammunicandn equipment Sectronic components and accassotiea . .
Electrical machinery and suppeaa, n.e.c. . . .
1 Based on least squares trend ine.
ae.c » Not elsewhere classified.
2.4 1.7 0.3 1.7 2.8 1.6 0.6 1.4 3.0 3.8 3.3 2.5 21 24 27 21 1.3 25 32 32 1.4 22 S.O 27 1.6 4.9 4.5 11 3.5 1.5 02 20 1.5 0.8 1.4 3.0 16.3 5.6 i1 21 8.4 11.3 03 0.1 0.5 0.4 0.5 0.1 20 20 0.9 0.5 2.4 1.4 0.4 3.7 0.3 0.8 21 02 OS 0.9 0.7 0.4 0.2 24 5.8 0.2 0.8 1.0 1.9 *2 3.6
iXjraBie gcocs rnanuiactunng—Continued Aircraft
Ship and boat buiding and repair Motorcycles, bicycles, and parts Scientific and cortjoftmg instruments Medical and dental instruments and supplies .. Optical and ophthalmic equipment Photograph«: equpment and supplies
Transportalion and unities: Trucking and warehousng Air transportation Pipelines, except natural gas Transportation services Radio and television broadcasting
CommuncaTJon. except rade and television .. FJectnc unîmes, pupae and private Water and sanitary services
Trade: Wholesale trade Eating and dnrtong places Retail trade, except eatrg and ohnkmg
Finance, insurance, and real estate: Baniong
Credrt agences and financial brokers Insurance
Real estate
Services:
Hotels and cocnq places Personal and repa» services Business serviced Adverestig
Professional services, n.e.c Automooie repa» and services Motxxi pictures
Amusements and recreation services Doctors' and dentists' services Hospitals
Medical services, n.e.c EducatKmal services
Nui mm 11 neroa! and membership organizations
Government:
Local government passenger transit Stale and local enterprises, n.e.c General government 1.3 3.1 20 4.3 5.5 8.6 6.0 2.5 28 20 4.0 26 7.5 4.3 4.3 29 25 25 5.0 5.7 3.3 4.5 28 2.0 6.8 3.6 5.7 2.1 5.6 6.1 4.3 5J 5.4 32 4.0 4.5 1.8 \2 0.3 1.0 0.1 1.9 5.7 1.5 \2 1.7 14 1.4 6.1 4.1 1.3 2.9 1.8 25 5.0 1.7 3.8 4.5 24 3.6 3.9 1.0 7.0 3.0 5.6 *2 12 4.2 5.0 3.9 6.8 3.5 1.7 5.4 2.3 2Ό
26
T a b l e 6 . 1 1 ;
N e g a t i v e O u t p u t and
Employment T r e n d s , 1969-84
Table 6. Negative output trend and negative employment trend, average annual rate of change,1 1969-84
Industry
MninQz
iron and ferroalloy ores mning Copper ore mining
Stone and day mmng and quarryng Nondurable ocous manufacturing:
Sugar
Tobacco manufacturing Tires and liner tube·
Rubber products except brat and tube* Leather tanrxng and finishfig Learner prooucts inducing footwear Dur ade 90003 manufactumg;
Wooden containers Structural clay products Pottery and related products Blast furnaces and basic steel products
!ron and steel foundries and forgmgs Primary r a n f a ñ a s metafa and products, n.e.c Metal cans and oomanerj
Heating equpment and pkimbcig fixtures . . . . Motat stampngs
Materials handling equcment Special inoustry macnmery Railroad equement Transportation equipment, n.e.c
Watches, a e d o , ana one* operated aevce· . Housenoös:
Household naustry
'Based on least squares trend ine. f l * C » N o t
Output Employment
-32 -33 -1.7 -03 -02 -02 -1J -3.3 -2.7 -1.8 -4.1 -\2 -0.« -23 -13 -1.7 -0Λ -IJ -02 -0.8 -10 -5.1 -03 -1.7 -3.1 -4.1 -0.7 -23 -1.4 -1.5 -0.9 -19 -3.1 -S3 -3.6 -0.1 -33 -23 -02 -23 -03 - U -03 -0.6 -1.6 -15 -4.8
- 2 . 7
T a b l e 6 . 1 2 ;
P o s i t i v e O u t p u t and N e g a t i v e Employment T r e n d s , 1969-84
Table 5. Positive output trend and negative employment trend, average annual rate of change,1 1969-84
Industry
Agriculture:
Dairy and poultry products Meat animais and livestock Cotton
Nondurable goods manufacturing: Oairy products
Grain mil products Bakery products Confecodnery products Alcoholic beverages Fabric, yam. and thread m i s Floor covering rrrts Textile m i products, n.e.c Hosiery and lavt goods Apparel
Paperboard containers and boxes Chemical products, n.e.c. Plastic materials and synthetic rubber Synthetic fibers
Pains and allied products Durante goods manufacturing:
Sawmills and planing rmOs Household furniture Glass
Stone and oner mineral products, n.e.c Prnary cooper and cooper produca Screw machine products
Cutlery, handtools. and general hardware . . . Farm and garden machinery
Household appliances
E w . 1 « uqrting and wiring equipment Rado and television receiving equipment . . . Telephone and telegraph apparatus Motor verities
Museal instruments, toys, and sporting goods Manufactured products, n.e.c
Transportation ano unîmes: Railroad transportation Water transportation Government
U.S. Postal Senno· Federal enterprises, n.e.c 'Based on least squares trend ine. n.e.c - Not elsewhere classified.
Output 1.0 0.0 1.9 1.8 28 0.0 3.3 11 0.6 3.1 2.0 1.1 1.1 1-3 12 13 4.0 \2 03 1.9 0.6 1.6 αϊ 0.9 0.4 1.0 1.5 0.7 5.6 S3 0.9 3.0 02 0.7 19 14 3.3 -4.9 -19 -8.9 -19 -0.1 -1.6 -0.8 -1.4 -12 -1.1 -1.8 -1.7 -1.4 -1.1 -0.6 -1.4 -15 -03 -0.9 -03 -03 -0.3 -1.2 -0.6 -0.5 -0.6 -1.8 -0.1 -32 -03 -0.7 -0.6 -03 -3.0 -02 -03 -1.4.
[image:39.595.40.549.41.810.2]27
of values within the service sector group. Lastly, the various service sub-sectors exhibit a wide diversity in their incremental employment to output relationships. At one extreme, communications (except TV and radio), with a 7.4% p.a. compound rate of output growth only gave a 1.3% p.a. growth of employment, while at the other, eating and drinking establishments had a 2 for 1 relationship between rates of employment growth and output growth.
Tables 6.11 and 6.12 have between them only three service sub-sectors of which only one - domestic help - is numerically significant.
The divergencies of sales trends within a particular broad expenditure class is brought out by Table 6.13. This takes 50 service activities and looks at their sales performance relative to inflation over the period 1977-1982. It shows that within an 'industry', such as entertainment, trends varied as between on the one hand drive-ins and billiard establishments with negative growth and on the other recreation clubs which doubled their sales in 5 years. Similarly in the health field, medical labs and nursing facilities did well but receipts for dentists and optometrists were relatively stable. The table also suggests that it has been the business services that have had the rapid rates of growth. Indeed, only 2 of the 18 service sectors categorized as stable or declining in terms of real expenditure levels (auto rental and photo finishing) had a business content. All the rest were consumer services.
7. Tracing Changes at the Micro Level
7.1 An Overview of Employment Growth
Table 7.1, which is based on population census and establishment data, shows which activities within the service sector have played the biggest role in the growth in employment.
Of those that have been growing above the national average (23.4%), have contributed more than 0.25 M jobs over the period and are not exclusively serving business needs but also the ultimate consumer, four seem worth looking at in slightly more detail; health care, eating and drinking establishments, social services, and auto repair services. These are briefly examined in the next section before looking at whether the rapid increase in the number of households has had any marked effect on output and employment on industries such as construction and household fixtures and fittings.
7.2 Specific Service Sub-Sectors
Health Care
28
T a b l e 6 . 1 3 ; S e r v i c e S e c t o r S a l e s 1977-82 Ranked by R a t e of Growth
RECEIPT GROWTH IN SELEC SERVICE INDUSTRIES: 1977-1982
LaLm in mtimm%i
S T R O M GROWTH IKOUSTRUS
WJOErHTE EROWn, INOOSTRIES
H H H K I I & at■ u w » — Msamnm
C U M α atm** «mm
mousTRiES KUfiM n a WITH infuna»
rmømmm u t *
•
f t n i M r m i a n
immRiES fJuuKs τα KEEP PUCE win IN
W k » /»e? bMiMMfc U n J * M . U S. i w n « . υ TED
' r t c l l l l
1 2 2 ;
no η
26 1 109 3 9 10 2
2 Í Í S 1 1 19 t o 341 14 6 16 2 9
¡10 0 17 5 6.4 1.4 500 1 4 112 3.2 3 1 7.4 2.1 161 1 4 1 4 I I i l l
» 1 2.9 9 1 12 7.1 94 1 3 3.7 ■uno» 52 3.3 2 1 I I 0 9 02 0 2 0.1 0 1 0 3
(Kc ι ^ M l*e\ew
IV77..1'
204» I/O I I I 1S2 111 I27 I21 I I 9 HO Ι 0 Ι I04 ICI ΙΟΟ m 94 34 W » 36 M U IS ÍS 34 S3 63 JS n 69 54 52 SI 5I s;» 57 55 SI SI <9 •S 41 37% 14 32 32 30 29 26 24 -1 •21
[image:41.595.62.525.43.816.2]29
Table 7.1: Major Areas of Service Sector Employment Growth: 1973-84 In Absolute and Percentage Terms (000s)
Professional
Services 3633 (68.9) Health 2448 (67.3)
Education
Legal Services Social Services
Physicians & Dentists Nursing Facilities Hospitals
Medical Labs Outpatient Care 140 (14.3)
306 (122.9) 739 (134. )
638 (90.6) 501 (76.0) 942 (45.9) 367 (161.2)
Distribution 5290 (31.8) Wholesale 1260 (29.5) Durables 825 (33.6) Non-Durables 434 (23.6)
Retail 4030 (32.7) Food Stores 790 (42.6, Building
Materials & 139 (26.1) Garden Sup.
Eating & 2327 (76.2) Drinking
Misc. Retail 478 (30.8) Apparel & 354 (57.3) Accessories
Machinery 482 (52.3) Equipment
Paper & 59 (52.1) Paper Products
30
Business & 2452 (95.6)
Repair Services Business 2092 (108) Services Mise. Business 779 (85.9) Svcs. Personnel 578 (126.2) Supply Agencies
Computer Data 351 (193.9 Processing
Services to 252 (69.2) Buildings
Repair 360
Services (57.4) Auto Repair Services & Garages Misc. Repairs
261 (61.8)
99 (48.2)
Finance, Insurance 1674
and Real Estate Finance 999 Banking 516 (43.8) Credit Agencies 267 (64,0* Security, 151 (78.J Commodity Brokers
Insurance 374 Insurance 180 (16.8)
Carriers
Agents, Brokers 195 (62.5) Services
Real Estate 301
Combined (37.7) Real Estate 318 (41.4)
Transportation 556 (11.9)
& Public Utilities Transportation 171 (6.2) Communications 217 (18.4) Electric, Gas, 167 (22.9) Etc.
31
Substantial as these increases were there are two reasons to believe that even they somewhat understate the growth of medical related demand in the economy. First, the figures for physicians do not include the self-employed who make up some 25% of the total of doctors and specialists. Second, the figures only reflect medical personnel working in medical establishments; they don't include the various nurses, social workers, etc. employed in institutions such as scho^.s and prisons.
For the period up to the early 1980's it was U.S. health policy to encourage the expansion of the system of provision and to widen access to it. The primary cause of the system's rapid expansion was therefore its increased af fordabil i ty due a combination of broadened private insurance coverage and the extention of various public programs. Given that providers were re-imbursed on a cost of service basis, neither consumers nor providers needed to worry overly about the cost of the system.
A secondary cause of the expansion of the medical sector was the development and deployment of new technology. Whereas during the 195u's and 1960's increases in hospital "bed capacity' were the driving force behind the expansion in output and employment, during the 1970's and 8u's the focus switched to "service intensity'. By this is meant an increase in the quality and quantity of services provided per hospital admission. Hence while on the one hand changes in technology, preferences and after 1983 financing arrangements tended to favor outpatient care and restrictions on hospital admissions, on the other, greater service intensity meant that both those that were admitted and
those that weren't required the services of a larger number of professionals and para-professionals, especially in the diagnostic, laboratory and surgical areas. As a result, over the period 1972-84 employment in hospitals added 40% of all the new
health sector jobs.
Besides increasing the intensity of medical services the new technology also facilitated the decentralization of their delivery. Employment growth outside the hospital sector was even faster than within it as Table 7.2 shows. Jobs in physicians offices increased twice as fast as those in hospitals due to a number of factors. Besides the previously mentioned factors of widening insurance cover and the intensification of services there was a substantial increase in the supply of practitioners and a tendency for increasing numbers of doctors to eschew self-employment in favor of corporate status thereby becoming employees and entering into the health care statistics.
The even more rapid rf se in employment in nursing and personal care homes appear co have been a function of three forces. First, there was a major expansion of private and non-profit nursing home capacity during the early 1970's. Second, the