THESES SIS/LIBRARY TELEPHONE: +61 2 6125 4631 R.G. MENZIES LIBRARY BUILDING NO:2 FACSIMILE: +61 2 6125 4063
THE AUSTRALIAN NATIONAL UNIVERSITY EMAIL: [email protected] CANBERRA ACT 0200 AUSTRALIA
USE OF THESES
This copy is supplied for purposes
of private study and research only.
Passages from the thesis may not be
copied or closely paraphrased without the
CANBERRA
PERIPHERAL VISUAL FUNCTION IN THE FLY
ROGER CLAYTON HARDIE
A THESIS SUBMITTED FOR THE DEGREE OF
DOCTOR OF PHILOSOPHY OF THE
AUSTRALIAN NATIONAL UNIVERSITY
DECLARATION
Parts of Chapter I, namely the wavelength dependence of
angular sensitivity functions and some of the theoretical analysis, were performed in collaboration with Professors
G.A. Horridge and K. Mimura (Horridge, Mimura and Hardie,
1976). The work described in Chapter IV was performed in
collaboration with Dr. S.B. Laughlin, who performed similar experiments in dragonfly retina and lamina (Laughlin and Hardie, In press). The work described in Chapter V has been
submitted, essentially unchanged, to the Journal of Comparative Physiology as a joint paper: "Hardie, R.C., Franceschini, N., Mcintyre, P.: Electrophysiological analysis of the fly
retina II: spectral mechanisms in R7 and RB". Dr. N.
Franceschini collaborated with some of the experiments, and
in particular, conceived of the
'in vivo
recovery' technique for identifying stained cells (Appendix B) • The theoreticalanalysis described in the appendices of Chapter V was
performed by Dr. P. Mcintyre. Otherwise, I declare all the
original work presented in this thesis to be my own.
The following papers and abstracts have also been published, or accepted for.publication during the course
of this thesis:
Hardie, R.C.: Flight initiation in the fly,
LuaiZia.
Proc. Australian Physiol. Pharmacol. Soc. ~' 95P (1977a).
Hardie, R. C. : Elcctrophysiological proportios of R7 and RS in Dipteran retina. Z. Naturforsch. 32c,
887-889 (1977b).
Hardie, R.C.: Electrophysiological analysis of the fly retina I: comparative properties of Rl-6 and R7 and RS. J . comp. Physiol. (In press).
Hardie, R.C., Duelli, P.: Properties of single cells in posterior lateral eyes of jumping spiders.
z.
Naturforsch. 33c, 156-158. (1978).Hardie, R. C., Franceschini, N.: Intracellular staining
of photoreceptor cells as observed
in vivo.
The Association for Research in Vision and OphthalmologyACKNOWLEDGEMENTS
Special thanks must go to Dr. Simon Laughlin who
supervised me for most of my thesis, and also to Professor
G.A. Horridge, who initiated my supervision, for his consistent encouragement and infectious enthusiasm.
It is also a pleasure to acknowledge the inspiration
afforded by all those with whom I have worked over the course of this thesis. Apart from those specifically mentioned as co-authors on the previous pages,I also acknowledge the fruits of discussion with Drs. Doekele
Stavenga, Martin Wilson, David Blest, Steve Shaw, Willi Ribi and Yasuo Tsukahara who also taught me the art of
electrophysiology.
Thanks are also due to those whose technical expertise proved invaluable, including Bruce Ham who caught and bred the flies; Kevin Downing who miraculously fixed any faulty
equipment; Sandy Smith who prepared most of the illustrations; and finally, but by no means least, Josephine Anderson who typed the manuscript.
TABLE OF CONTENTS
ABSTRACT
GENERAL INTRODUCTION
CHAPTER I
CHAPTER
IIAngular sensitivity of photoreceptors Summary Introduction Methods Theory Results Discussion
Functional comparison of Rl-6, R7 and R8 Summary
Introduction Methods
Results Discussion
CHAPTER
III A new functional class of photoreceptorCHAPTER IV
CHAPTER V
Light-adaptation in the retina and lamina
Summary
Introduction
Methods Results
Discussion
Spectral mechanisms in R7 and R8 Summary
Introduction Methods
Results Discussion
Appendix I
Appendix II
Appendix III
99
.101
103 107
121
136
138 140 141 151 167
174 176
GENERAL APPENDICES
Appendix A: General Methods .. 183
Appendix B: Identification of cells 194
ABSTRACT
Receptors and peripheral neurons of the dipteran visual system have been studied in the flies,
CaZZiphora stygia
(wild type),
Musca domestica
(white-eyed mutant) andCaZZiphora erythrocephaZa
(chalky mutant), principally bymeans of intracellular recording. Recordings were made from: the large peripheral retinula cells, Rl-6; the small, central, retinula cells, R7 and RS; and the large monopolar cells
(LMC' s)' Ll, L2 and L4. Representatives of each cell type were identified by intracellular dye injection with Procion yellow.
The angular sensitivity functions of the receptors are shown to be at, or near the limit set by lens diffraction and
rhabdomere diameter. Receptors R7 and RS, whose rhabdomeres
are narrower than those of Rl-6,also have narrower angular sensitivity functions.
Many of the basic response properties of photoreceptors are described in detail for the first time. For R7 and RS,
spectral sensitivities, polarisation sensitivities, absolute sensitivities, and dark and light-adapted intensity/response
functions have been determined. In Rl-6 cells, light-adaptation shifts the peak of spectral sensitivity, and
narrows the angular sensitivity function, but had no effect upon the polarisation sensitivity. These new results from
identified receptors lead to a reappraisal of receptor involvement in optomotor behaviour.
A new functional class of photoreceptor (Rl-6) is described in which the spectral and polarisation sensitivity are both dependent upon the intensity of the test flash.used to
measure them. In addition, the polarisation sensitivity is
strongly dependent upon the stimulus wavelength. The
experimental analysis suggests that these anomalous properties
derive from the events occurring in a single cell, and this finding may have important implications with respect to the
process of transduction in photoreceptors.
A detailed study is made of the processes of light-adaptation
2
in receptors Rl-6 and their postsynaptic elements, the LMC's. Consecutive stages of light-adaptation are isolated by comparing
the performance of receptors and LMC's when subjected to identical regimes of dark- and light-adaptation over a 5 log
unit range of intensities, and possible mechanisms of light-adaptation are considered. A comparison with the performance
of higher order visual interneurons indicates that the majority of adaptation is completed at the level of the LMC. A
comparison of the results with those of similar studies in other arthropods and, also the lower vertebrates reveals
striking analogies, which, i t is argued, represent an optimal strategy for light-adaptation.
The receptors R7 and RB are intensively investigated to
rhabdomeres. The properties of RB are profoundly influenced
by the absorption of light. i~ the overlying rhabdomere of R7.
GENERAL INTRODUCTION
The faculty of seeing is the most striking of all our
senses, and i t is probably the amazing richness of visual
perception, more than any other factor, which has fascinated so many scientists, and attracted them to the task of
unravelling the mysteries of visual processing.
The reason why vision is such a striking modality is that, for man at least, this sensory channel can transmit
more information than any other sense. In the object world, this information is contained in modulations of intensity as a function of: space, time, wavelength and the E-vector direction of polarised light. The job of the visual system
is to process this vast amount of information and, so extract the features of biological importance to the animal concerned, whilst the task of the scientist is to work out how this is achieved.
Because of the complexity of the systems confronting
him, the vision researcher may increase the odds in his favour
by· selecting a preparation (and techniques) most suitable for the particular problem with which he is concerned.
Thus, those interested in the biophysics of transduction
have often chosen preparations, such as the barnacle or LimuZus
(review: Meech and Brown, 1976}, which have comparatively huge photoreceptor cells that may be simultaneously penetrated with at least two microelectrodes, and may be readily perfused with
experimental solutions.
Many of those interested in the operation of the peripheral visual system have recorded from eyecup
preparations of lower vertebrates, such as Necturus
(Werblin, 1973), skate (Green et al., 1975) or tiger salamander (Werblin, 1978). The advantage of these
preparations is that all the major cell classes may be relatively easily impaled (including receptor, bipolar,
amacrine, horizontal and ganglion cells) thus allowing analysis of function at all levels.
The cortical areas, of cats and monkeys in particular, have been extensively studied by those interested in complex information processing at higher levels (reviews: Henry, 1977; Hubel and Wiesel, 1977}. This choice however has
been prompted, more by a desire to come as close as possible
to the human situation, than for the experimental amenability of the preparation itself.
If one is interested in all aspects of visual processing, and how these combine to produce visually mediated behaviour,
then one is tackling a very large problem, that encompasses all aspects of peripheral and central nervous function.
In this case the preparation chosen must be amenable to
study at every level in the nervous system, with as many techniques as possible.
In many respects the fly can be considered such a preparation (reviews: Reichardt, 1969; Kirschfeld, l972;
Hausen, 1977). In general the choice of an insect is
favourable since there are perhaps 103 x less visual
interneurons than in man or the higher vertebrates
(Kirschfeld, 1976). This im~ediately reduces the complexity
of the task enormously, but not at the expense of making the study irrelevant to proponents of vertebrate and, in
particular, human, visual processing. It is quite clear that insects are capable of many complex visual feats. Thus
sophisticated and accurate motion detection abilities are
shown by many flying insects including flies (Collett and Land, 1975), pattern recognition (review: Wehner, 1975) and colour vision (v.Helversen, 1972) are well established in bees, and evidence has re~ently been given for the latter
faculty in flies (Menne and Spatz, 1977). Contrast detection and light-adaptation are also common features of both insect and vertebrate visual systems. Where parallel studies have been performed in insects and vertebrates, the basic physiology
underlying the visual processes is seen to be remarkably similar (Laughlin, 1976b) - and a particular example of this is discussed in Chapter IV with respect to light~adaptation.
Unlike the situation in vertebrates, however, where the visual
signal is effectively lost to the physiologist in the visual cortex, and does not reappear until the behavioural output,
there is the potential in insects to describe visual behaviour in terms of neural correlates at every level from the
photoreceptor to the muscle.
What then, are the special features of the fly that
make i t one of the most widely used insect visual preparations?
a) Anatomy
Firstly, as in many insects, the anatomical layout of the fly's optic lobes is beautifully ordered. A point to point
projection of the visual world is maintained through the lamina, medulla, lobula plate and lobula (Strausfeld, 1976a; 1976b). Extensive anatomical studies using electron
microscopy (EM) and Golgi techniques have mapped out the fly
retina and optic lobes in great detail (Cajal and Sanchez, 1915; Boschek, 1971; Strausfeld, 1976b) and there is now a
firm basis to give an anatomical correlate for practically any neuron in the fly visual system. Many of the cell types, particularly those of the retina and lamina have virtually identical geometry repeated right across the lobe (Strausfeld,
1976a), and thus, with caution, physiological results from only a few cells of one type, can be used to generalise about
that cell type in each of the many thousands of retinotopic columns.
b) Electrophysiology
Physiologically the fly's visual system may be sampled at many levels, including the receptors (Burkhardt, 1962);
lamina (Zettler and Jarvilehto, 1971; Arnett, 1972); medulla (Bishop et al., 1968; Mimura, 1971; oeVoe and Ockleford, 1976),
lobula plate (Dvorak, et al., 1975; Hausen, 1976) and ventral
nerve chord (Hardie, 1977a). At some of these levels i t is
possible to maintain stable intracellular recordings, however,
i t must be confessed, that at_ present there are s t i l l many
small neurons (e.g. in the lamina and medulla) that are at,
or beyond, the limits of present intracellular recording techniques.
a)
Behaviour
A physiological study of a nervous system is incomplete without behavioural correlates. It is, after all, visual
behaviour we are trying to explain in terms of the units of the visual system. Fortunately, the fly ~as a number of
behavioural responses that may be studied quantitatively. The most important of these has been the optomotor turning reaction (Fermi and Reichardt, 1963; review: Reichardt, 1969) which has been used to assess the output of the visual system
with respect to all the major visual parameters (spatial, spectral, intensity, polarisation etc.). Other behavioural
responses that have proved useful, include: phototaxis (with which conditioning experiments may be performed - Menne and
Spatz, 1977); optomotor thrust and roll responses (Getz, 1968; Srinivasan, 1977); pattern induced flight orientation (review:
Reichardt and Poggio, 1976) and landing behaviour (review: Taddei-Feretti and Talens, 1975).
d)
OpticsThe optical qualities of the fly's eye have also proved rather useful in the analysis of visual function in the fly. The fly, has rather an unusual optical system and accompanying anatomical projection, first described by Kirschfeld (1967}
and Braitenberg (1967) and 'christened' the neural
superposition eye. In most insects, with apposition eyes,
the photoreceptors of a singl~ ommatidium form a common fused rhabdom, and thus all have identical visual axes.
In the fly however, each ommatidium contains seven separate rhabdomeres with divergent visual axes. Six of the rhabdomeres
are derived from single photoreceptors (Rl-6), and these surround a narrower central, tiered rhabdom formed from two
photoreceptors (R7 and RS) . The projection of the visual axes may be judged from the pattern of the rhabdomere tips which
are seen to conform to a strict geometric arrangement that is
repeated over all the eye (except that the patterns in the dorsal and ventral halves of the eye are mirror images of each other). The divergence angles of adjacent rhabdomeres'
visual axes are more or less identical to the angles between specific adjacent ommatidia. As a result, any point in space is simultaneously monitored by a single rhabdomere in each of
seven separate ommatidia. Further, the geometric arrangement
of these seven ommatidia is the same as that of the rhabdomere
tips in one ommatidium.
The axons of rhabdomeres having the same field of view leave their individual ommatidia beneath the basement membrane and come together in the same cartridge in the lamina. Six
of these (from receptors Rl-6) synapse on the same second order cells (the large monopolar cells (LMC's), Ll and L2) in the lamina (Braitenberg, 1967), whilst the remaining two, which
derive from the common, tiered central rhabdom R7/8, pass
This projection, initially worked out optically (Kirschfeld, 1967) and anatomically (Braitenberg, 1967), has been confirmed electrophysiologically by Scholes (1969)
who recorded depolarising responses in the lamina, whilst stimulating single facets, and found that the facets
contributing to the re~ponse conformed to the predicted geometric pattern.
The characteristic pattern of rhabdomere tips can also
be seen in the phenomenon of the deep-pseudopupil
(Franceschini and Kirschfeld, 197lb). By focussing a low
power objective at the level of the centre of curvature of the eye the images of rhabdomeres in a number of adjacent
ommatidia are superimposed, and an intensified and magnified image of the pattern of rhabdomere endings within a single ommatidium is obtained.
The unique optical qualities of the fly's eye have had
several applications in the study of the fly's visual system.
1. Individual, identified rhabdomeres may be stimulated by illuminating the eye via a system of apertures. One aperture is imaged at the centre of the eye, and is placed so as to restrict stimulation to one rhabdomere type of the
deep-pseudopupil pattern. Another aperture is then imaged at the cornea and restricts stimulation to one facet. The result is
that only one, identified rhabdomere in a single ommatidium is stimulated. This technique has been used to elicit
behavioural optomotor responses to sequential stimulation of only two rhabdomeres in the same ommatidium (Kirschfeld, 1972;
Kirschfeld and Lutz, 1974), and also to demonstrate that
the activation of the longitudinal pupil mechanism (Kirschfeld
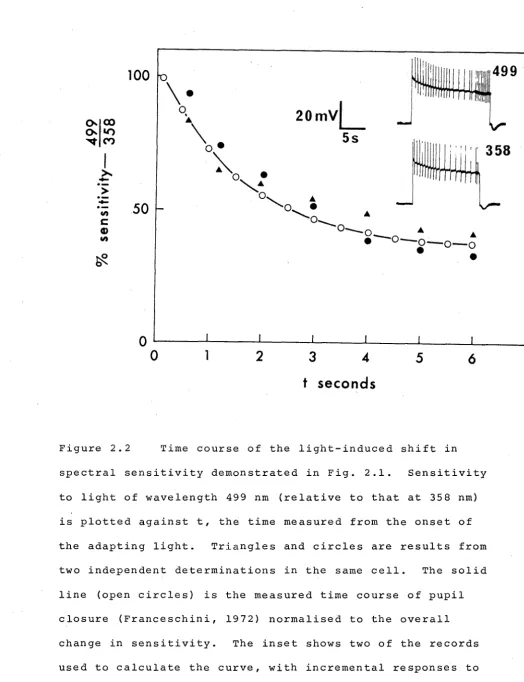
and Franceschini, 1969) is a function of individual retinula ce 11 s (Franceschini, 19 7 2) •
2. Because of the rigid geometrical demands of a neural superposition eye, various optical parameters, such as
receptor spacing and focal lengths must be related by simple
formulae (Stavenga, 1975). This enables focal lengths, for example, to be calculated without reference to thick lens formulae.
3. In general, because the optics have been so well studied,
the fly's eye is an ideal preparation in which to analyse questions about the optimisation of optical design (Snyder
et aZ., 1977) and the physical basis of resolution (Kuiper,
1966; Horridge et aZ., 1976; and see Chapter I).
4. Microspectrophotometry (MSP) of the visual pigments can
be more readily applied in fly than in insects with fused
rhabdoms, since in flies, the open rhabdomere situation allows
one to readily examine single cells in isolation (Langer and Thorell, 1966; Kirschfeld et aZ., 1977). This analysis can
even be performed,
in vivo,
using the phenomenon of the deep-pseudopupil, on the assumption that cells of the sameanatomical class have similar pigments (Stavenga et aZ., 1973; Stavenga, 1976). In Chapter
v,
measurements of the spectralproperties of cells R7 and RB are considered in light of recent MSP data (Kirschfeld et aZ., 1978) and theories
5. Under conditions of optical neutralization of the cornea
{which may be achieved by use of a water immersion objective)
individual rhabdomere tips may be recognised by focussing down through the lenses which now act effectively as clear windows
{Franceschini and Kirschfeld, 197la). This technique has found a special application in the
•in vivo
recovery' of dye injected retinula cells (see Appendix B and Chapter V).e)
Genetics
A further bonus has come from a novel source, namely
genetics. As well as being an important visual preparation, dipterans
(Drosophila
in particular) are also widely used in genetics, and a most fruitful merger between the two fields has occurred with the exploitation of visually deficientDrosophila
mutants. These include transduction mutants{Pak
et al.,
1976; Minke, 1977), and behavioural mutants (Heisenberg and Gatz, 1975), but to date, the most usefulhave been those lacking specific receptor types (Benzer, 1967). These have been exploited to investigate the relative roles of
receptor types in behaviour (Heisenberg and Buchner, 1977; Hu·and Stark, 1977) and also to analyse the spectral
12
properties of the different cell classes (Harris
et al.,
1976). As discussed in Chapter V, however, the latter approachnecessarily misses some important aspects of spectral mechanisms
in the central retinula cells, R7 and H8. In general, though,
since the genetic lesion acts at a level that is inaccessible to the surgeon's knife i t has a unique potential in the analysis
The problem of analysing a nervous system may be broken down to the problem of analy~ing the transfer characteristics at successive stages in the system. To analyse the transfer
characteristics at any one level, one measures the output
13
(a unit's response) whilst controlling the input, i.e. the
activity of presynaptic elements, or, in the case of receptors, the physical stimulus. For higher order interneurons there
must be considerable uncertainty as to the activity of the input, and for precise information one must work from the
periphery inwards. Thus at the receptor level, the input
(physical stimulus) may be accurately controlled to the limits
of calibration, and shot noise, and the output may be accurately analysed from the amplitudes of the graded potentials. Having
determined how the visual stimulus is transferred through the receptor's spectral and polarisation sensitivities, intensity/
response function and spatial and temporal frequency responses, one can then address oneself to the problems of analysing
transfer at successive synaptic levels. In general terms a firm knowledge of receptor properties must be considered a
basic requisite for interpreting data from other levels in the visual system. The change from the language of the physical
world to that of the receptors represents one of the most
drastic of all the transfer functions, and information retained
by the receptors represents all the information available to the whole visual system.
Although the receptors in the fly had been studied by
therefore, the receptors in particular, and also their
immediate postsynaptic elements, the large monopolar cells, were made the subject of this study.
Two basic sorts of question may be asked at this level, and both have been considered in the present study. The
first concerns the fundamental basis of a unit's properties in terms, e.g. of pigments, optics, transduction, membrane events and synaptic phenomena. The second concerns the roles
of the units studied in the visual system as a whole.
14
Because of the detailed information available about optics
(Kirschfeld, 1972; Stavenga, 1975) and photopigments (Hamdorf
et aZ., 1973; Kirschfeld et aZ., 1977; 1978), the fly is an
excellent preparation in which to determine the influence of these factors upon the receptor's properties. Two particular questions, the origin of the angular sensitivity function, and the origin of the spectral properties of R7 and R8 are
considered in Chapters ~ and V respectively.
In general, the photoreceptors of the fly cannot be considered a good preparation for analysing transduction and membrane phenomena in comparison for example, to
LimuZus
and the barnacle. However, the dis~overy of a class ofreceptors with some unusual properties, that might reflect some features of the transduction mechanism, prompted a
The second class of question (the
roles
of receptorsand interneurons in vision) , _however, provided the initial motivation for this study. One specific question considered
was: what are the relative roles of the different receptors 15
in visual behaviour? At the start of this thesis, information
on this appeared contradictory. The studies of Eckert (1971) and Mccann and Arnett (1972) led to the conclusion that
receptors R7 and R8 dominated optomotor behaviour at high
light intensities, when patterns of high spatial frequency were
used to stimulate the animal. Their results suggested that the receptors R7 and R8 had a single blue-peaked spectral
sensitivity, and a degree of polarisation sensitivity. In
support of this, the spectral sensitivity correlated quite well
with the absorption spectrum measured in the rhabdomere of R7/8 by Langer and Thorell (1966), however, direct data on
R7 and R8's properties, from a few intracellular recordings, suggested there was no polarisation sensitivity, and that R7, at least, was an ultraviolet receptor (Jarvilehto and Moring, 1974; Smola and Meffert, 1975). Other data, from
Drosophila,
e.r.g's,
did, however, indicate that R8 was a blue receptor,(Harris
et al.,
1976) and thus perhaps the behavioural studieswere right after all. Obviously what was needed, before
detailed speculation could be made about receptor involvement
in behaviour, was a detailed study of the properties of the receptors themselves, recorded directly using intracellular
micro-pipettes. Such a study is described in Chapter II. of the conclusions reached in that study were also reached,
quite independently, from a behavioural study in
Drosophila
mutants (Heisenberg and Buchner, 1977).
The second major question about the role of specific
elements in behaviour, concer~ed the limiting roles played by LMC's and photoreceptors in light-adaptation. This was
investigated by examining the responses of both cell classes to identical regimes of dark and light-adaptation, thus
isolating consecutive stages of adaptation, and then comparing
these to behavioural or higher order correlates. This study also highlighted some questions regarding the mechanisms and the functional significance of light-adaptation, and all these
topics are considered together in Chapter IV.
To gain the maximum useful information from the sort of electrophysiological analysis presented in this thesis, i t is essential to be able to identify one's recordings with an
anatomical cell type. Ideally every recording should be followed by intracellular dye injection and subsequent
histological recovery. However, in achieving this ideal one
severely restricts the number of cells from which data can be collected, and therefore a compromise was reached. In
this study, examples of every physiological class encountered were stained with fluorescent dyes on several occasions (see Appendix B). Because of the consistency of the results, and the lack of overlap between physiological classes, i t was subsequently decided that physiological criteria alone, were sufficient to attribute anatomical identity to any recording.
CHAPTER I
17
SUMMARY
1. Angular sensitivity functions of individual
retinula cells were determined from intracellular recordings
of photoreceptors identified as Rl-6, R7 and R8 in the flies
CaZZiphora stygia (wild type) and Musca domestiaa (white).
2. Values for ~p (the width of the angular sensitivity function at the 50% level) are given: a) for receptors in
different eye regions (Fig. 1.4); b) for receptors with
different rhabdomere diameters (Table 1.4); and c) in the same cell, using different wavelengths of monochromatic
light (Fig. 1.6).
3. The results are compared with the predictions of a simple theory (Kuiper, 1966; Horridge et aZ., 1976; Snyder,
1977) which assumes that the angular sensitivity function may be generated by convolving a function representing the Airy disc with the rhabdomere acceptance function. Two approximations for the rhabdomere acceptance function were
tested, a circular step function (top hat profile) and a Gaussian function (after Snyder, 1977).
4. The comparison reveals, that in general terms, fly photoreceptors have ~p values at, or about the lower limit
set by the combined physical constraints of diffraction and rhabdomere diameter (Table 1.6). The circular step function
5. Whilst the influence of rhabdomere diameter in
determining ~p was clearly established, the influence of the Airy disc could not be detected, and therefore the
exact physical basis of image formation in compound eyes is s t i l l open to question.
6. Angular sensitivities were also determined under
conditions of light-adaptation (Fig. 1.7 and Table 1.5).
A consistent reduction of ~p, compared to that measured in the dark, was observed, and possible mechanisms for this
phenomenon are discussed.
INTRODUCTION
Without spatial information, visual perception would be reduced to an overall impression of ambient intensity
and colour. A primary function of the visual system,
therefore, must be to extract as much information as possible
from the spatial contrasts in the real world. Therefore, a description of the performance of the eye in terms of
resolution and acuity is an essential part of a description of the whole visual system. In this respect the performance
of the receptors must be considered limiting, as any information that is lost between the real world and the receptor's response cannot be regained at a later stage.
It has long been recognised that two factors are important in determining the ability of an eye to detect
high spatial frequencies{e.g.Barlow, 1952; Snyder
et aZ.,
1977). Firstly there is the inter~receptor spacing, or {in compoundeyes) the interommatidial angle. Thus for two points to be distinguished as such there must be a receptor to detect each point, and one in between to monitor their separation. For a hexagonal lattice, simple geometry tells us that the
finest pattern that may be sampled by the receptor array has a period of /3~¢, {where ~¢ is the interommatidial angle)
{Snyder, 1977). ~¢ has been measured in flies previously, (Burkardt
et aZ.,
1966; Beersmaet aZ.,
1975) and is notconsidered further here. The second factor, a description of which is the subject of this chapter, is the angular
sensitivity function. This factor, which may be characterised by the- acceptance angle ~p (the width of the angular
20
sensitivity function at half height), determines the ability
-of the receptors to resolve contrasts. In practice, virtually
no contrast can be resolved from a pattern that has a period
of less than /::,.p (e.g. Snyder, 1977).
The angular sensitivity of fly photoreceptors has also been studied by several authors previously (e.g. Washizu
et al.,
1964; Scholes, 1969; Streck, 1972; Horridgeet aZ.,
1976) however, an accurate description of this parameter, and
how i t varies with eye region and the state of adaptation is s t i l l not available. Also, some of the early data on this
topic may be inaccurate owing to damage caused to the optics by the, sometimes, gross surgery employed. The only study
/
comparing angular sensitivity in different regions of the fly's eye (Washizu
et ai.,
1964) sampled only two general regions. The only previous study investigating the effect of light-adaptation (Vowles, 1966) described receptive fieldsof Musca photoreceptors in terms of responses only (sensitivity
was not calculated), and the wide fields and small responses
reported, in the light of more recent data (e.g. Scholes, 1969), are indicative of a damaged preparation. A definitive
comparison of angular sensitivities in the two receptor
subclasses (Rl-6 and R7/8) has not previously been presented
from identified photoreceptors. One aim of this chapter, therefore, has been to provide reliable data on angular
sensitivity in different receptors, in different eye regions, and in different states of adaptation, since this information
chapter. Secondly, there are several theoretical accounts for the origin of the angular sensitivity function (e.g. Kuiper,
1966; Pask and Snyder, 1975; Horridge et aZ., 1976; Snyder, 1977; In press), and in this chapter, the applicability of such theories is tested by making a comparison between theoretical and experimentally derived acceptance angles.
22
METHODS
The majority of experiments were performed upon
CaZZiphora
stygia
(wild type), but a few experiments were also performedupon pupilless white-eyed mutants of
Musca domestiaa
(white). Females, only were used. General details of the preparation recording and stimulating apparatus are found in Appendix A,but the following points are of particular relevance to the present series of experiments.
All angular sensitivity measurements were made using a small source subtending 0.4° at the fly's eye. For
light-adapted determinations, a second, adapting beam was delivered through a separate light-guide (Dual beam method, Appendix A) . This light guide was also mounted on the Cardan arm, but
light from i t was back-reflected (by means of a front surface
mirror) onto a diffuse reflecting screen (20° in visual
angle) which had the test spot situated at its centre. During
a light-adapted angular sensitivity determination, both centre and surround were moved, however the movement required for
the determination was only ca.3-5°, and this was found to cause virtually no modulation in response to the surround (Fig. 1. 7). Sensitivities were calculated from the peak response amplitudes, by referring them to the appropriate dark or light-adapted V/log I curve determined in the same
cell. For horizontal angular sensitivity determinations, angles were corrected for the vertical elevation (Burkhardt
The history of angular sensitivity measurements indicates that great care must be take~ in preparing the animal to avoid spurious results caused by damage to the optics. To ensure
the best results, surgery was minimal, consisting of a
small hole (less than 5 facets in diameter) carefully cut in the dorsal cornea. The optics were checked after each experiment by examining the deep pseudopupil pattern
(Franceschini and Kirschfeld, 197lb) which was normal in
appearance except in the immediate vicinity of the hole. In addition, measurements were only made from cells some distance
(at least 10 ommatidia) from the hole.
The criteria used for identification of different cell classes are explained in Appendix B.
THEORY
The angular sensitivity ~unction describes the amount of light effectively absorbed by a photoreceptor as a function
of the angular position of a point source. Theories accounting for the generation of this function have been
considered by several authors including Kuiper (1966) Horridge
et aZ., (1976) and Snyder (1977), and are reviewed briefly
here.
The basic concept underlying these theories is that the
point source generates an image at the level of the rhabdomere tips, and that this sweeps across the rhabdomere's cross
section as the point source is moved (Fig. 1.1). The light
absorbed by the rhabdomere is then predicted by convolving a function describing the intensity distribution in the image of the point source, with the rhabdomere acceptance function, which describes the proportion of incident light captured by the rhabdomere as a function of position on its cross-section. Intuitively, this sort of theory is applicable to single lens
eyes, where all the receptors must be served by the same lens, but in many insects, with fused rhabdom, apposition eyes (e.g. locusts and mantids), i t is possible that the dioptrics act as a light funnel, and i t may be incorrect to
think of an image moving across the rhabdomere tips. In the case of the fly, though, because the rhabdomeres are separate,
and because of the neural superposition design (Kirschfeld, 1967), one can in fact be confident that an image of a point
source can physically move across the rhabdomere tips.
1 0
-I -I
I I I I I I I I I I
I 1
I I I
,
... ,_,,/_,-,
I 1 I I I I I 1 I f /-\ I I I I I I I I I t"',j I I I I I I I I I I ....--, (I
'
....__
,
PNP
R
Figure 1.1 The origin of the angular sensitivity function.
Rays are focussed through a lens of diameter, D, upon the end of a rhabdomere (R) of diameter, d. As the distant
point source is moved in front of the lens, the Airy disc sweeps across the rhabdomere tip, thus generating the
angular sensitivity curve. Because the focal length, f, is measured from the posterior nodal point, (PNP) the
refractive index of the medium does not enter into the
100
30
Rl-6
frontal>
:'!::"'po
~
50
ucu
r---""<;:-.,.,__~-t-.·- - - - 1. 46VI - - - 1.5
r---~
... - -
1.55!---~~~ -1.6
1--~~~~~~~~~~~~~~ ... ~k-1.66
0.5°
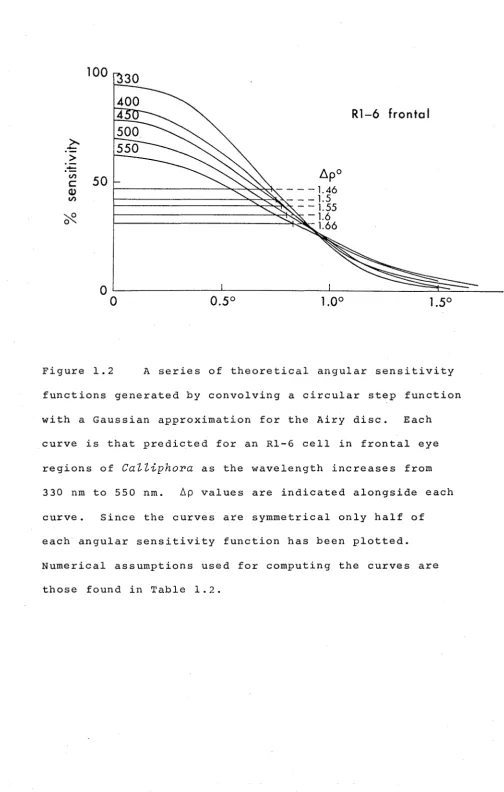
1,00 1.50Figure 1.2 A series of theoretical angular sensitivity functions generated by convolving a circular step function
with a Gaussian approximation for the Airy disc. Each curve is that predicted for an Rl-6 cell in frontal eye
regions of
CaZZiphora
as the wavelength increases from 330 nm to 550 nm. 6p values are indicated alongside each [image:34.597.65.569.46.838.2]25
In a diffraction limited lens system, a point source
generates a blurred image known as the Airy disc. The intensity distribution across the disc can be approximated
very well by a Gausian function with angular width 1 , at half height, of:
Aa = A/D radians ••..••.. (1.1)
where
A
=
the wavelengh 0£ light in vacuo, and D = diameter of the lens aperture,· (i.e. the facet diameter in the present situation).If the rhabdomere accepts all the light that impinges
upon its cross section, then the rhabdomere's acceptance function can be considered as a simple step function, which
shall be assumed to be circular in section ('top hat' profile) and of width equal to the rhabdomere diameter. Unfortunately, the convolution of a Gaussian and such a circular function has no analytical solution, and to generate theoretical angular sensitivity functions on this model, reference was made to tables of the "offset circle probabilities for the
circular normal distribution" (also known as the circular coverage function) (Owen, 1962). Theoretical functions were plotted for all the experimental situations, and Ap values measured from these plots, some examples of which are shown
in Figure 1.2.
•
All angles inside the eye (such as Aa) are measured from the posterior nodal point as then these are comparable
Snyder (1977} suggests a simpler alternative to this
somewhat te~ious method of gen~rating ~p values. The
rhabdomere acceptance function is also assumed to be Gaussian,
with a width at half height equal to the rhabdomere diameter. This approximation was chosen for its convenience, since the convolution of two Gaussian functions has a simple analytical solution, and in terms of angular widths at half height,
~p2 = (d/f) 2 + ~a,2 . . • . . . (1.2)
where d
=
the rhabdomere diameter, f=
the focal length (fromthe posterior nodal point) - and therefore d/f represents the angular width of the rhabdomere in radians. For very narrow
rhabdomeres, where waveguide effects become important a
a derivative of d should be used. This is given by Snyder (In press) as:
d' = 0.47 d exp l/V • • • . • • • • (1. 3)
where V
=
the waveguide parameter, which 'is inverselyproportional to wavelength1• According to Snyder (In press)
this derivative should be used when V < 2.0, which is probably the case for rhabdomeres R7/8 at wavelengths longer than 500nm
{Kirschfeld and Snyder, 1975).
l The waveguide parameter is given by:
V = 2 TI d
/n
21
n 2
2 . . . • . . (1.4)
where n and n are the refractive indices of the
l 2
rhabdomere and its surrounding, respectively.
To. generate theoretical angular sensitivities with either
of the above formulations a knowledg~ of the following parameters is required:
f the focal length
d the rhabdomere diameter
D the facet diameter
V the waveguide parameter.
With the exception of d and V in
CaZZiphora,
values of all these parameters, in bothMusca
andCaZZiphora,
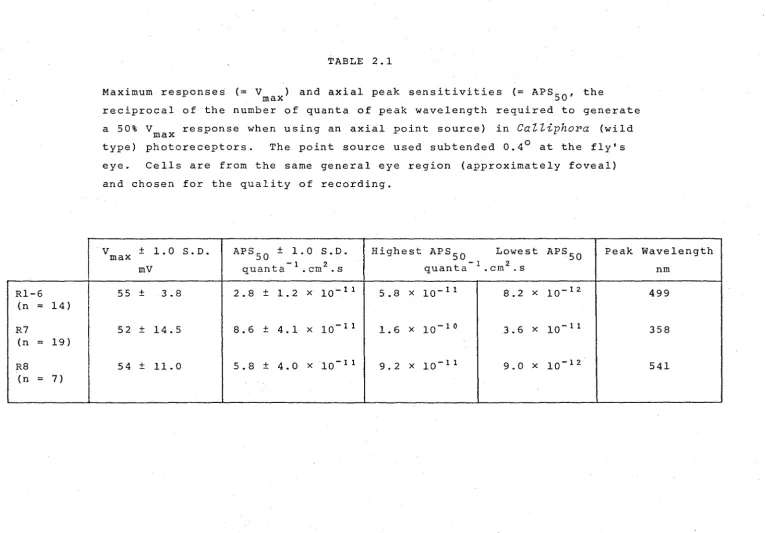
havebeen measured or estimated previously, and the numerical assumptions used in the calculation of 6p values are listed in Table 1.2, along with the source of the data. Rhabdomere diameter (d) in
CaZZiphora stygia
was measured directly fromcross sections of eyes. Since the rhabdomeres taper along their length, these measurements were made at the distal ends
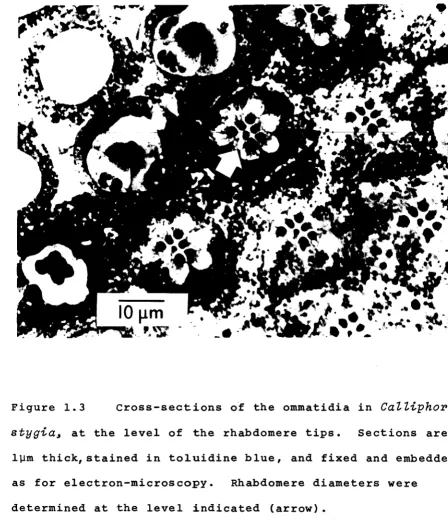
of the rhabdomeres, just below the rhabdomere caps - as indicated in Figure 1.3. Estimates of diameters from both light and electronmicroscopy (EM) are listed in Table 1.1. V, in
CaZZiphora
was assumed to be the same as inMusca.
In the results that follow 6p values of Rl-6 cells in
different eye regions and using different wavelengths are described, and a comparison made between 6p values of Rl-6
and R7/8 in frontal eye regions. As a test of the usefulness and/or validity of the simple theory described, these
experimental results are compared with theoretical values
generated by both the above formulations. Finally an account
of the effect of light-adaptation upon angular sensitivity is presented.
I
l
Figure 1.3 Cross-sections of the ommatidia in
CaZZiphoPa
stygia,
at the level of the rhabdomere tips. Sections arelµm thick, stained in toluidine blue, and fixed and embedded
as for electron-microscopy. Rhabdomere diameters were
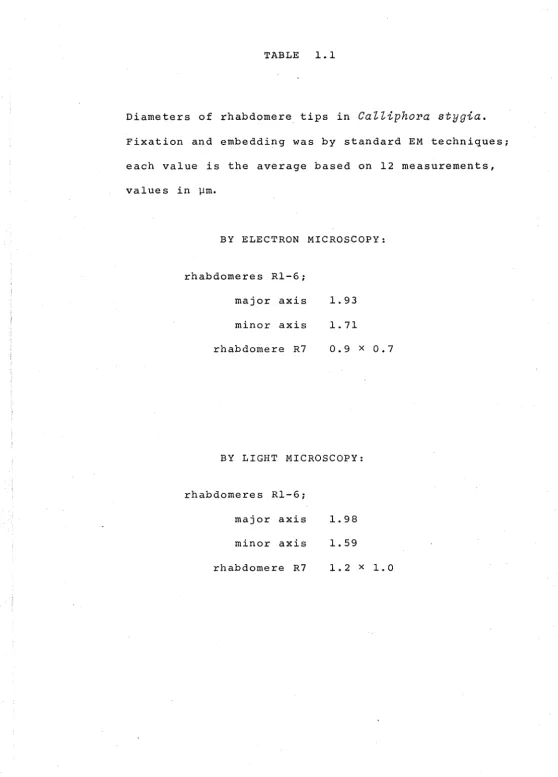
[image:38.597.126.575.171.699.2]TABLE 1.1
Diameters of rhabdomere tips in
CaZZiphora stygia.
Fixation and embedding was by standard EM techniques; each value is the average based on 12 measurements, values in µm.
BY ELECTRON MICROSCOPY:
rhabdomeres Rl-6; major axis
minor axis rhabdomere R7
1. 93
1. 71
0.9 x 0.7
BY LIGHT MICROSCOPY:
rhabdomeres Rl-6; major axis minor axis
rhabdomere R7
1. 98
1. 59
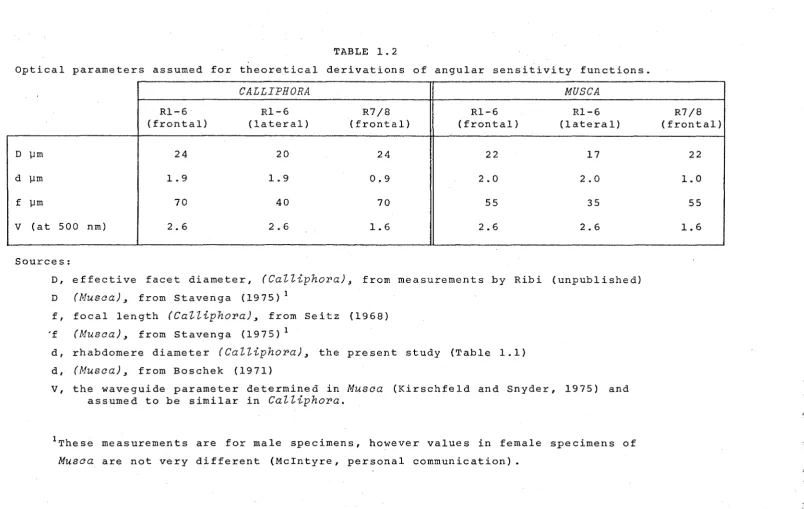
[image:39.600.16.575.47.825.2]TABLE 1.2
Optical parameters assumed for theoretical derivations of angular sensitivity functions.
CALLIPHORA
MUSCA
Rl-6 Rl-6 R7/8 Rl-6 Rl-6
(frontal) (lateral) (frontal) (frontal) (lateral)
D µm 24 20 24 22 17
d µm 1.9 1.9 0.9 2.0 2.0
f µm 70 40 70 55 35
v
(at 500 nm) 2.6 2.6 1. 6 2.6 2.6Sources:
D, effective facet diameter,
(Calliphora),
from measurements by Ribi (unpublished)D (Musca), from Stavenga (1975) 1
f, focal length
(Calliphora),
from Seitz (1968)'f (Musca), from Stavenga (1975) 1
d, rhabdomere diameter
(CaZZiphora),
the present study (Table 1.1)d, (Musca), from Boschek (1971)
v,
the waveguide parameter determined in Musca (Kirschfeld and Snyder, 1975) and assumed to be similar inCalliphora.
1These measurements are for male specimens, however values in female specimens of
Musca are not very different (Mcintyre, personal communication).
R7/8 (frontal)
22
1. 0 55
1. 6
""·
j
.:,.
'*
~
[image:40.844.25.830.55.564.2]28
RESULTS
1. Angular sensitivity as a function of eye region
For this survey, recordings were all made during a one
week period, using cultured flies of the same generation, so as to minimise any sources of variation related to age or genetic background. Different eye regions were sampled by simply varying the direction and starting point of the electrode track. For the greatest convenience, eye region
is defined by the coordinates of each cell's visual axis, which may be read off from the coordinates on the Cardan arm,
when the point source is accurately centred on the cell's visual axis. Coordinates are given relative to the
longitudinal axis of the fly's head (anterior-posterior axis). Measurements were made by recording-the peak responses to
100 ms flashes of monochromatic light of 541 nm, as the point source was moved through the centre of the cell's
visual field in 1/4° or 1/2° steps.
A total of 45 cells of good stability, deep resting
po~ential, high maximum response (V > 50 mV) and similar max
high absolute sensitivity, were sampled during this period. In each cell, 2 - 4 repeated determinations of angular
sensitivity were made in the horizontal plane. All cells
included in the sample represented cells Rl-6, as judged by their spectral sensitivity and relatively noise free
responses (see Appendix B).
The majority of cells (33) had the vertical coordinate of their visual axes within ± 20° of the horizontal, and
3 - .
• •
•
•
•
... *
•
-0 Q.<I
2
I
-1
Figure 1.4
position.
•
•
•
•
•
*
••
•
...
•
•
I I I
0
20
40
•
•
I60
Ho
•
•
•
I80
•
•
• •
I I
100
120
A plot of ~p values in
CaZZiphora
against eye Each point represents the ~p of one cell (Rl-6)140
averaged from 2-4 repeated determinations. Eye position (H0) is
expressed in terms of the horizontal coordinate of the cells visual axis relative to the anterior-posterior axis of the
fly. For the sample shown here (33 cells), the vertical coordinates of the cells' visual fields all fell within ±20° of the horizontal plane. Tho stars represent tho theoretical
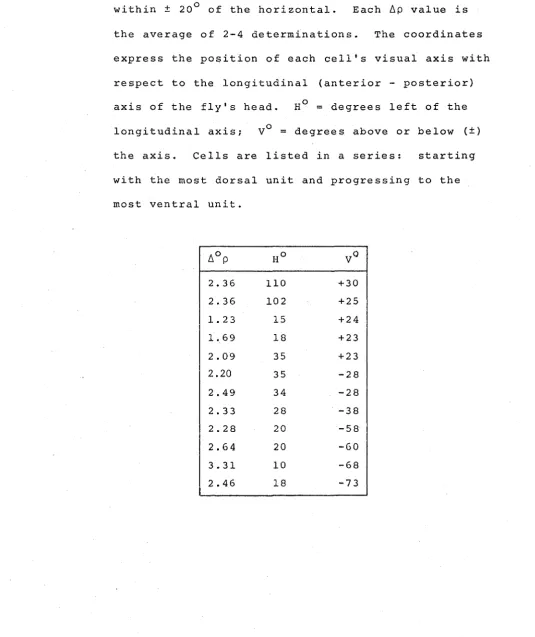
TABLE 1.3
/J.p values not included in Figure 1.4 because the
vertical visual axes of the cells did not fall within ± 20° of the horizontal. Each /J.p value is
the average of 2-4 determinations. The coordinates express the position of each cell's visual axis with respect to the longitudinal (anterior - posterior) axis of the fly's head. H0
=
degrees left of thelongitudinal axis;
v
0=
degrees above or below (±) the axis. Cells are listed in a series: starting with the most dorsal unit and progressing to the most ventral unit./J.op Ho VO
2.36 110 +30
2.36 102 +25
1. 23 15 +24
1. 69 18 +23
2.09 35 +23
2.20 35 -28
2.49 34 -28
2.33 28 -38
2.28 20 -58
2.64 20 -60
3.31 10 -68
[image:43.598.35.570.194.831.2]plotted as a function of the cells' horizontal coordinate,
revealing a consistent increa~e in ~p values from frontal, through to lateral eye regions.
listed in Table 1.3.
The remaining results are
2. Angular sensitivity as a function of rhabdomere diameter.
Each ommatidium in the fly contains 6 peripheral
photo-receptors (Rl-6) with rhabdomeres of approximately similar size, and two central photoreceptors (R7 and RS) which share
a common tiered rhabdom with a significantly smaller diameter (Fig. 1.3). By recording from both R7 (or RS) and an Rl-6
cell in the same (or nearby) ommatidium, i t was hoped to
rev~al directly the effect of rhabdomere diameter upon the
acceptance angle.
Since R7 and R8 may only be recorded rarely, this comparison was initiated after first penetrating either an
R7 or R8 (criteria for identification are given in Appendix B). After first determining the angular sensitivity in one of the
central retinula cells (using monochromatic light of wavelength 358 nm for an R7, or 541 nm for an RS cell), the electrode
was carefully manoeuvred in an attempt to penetrate an Rl-6
cell in the same ommatidium. The angular sensitivity of the
Rl-6 cell was then determined, with the same wavelength, for
29
a direct comparison (Fig. 1.5). A knowledge of the juxtaposition
of the receptors in the region recorded from is useful in this context. In the frontal eye regions recorded from in these experiments, in the ventral sector (below the equator) R7 is the first cell of an ommatidium to be encountered (Kirschfeld,
2omvL
R7
45s
,r
1
1
a
•
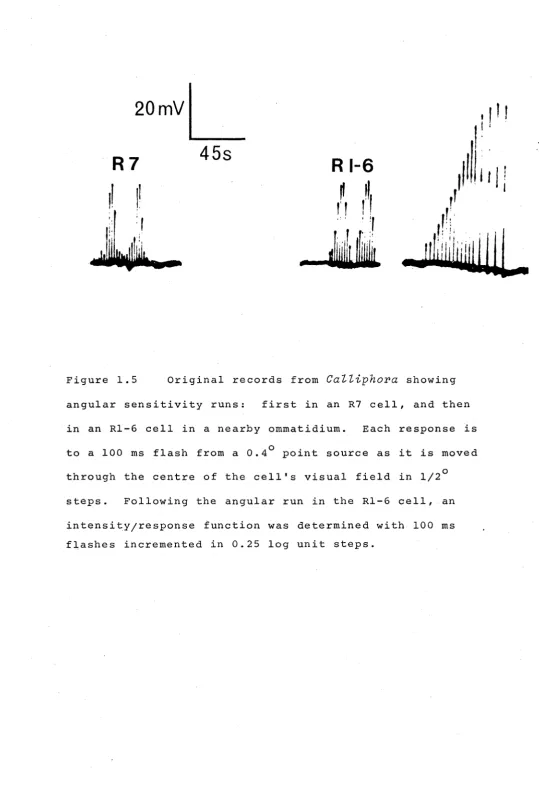
Figure 1.5 Original records from
CaZZiphora
showingangular sensitivity runs: first in an R7 cell, and then in an Rl-6 cell in a nearby ommatidium. Each response is to a 100 ms flash from a 0.4° point source as i t is moved through the centre of the cell's visual field in 1/2° steps. Following the angular run in the Rl-6 cell, an
[image:45.597.40.579.24.808.2]result in a good chance of penetrating another cell (Rl-6) in the same ommatidium. Above the equator, however, (dorsal
sector), R7 is the last cell to be encountered in an
ommatidium, and now one should withdraw the electrode by ca.15µm and then advance again in order to penetrate an Rl-6
cell in the same ommatidium. In actual fact, in only 4 cases was i t possible to be confident that an Rl-6 cell had been
penetrated in the same ommatidium, and in the other cases
recordings were made from Rl-6 cells up to 6 ommatidia distant.
However, since the optical parameters of ommatidia change l i t t l e over such a short distance, (e.g. Stavenga, 1975),
the comparison of 6p values is s t i l l believed to reflect the effect of rhabdomere diameter. The
•in vivo
recovery'technique for identification of intracellularly stained photoreceptors (Appendix. B) was employed to demonstrate directly that i t is indeed possible to judge the proximity of sequentially recorded cells, purely by reference to the
relative depths of the penetrations (monitored by a micrometer gauge on the micromanipulator) .
~p values in R7/8 and nearby Rl-6 cells, along with the estimated proximity of the cells compared, are shown in Table 1 . 4 . With one exception the ~p value of the central retinula
cell is significantly smaller than that of the Rl-6 cell, as predicted by Kirschfeld or Franceschini (1968). Since all
the cells were in the same general eye region (visual axes
± 30°, both vertically and horizontally of the longitudinal
axis), where Figure 1.4 reveals that there is l i t t l e variation of ~p (at least in Rl-6), the results may be usefully averaged
to give what are considered to be reliable estimates of ~p
for both Rl-6 and R7/8 in frontal eye regions.
So far, all the data presented have been derived from
measurements in Cattiphora stygia. Whilst few angular
measurements were made in other species, i t is worth reporting
here the few values determined in Musca domestica (white). From 4 Rl-6 cells in frontal regions, the average ~p value was 2.3° (cf. 2.5° measured by Scholes (1969) ) ; and from
3 R7 cells in a similar region the average ~p value was 1.6°.
J.
AnguZar sensitivity as a function of waveZengthAccording to Eq. (1.1), the size of the Airy disc can be varied, whilst recording from the same cell, simply by the
use of different wavelengths. With the appropriate numerical assumptions (Table 1.2) and assuming a circular step function for the rhabdomere acceptance function, the theory predicts that ~p should in fact be relatively insensitive to variations in the Airy disc diameter over the range of wavelengths
visible to the fly (Fig. 1.2). To test this prediction, the
angular sensitivities of 10 Rl-6 cells were measured at
different wavelengths. All cells were from the frontal region of the eye, and measurements were made routinely in the green
(523 or 541nm)and the ultraviolet (333 nm). In one cell, the
angular sensitivity was determined at 11 different wavolenghts.
The results are plotted in Figure 1.6, compared with the predictions from the theory described. As predicted there
is very little indication of any wavelength dependence of
~p (see also, Horridge et aZ., 1976).
a)
Mean /::,,p
b)
Mean !::,,p
TABLE 1.4
Angular sensitivities of· a) R7 and b) RS compared to Rl-6 in
CaZZiphora.
!::,,p values are the average of two or more determinations. In each case the R7/S axis is given relative to the anterior-posterior axis of the fly 0L = degrees left of the anterior-posterior.. d 0 0 d b b 1 h
axis, an + or -
=
egrees a ove or e ow t e anterior-posterior axis. Proximity indicates how many ommatidia distant was the Rl-6 with which the !::,,p value is compared.!::,,p R7 Axes /::,,p Rl-6 Proximity
0.94° 6°L,0° 1.22° 3 omma.
1.14° 12°L,S0 + 1.57° 2 omma.
1.60° 25°L,S0 + 1.70° ca. 5 omma.
1.60° 0°L,30°- l.S5° same omma.
1.03° 20°L,5° + 1.56° ca. 6 omma.
1.04° 10°L,3° + l.6s0 2 omma.
1.32° 20°L,10°+ 1.57° same omma.
1.26° ± 0.59° ( 1. 0 S.D.) 1.61° ± 0.13° (1. 0 S. D. )
!::,,p RS Axes !::,,p Rl-6 Proximity
1. 32° 26°L,7° 1.20° same omma.
1.11° 22°L,o0 l.ss0 same omma.
1.15° 13°L,o0 + 1. 40 ca. 5 omma.
20
0 0•
--A
-J
...
-
Q•--
B
...
---
----...
0... --0--eo
r:::
-...
...
0...
- - . . - $ ~...
.
•
--
...
0----
-O>
-·-
-
0Q)
•
-0
•
•
"-.
10
•
a..
<J
400
500
600
Wavelength nm
Figure 1.6 Angular sensitivity as a function of wavelength in
CaZZiphora.
~p values come from 10 cells in frontal eye regions. o, Measurements in vertical plane..,
Measurements in horizontal plane.A,
Measurements from one cell in whichangular sensitivity was determined at 11 wavelengths (in the vertical plane). Line A (broken) is the theoretical prediction assuming a Gaussian approximation for the rhabdomere acceptance function. Line B (solid) is the theoretical prediction
32
4. Spectral sensitivity
The comparison between
6p
values in Rl-6 with those in R7/8, demonstrates that the rhabdomere diameter is animportant £actor in determining the angular sensitivity function. Whilst the lack of wavelength dependence, just
described, is consistent with there being an Airy disc formed at the level of the rhabdomere tips, such a negative result
cannot be considered proof of this. What was hoped to be a more sensitive test for the influence of the Airy disc was thus devised. The amount of light captured by a rhabdomere
from an axial point source is predicted to depend upon the relationship between the rhabdomere and Airy disc diameters. Thus if the Airy disc falls completely within the rhabdomere's
cross section, all the light may be captured, but if the Airy disc iB larger, then some of the light will be lost. The predicted effect is shown in Figure 1.2 by the absolute heights of the angular sensitivity functions at
o
0 • Theeffect should be to enhance sensitivity to shorter wavelengths.
However, no such effect should be observed when measuring sensitivity with an extended source. To test this predicted effect of the Airy disc diameter, spectral sensitivity,
determined with a point source (0.1 ) , was compared to that 0
measured using an extended source (3°). Following these tests, the angular sensitivity was determined to ensure that
i t was as narrow as expected for the eye region in question. Two cells were tested in this way. Both were located in
0 0
frontal eye regions, and had 6p values of 1.6 and 1.7 respectively. Repeated determinations, however, failed to
33
measured with either the point or the extended source.
6. Angular sensitivity as a -function of adaptation
The data so far presented has come from dark-adapted animals. Whilst this is the very information required for
a comparison with theoretical predictions of angular
sensitivity (which make no assumptions regarding adaptation),
a complete account of the angular properties of photoreceptors' should include a description of light-adapted angular
sensitivity, as this information may be of value in
interpreting results from studies of behavioural acuity,
which are often made in a light-adapted situation.
In 14 Rl-6 cells in CaZZiphora stygia, angular sensitivity
measured in the dark was compared to that measured in the presence of an adapting light (white) of sufficient intensity
to generate a peak response of 75% V .
max The adapting light (consisting of a large field, 20° in visual angle) was turned on, and following the one or two minutes required for the
plateau depolarisation to reach a steady level, angular se.nsitivity was determined, as in the dark, by recording responses to incremental test flashes as the point source
(at the centre of the adapting surround) was moved through
the cell's visual field in 1/2° or 1/4° steps (Fig. 1.7) Finally a light-adapted V/log I curve was determined so that the responses could be converted to sensitivities. The
results, shown in Table 1.5 reveal that in every case there is a slight reduction in the acceptance angle, and overall, the light-adapted ~p values averaged 80% ± 14% of the dark-adapted
11n
I \
2omvL
60s
~o ,1,.
2 It
. I
'
I,', 1,
•
!
~:
I ' !1
3
4
2
Figure 1.7 Original records showing angular sensitivity runs in an Rl-6 cell in
CaZZiphora.
Following two runs(using 1/2° steps) in the dark-adapted state (1), a white adapting surround is turned on (2), and following
equilibration of the plateau depolarisation, repeated
determinations are made in the light-adapted state, first using 1/4° steps (3), and then 1/2° steps (4). Finally a light-adapted intensity/response function is determined
(5) so that the responses may be converted to sensitivities.
The unit in question is unit 19.S.6 of Table 1.5.
I
I II
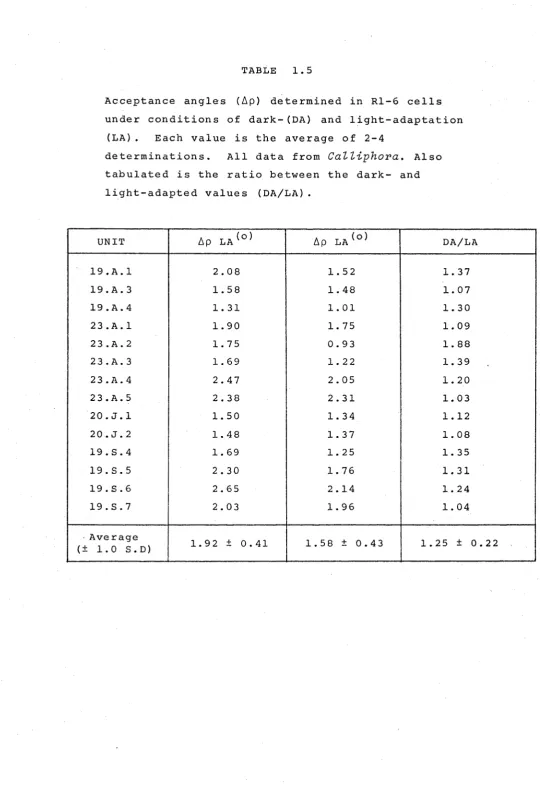
TABLE 1. 5
Acceptance angles (~p) determined in Rl-6 cells
under conditions of dark-(DA) and light-adaptation
(LA) . Each value is the average of 2-4
determinations. All data from
CaZZiphora.
Alsotabulated is the ratio between the dark- and
light-adapted values (DA/LA).
UNIT ~p LA(o) ~p LA(o) DA/LA
19.A.l 2.08 1. 52 1. 37
19.A.3 1. 58 1. 48 1. 07
19.A.4 1. 31 1. 01 1. 30
23.A.l 1. 90 1. 75 1. 09
23.A.2 1. 75 0.93 1. 88
23.A.3 1. 69 1. 22 1. 39
23.A.4 2.47 2.05 1. 20
23.A.5 2.38 2.31 1. 03
20.J.l 1. 50 1. 34 1.12
20.J.2 1. 48 1. 37 1. 08
19.S.4 1. 69 1. 25 1. 35
19.S.5 2.30 1. 76 1. 31
19.S.6 2.65 2.14 1. 24
19.S.7 2.03 1. 96 1. 04
·Average
1. 92 ± 0.41 1. 58 ± 0.43 1. 25 ± 0.22
[image:53.595.30.571.33.823.2]