Value for Money
analysis of DFID-funded
WASH programmes
in six countries
SYNTHESIS REPORT (AUGUST 2015)
Sophie Trémolet, Marie-Alix Prat, Lucrezia Tincani,
Ian Ross, Ana Mujica, Peter Burr and Barbara Evans
Phot
o cr
edit:
Marie-Alix Pr
Abstract
This report presents summary findings from the Value for Money (VFM) analysis conducted for six DFID-funded programmes between September 2013 and April 2015. Based on these findings, the report formulates insights on how VFM analysis can be used to improve WASH programming. We identify challenges in doing such analysis and formulate recommendations to overcome these challenges to bring VFM analysis into the mainstream.
The VFM-WASH project
This report is an output of the VFM-WASH project, which stands for “Value for Money and Sustainability in WASH programmes”. This was a two-year research project funded by DFID, conducting operational research into DFID’s WASH programmes in six countries. A consortium of five organisations, led by OPM, has carried out the work. Research Partners are the University of Leeds, Trémolet Consulting, the London School of Hygiene and Tropical Medicine and Oxfam. The project had two main objectives:
1 To identify how VFM and sustainability can be improved in DFID-funded WASH programmes through operational research in six countries (Bangladesh, Ethiopia, Mozambique, Nigeria, Pakistan and Zambia). In each of these countries, the project team conducted a VFM analysis of a DFID-funded WASH programme. Focus programmes were implemented by the country’s government, by large organisations such as UNICEF or by small NGOs;
2 To assess the sustainability of rural WASH services in Africa and South Asia by carrying out nationally-representative household surveys in four countries (Bangladesh, Ethiopia, Mozambique and Pakistan), alongside gathering secondary data for a larger group of countries (e.g. existing surveys and Water Point Mapping initiatives).
See the project website for more information: http://vfm-wash.org
Acknowledgements
This analysis is based on work conducted between September 2013 and April 2015 by members of the VFM-WASH consortium. The research team included Sophie Trémolet and Marie-Alix Prat from Trémolet Consulting; Barbara Evans and Laura Bates from Leeds University; Ian Ross, Ana Mujica, Lucrezia Tincani and Peter Burr from OPM; Oliver Cumming, Jeroen Ensink, Adam Biran and Dr Joe Brown from LSHTM; Lara Sousa and Gaye Thompson from Nor Consult; and individual consultants including Dr Seifu Kebede, Dr Amal Halder of ICDDR-B; Yameen Memon, Dr Isaiah Oke and Dr Hikabasa Halwiindi.
The team benefited from the support and facilitation of Laura Westcott, Statistics Adviser for the WASH Policy Team at DFID; Rita Zacarias, WASH Advisor at DFID Mozambique; Julieta Felicidade Paulo from DNA; Martha Salomon, WASH Advisor at DFID Ethiopia; the staff of UNICEF Bangladesh and in particular Mohammad Monirul Alam; Fiona Word and Hrachya (Charlie) Sargsyan, Kelley Toole and Chibesa Chibesakunda at DFID Zambia; Nicolas Osbert, John Pinfold and all the WASH team members at UNICEF Zambia; Magnus Wolfe-Murray at DFID Pakistan; Tesfaye Bekalu and Wendwosen Feleke from the World Bank in Ethiopia; Boluwaji Onabolu and Kannan Nadar at UNICEF Nigeria; and Amy Potter and Esther Forgan at DFID Nigeria.
VFM-WASH
Table of Contents
Abstract ii
The VFM-WASH project ii
Acknowledgements ii
Table of Contents iii
List of Tables and Figures v
List of Abbreviations vi
1 Introduction 1
1.1 What is Value for Money and Value for Money analysis? 1 1.2 Research methodology 2
1.3 Report structure 2
2 Framework for VFM analysis 3
2.1 Results chain and indicators 3 2.2 Cost categories for VFM analysis 7
3 Overview of programmes analysed 8
3.1 SHEWA-B - Bangladesh 8
3.2 WSSP - Ethiopia 9
3.3 PRONASAR Common Fund (CF) - Mozambique 10
3.4 SHAWN - Nigeria 10
3.5 Response to 2010 floods - Pakistan 11 3.6 Zambia Sanitation and Hygiene Programme (ZSHP) – Zambia 11
4 Summary of key findings from the VFM analysis 12
4.1 Water supply at household level 12
4.1.1 Economy 15
4.1.2 Efficiency and cost-efficiency 16 4.1.3 Effectiveness and cost-effectiveness 28
4.2 Sanitation 20
4.2.1 Economy 23
4.3 Hygiene promotion 27
4.3.1 Economy 29
4.3.2 Efficiency and cost-efficiency 29 4.3.3 Effectiveness and cost-effectiveness 31
4.4 WASH in Schools 31
4.4.1 Economy 32
4.4.2 Efficiency and cost-efficiency 33 4.4.3 Effectiveness and cost-effectiveness 34
5 How can VFM analysis be used to improve WASH programmes? 35
5.1 Using VFM analysis throughout the programme cycle 35 5.2 Taking account of external factors impacting VFM 36 5.3 Taking account of internal factors impacting VFM 38
6 Challenges and recommendations for VFM analysis 42
6.1 Challenges in doing VFM analysis 42 6.2 Recommendations for programme implementers 44 6.2.1 Develop a clear logframe for monitoring results and use it consistently 44 6.2.2 Develop a centrally managed tool to track inputs and outputs jointly 45 6.2.3 Strengthen the monitoring of sustained actual outcomes and their equity 45 6.3 Recommendations for funders 46 6.3.1 Request VFM analysis from programme implementers 46 6.3.2 Support the development of tools to facilitate VFM analysis 46 6.3.3 Support capacity building and information sharing on VFM analysis 47
Annex A – Key references 48
A.1. Background documents on the concept of Value for Money 48 and its application in the WASH sector
List of Tables and Figures
Figure 1. The WASH results chain 3
Figure 2. The five dimensions for assessing VFM of WASH programmes 4
Figure 3. Overview of WASH programmes analysed 8
Figure 4. Average unit capital costs of water points technologies: SHEWA-B Water Points 15
Figure 5. Budgeted and actual costs for Handpump-fitted borehole (HPBH) 16 construction for SHAWN-I – by regions
Figure 6. Cost per water point for PRONASAR CF 18
Figure 7. Cost-effectiveness – Cost per person who gained access to an arsenic-safe 19 water point and uses it
Figure 8. Cost-efficiency indicator for WASH in Schools: US$ per school-age child 33
Figure 9. Where VFM analysis fits in the WASH programming cycle 35
Table 1. Key dimensions of VFM: definitions and examples of indicators 5
Table 2. Programme cost categories 7
Table 3. Water supply activities – programmes’ characteristics 13
Table 4. Summary of VFM indicators for water supply activities 14
Table 5. Sanitation activities – programmes’ characteristics 21
Table 6. Summary of VFM indicators for sanitation 22
Table 7. Hygiene promotion activities – programme characteristics 28
Table 8. Summary of VFM indicators for hygiene promotion 29
Table 9. WASH in schools activities – key programme characteristics 31
Table 10. Summary of VFM indicators for WASH in schools 32
Table 11. Examples of external factors impacting the VFM of WASH programmes 37
Table 12. Examples of internal factors impacting the VFM of WASH programmes 38
Box 1. Cost of water point construction contracts in Bangladesh (SHEWA-B) 15
Box 2. Costs of water point construction contracts in Nigeria (SHAWN-I) 16
Box 3. Annual variations in cost per water point for PRONASAR CF – Mozambique 18
Box 4. Methodological challenges with estimating the effectiveness and 19 cost-effectiveness of water interventions in SHEWA-B – Bangladesh
Box 5. Monitoring ODF conversion in the ZSHP in Zambia 25
Box 6. Cost efficiency of CLTS campaigns in Mozambique 26
Box 7. Cost efficiency of CLTS campaigns in Zambia 26
List of Abbreviations
ARI Acute respiratory infectionCATS Community Approaches to Total Sanitation
CF Common Fund
CHP Community hygiene promoters
CLTS Community-led total sanitation
DFID UK Department for International Development
DNA Direcção Nacional de Águas (National Water Directorate)
DPHE Department of Public Health Engineering
FSM Faecal sludge management
GIS Geographic information system
HPBH Handpump fitted boreholes
ICDDR,B International Centre for Diarrhoeal Disease Research, Bangladesh
IDA International Development Association
IPS Indirect programme support
JMP Joint Monitoring Programme
KAP Knowledge, attitude and practice
LGA Local Government Authority
M&E Monitoring and evaluation
M2W Mobile-to-web
MBH Motorised boreholes
MDG Millennium Development Goals
MICS Multiple Indicator Cluster Survey
MoLGH Ministry of Local Government and Housing
MoFED Ministry of Finance and Economic Development
NGO Non-governmental organisation
NRWSSP National Rural Water Supply and Sanitation Programme
O&M Operation and maintenance
ODF Open defecation free
PEC Participação e Educação Comunitário (Community Participation and Education)
PRONASAR Programa Nacional de Agua e Saneamento Rural (National Rural Water Supply and Sanitation Programme)
RPS Rural piped schemes
SHAWN Sanitation, Hygiene & Water in Nigeria
SHEWA-B Sanitation, Hygiene Education and Water Supply Programme in Bangladesh
SINAS National Sector Information Management System
SLTS School-led total sanitation
SSHE School sanitation and hygiene education
SWSS Small water supply systems
UNDP United Nations Development Programme
UNICEF United Nations Children’s Fund
US$ United States dollars
VFM Value for Money
VLOM Village-level operation and maintenance
WASH Water, sanitation and hygiene
WP Water point
WSSP Water Supply and Sanitation Programme
1
Introduction
This synthesis report is one of the main outputs of the VFM-WASH project, which stands for “Value for Money and Sustainability in WASH programmes”. Under this project, research activities were carried out in six countries where DFID has made significant investments in the WASH sector, including Bangladesh, Ethiopia, Mozambique, Nigeria, Pakistan and Zambia. VFM analysis was carried out in all six countries (what we refer to as “Objective 1”) whereas surveys on the sustainability of WASH infrastructure at national level (referred to as “Objective 2”) were completed in four of these countries (Bangladesh, Ethiopia, Mozambique and Pakistan).
This synthesis report presents the main findings from Objective 1 research, namely the VFM analysis of six DFID-funded WASH programmes.
1.1
What is Value for Money and Value
for Money analysis?
The UK Department for International Development (DFID) defines Value for Money (VFM) as “maximising the impact of each pound spent to improve poor people’s lives” (DFID, 2011). This echoes the UK National Audit Office’s definition, which defines VFM as being “the optimal use of resources to achieve intended actual outcomes”. A key element in both definitions is to make the best use of available resources to achieve sustainable development outcomes.
VFM can be measured on the basis of a set of standard indicators, which can help programme implementers (and their funders) assess whether or not their programmes are making the best use of available resources. Answering this question is not an easy task: it requires conducting a “VFM analysis”, i.e. collecting and analysing data on the costs and results of the particular programme, interpreting the VFM indicators generated, and comparing them with those of other programmes. A qualitative assessment is needed to interpret the results from the VFM analysis, in order to better understand the context, the types of results and the processes by which these results were generated so as to be in a position to identify areas where changes in programme management could improve the overall performance of the programme.
A key objective of conducting a VFM analysis is to help managers improve programme
performance. It can give programme managers useful metrics to quantify the effects of challenges they observe on the ground and identify the best interventions to address them, including by the reallocation of resources.
Conducting a VFM analysis is not necessarily about saving money and reducing unit costs: it is about maximising actual outcomes and impacts. Whilst the VFM of a programme could sometimes be improved by reducing the costs of certain inputs, greater and more sustainable actual outcomes can also be delivered by spending more on certain inputs.
VFM analysis should consider key contextual elements of the programme: it is essential to gather as much information as possible on the operating conditions of the programme, its operating
modalities and approaches. VFM analysis should be considered as a tool to be added to the essential toolbox of programme managers and evaluators rather than being considered as a stand-alone piece of analysis that replaces other evaluation tools.
1.2 Research methodology
A research methodology was initially drafted and used to conduct the VFM analysis of programmes under review. It was further developed at the end of the research based on the experience of the team and reflected in a note entitled “How to do Value for Money analysis for WASH programmes” and available online at http://vfm-wash.org/category/publications.
In September 2013, the VFM-WASH project, jointly with DFID, identified focus countries and programmes interested to take part in the research, based on demand expressed by DFID country offices. The selection of programmes was designed to reflect a range of interventions across the WASH sector (covering water, sanitation and hygiene interventions at household level and in schools, mostly in development contexts but also to address humanitarian crises) and a spread of implementation arrangements (including through national programmes and government agencies, and international organisations such as UNICEF, and NGOs). Given the existing nature of DFID’s WASH portfolio, the majority of the programmes under review are operating in rural areas, albeit some also operated in small towns.
The VFM analysis of DFID-funded programmes was carried out in a series of stages:
• From September 2013 to June 2014, the research team conducted country visits and gathered data on expenditure and results of programmes. It conducted interviews with programme staff and sector stakeholders to better understand the programmes, identify what data was available (and in what form), and collect relevant documentation and reports, including any programme evaluations.
• Interim reports based on preliminary results were presented to DFID and local partners between January and June 2014. These reports formulated recommendations to improve programme monitoring systems, particularly the tracking of inputs and results. They emphasised the need to strengthen tracking of outcomes over time, so as to provide a stronger basis for future VFM analysis. The reports also formulated programmatic recommendations for improving each programme’s VFM. Given that the majority of the programmes under review were already completed or were well under way with established implementation arrangements, the capacity for these reports to make an impact on programme implementation modalities was limited. However, findings have influenced the design of future programmes, for example, in Bangladesh and indirectly in Ethiopia.
• From January to April 2015, the team conducted a second round of data collection in four countries to improve the level of detail of analysis, gather data for additional years or incorporate findings from Objective 2 surveys, particularly with respect to outcomes, given that outcome data was typically missing from standard monitoring systems. Additional research was conducted in Bangladesh, Ethiopia, Mozambique and Zambia.
In all countries, comparator programmes were identified so as to be able to compare VFM indicators of DFID-funded programmes with those of similar programmes in the same country. Where those programmes were interested in taking part in the research, we collected similar data and applied the same methodology to compute VFM indicators. Data was collected from the UNICEF One Million Initiative (OMI) in Mozambique, Community-Led Accelerated WASH (COWASH) in Ethiopia and World Vision in Zambia.
1.3
Report structure
The present report is organised as follows:
• Section 2 briefly summarises the conceptual framework used to conduct the VFM analysis of WASH programmes in the VFM-WASH project;
• Section 3 provides an overview of the programmes analysed, based on a number of key descriptors (type of programme, location, years, budget, grant recipient, implementing partners etc.);
Equity
Outputs
(e.g. facilities built, communities triggered,
based on M&E systems)
Process
(e.g. borehole drilling, CLTS triggering)
Inputs
(capital, labour)
Costs
(£) Sustained actual outcomes
(e.g. actual number of WASH service users
as a result of project, based on baseline/ endline surveys)
Impacts
(e.g. improved health and education
outcomes)
Assumed outcomes
(e.g. estimated number of beneficiaries based on assumptions)
Efficiency Effectiveness
Cost-effectiveness Cost-efficiency
Economy
1 Based on a diagram from DFID’s WASH portfolio review (2012), amended by authors based on experience in projects examined and on literature review of this work in practice.
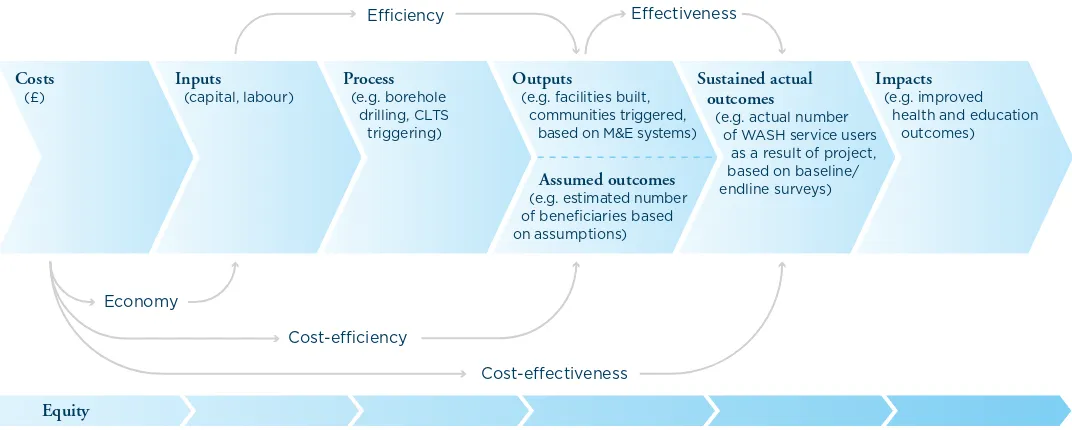
The results chain is composed of seven main elements:
1 Costs – the financial costs of inputs;
2 Inputs – the resources used, in terms of finance and staff time (capital and labour);
3 Process – the process by which inputs are transformed into results. Such processes can be the object of a programme evaluation (which would be useful as a source of qualitative assessment) but cannot be quantified through VFM analysis;
• Section 5 reflects on the VFM-WASH project findings to extract key lessons on using VFM analysis to improve programme management. The main emphasis in terms of learning has been placed on how VFM analysis can be used at the level of specific programmes and later, once a substantial set of comparable data becomes available, to draw comparisons across programmes;
• Section 6 identifies the challenges that were met by the research team and formulates
recommendations that aim to mainstream the use of VFM analysis in the WASH sector. They are targeted both at programme implementers (to help them improve data collection so as to facilitate VFM analysis) and at funders (to help promote a VFM culture within the sector). In addition:
• Annex A includes a list of key references for this work.
2
Framework for VFM analysis
The analysis follows the standard methodology set out in the note “How to do Value for Money analysis for WASH programmes” and available online at http://vfm-wash.org/category/publications.
2.1
Results chain and indicators
[image:11.595.30.566.407.622.2]The VFM conceptual framework is based on a logical ‘results chain’, which explicitly sets out the results to be achieved by a given programme. Figure 1 below presents the main elements of this results chain and shows where the main dimensions of VFM can be measured.
Economy Efficiency
Cost-efficiency
Cost-effectiveness
Effectiveness
VFM
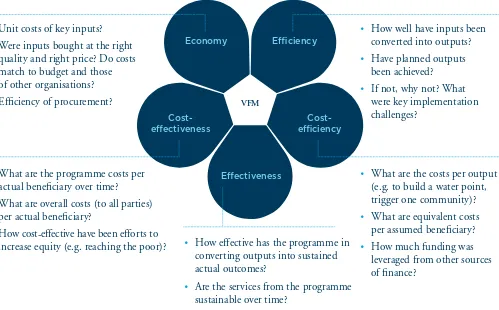
• How well have inputs been converted into outputs?
• Have planned outputs been achieved?
• If not, why not? What were key implementation challenges?
• Unit costs of key inputs?
• Were inputs bought at the right quality and right price? Do costs match to budget and those of other organisations?
• Efficiency of procurement?
• What are the programme costs per actual beneficiary over time?
• What are overall costs (to all parties) per actual beneficiary?
• How cost-effective have been efforts to increase equity (e.g. reaching the poor)?
• What are the costs per output (e.g. to build a water point, trigger one community)?
• What are equivalent costs per assumed beneficiary?
• How much funding was leveraged from other sources of finance?
• How effective has the programme in converting outputs into sustained actual outcomes?
• Are the services from the programme sustainable over time?
4 Outputs – the direct deliverables of the programme (number of water and sanitation facilities built, number of activities implemented such as CLTS triggering, etc.);
5 Assumed outcomes – resulting from the outputs, e.g. the number of beneficiaries assumed to have gained access to WASH services as a result of the outputs of the programme’s interventions. This can be based on existing standards and assumptions at country level, or based on lists of households;
6 Sustained actual outcomes – i.e. the actual change in poor people’s lives over time, such as the number of new people moving from using an unimproved water point to an improved one. The key difference with “assumed outcomes” is that “sustained actual outcomes” are measured based on household survey data before and after an intervention (e.g. 6, 12, 36 months after); i.e. based on the difference in key variables at baseline, endline and beyond. This captures the extent to which the outcomes have been achieved. Such data are only available if robust M&E and data collection frameworks are in place, which is seldom the case. Of the six programmes analysed by the VFM-WASH project, only the SHEWA-B project in Bangladesh had gathered data on actual outcomes that could be used for the VFM analysis. With more than one post-intervention survey, it would be possible to explore the extent to which outcomes have been sustained over time.
7 Impacts – the longer-term impact of the WASH programme, including the impact on health and education, e.g. reduced diarrhoea, increased school attendance, and on poverty reduction, which is the ultimate intended impact of DFID programming.
Figure 1 represents a chain of events through time, given that these different types of results would usually, but not always, take place sequentially. The causal links between these different types of results needs to be informed by evidence, however, as a sustained actual outcome (in terms of people actually using WASH services) or an impact in the programme area may be influenced by factors outside the programme.
[image:12.595.38.537.481.791.2]Five key VFM dimensions can be analysed in the context of WASH programmes: economy, efficiency, cost-efficiency, effectiveness and cost-effectiveness. The analysis did not go beyond the outcome level as it was deemed too challenging to estimate the costs of reaching alternative impacts in the context of this project. Each of these dimensions is defined by a conceptual relationship between two of the elements in Figure 1, as shown by the arrows linking the different elements. Questions that need to be answered in order to characterise these five key dimensions are presented in Figure 2 below.
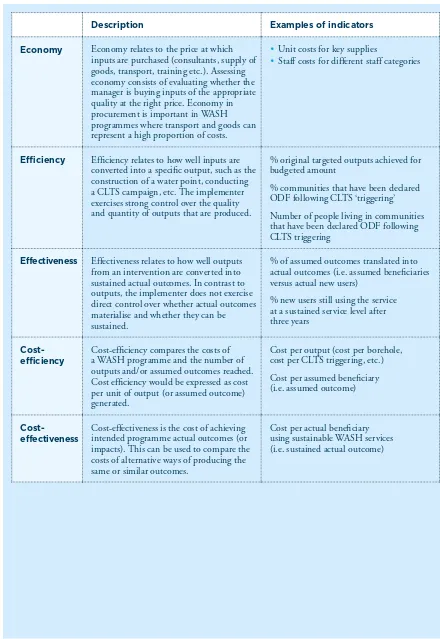
Table 1. Definitions of the five dimensions for assessing VFM of WASH programmes
Description Examples of indicators
Economy Economy relates to the price at which inputs are purchased (consultants, supply of goods, transport, training etc.). Assessing economy consists of evaluating whether the manager is buying inputs of the appropriate quality at the right price. Economy in procurement is important in WASH programmes where transport and goods can represent a high proportion of costs.
• Unit costs for key supplies
• Staff costs for different staff categories
Efficiency Efficiency relates to how well inputs are converted into a specific output, such as the construction of a water point, conducting a CLTS campaign, etc. The implementer exercises strong control over the quality and quantity of outputs that are produced.
% original targeted outputs achieved for budgeted amount
% communities that have been declared ODF following CLTS ‘triggering’ Number of people living in communities that have been declared ODF following CLTS triggering
Effectiveness Effectiveness relates to how well outputs from an intervention are converted into sustained actual outcomes. In contrast to outputs, the implementer does not exercise direct control over whether actual outcomes materialise and whether they can be sustained.
% of assumed outcomes translated into actual outcomes (i.e. assumed beneficiaries versus actual new users)
% new users still using the service at a sustained service level after three years
Cost-efficiency Cost-efficiency compares the costs of a WASH programme and the number of outputs and/or assumed outcomes reached. Cost efficiency would be expressed as cost per unit of output (or assumed outcome) generated.
Cost per output (cost per borehole, cost per CLTS triggering, etc.) Cost per assumed beneficiary (i.e. assumed outcome)
Cost-effectiveness Cost-effectiveness is the cost of achieving intended programme actual outcomes (or impacts). This can be used to compare the costs of alternative ways of producing the same or similar outcomes.
The main adjustments to the WASH results chain compared to the one that appeared in the DFID WASH portfolio review (2012) are as follows:
• Distinguishing between assumed and actual outcomes: Many organisations make assumptions about outcomes based on outputs. For example, they assume that a new borehole will serve 250 people. In practice, the new borehole might serve more or fewer people, depending on population density and how attractive the new facility is compared to the type of facility that people could access before. The distinction between assumed and actual outcomes was therefore introduced to reflect those factors. Actual outcomes can only be measured if robust M&E systems with ongoing data collection are in place. In particular, it is necessary to measure the number of new users who gain access to improved services that they did not have before. One way to express uncertainty resulting from a lack of data is to use ranges of estimates.
• Taking sustainability and equity into consideration: Sustainability and equity are considered as an additional layer of analysis that cuts across the main VFM dimensions. These can, however, be incorporated into a VFM analysis when enough data are available.
The sustainability of programme results can be considered when measuring effectiveness and cost-effectiveness, as both are based on “sustained actual outcomes”. Measuring sustained actual outcomes at different points in time will highlight the number of people who initially were using the WASH service (as measured through an endline survey after project completion), but later stopped using it for a variety of reasons (as measured by a second post-implementation survey some time later). The extent to which this captures longer-term sustainability depends on the timeframe for VFM analysis and on data availability. Ideally, such data would be gathered at least three years after the programme, to verify that results have effectively been sustained. However, the most likely scenario is that a VFM analysis will be done during the programme or shortly after it ends. This kind of VFM analysis cannot predict whether the service will be sustainable in the future, as this would depend on factors such as the extent and quality of associated software activities (capacity development/ training, etc.) and on ensuring that financing is available to undertake major repairs at a future date.
Equity needs to be considered at several levels of the results chain, including at the level of inputs, outputs, outcomes and impacts. If sufficient data is available, this would mean conducting a standard VFM analysis for different groups. These groups can be defined in many ways, depending on how inequity manifests itself, i.e. through differences in income, gender or social groups (e.g. castes). In the present analysis, however, it was it was not possible to measure efficiency indicators across different social groups to consider equity as there was no sufficient data to do so.
2.2
Cost categories for VFM analysis
The VFM analysis included all expenditure that has contributed to achieving outputs and actual outcomes in a sustainable manner, including expenditure on relevant activities by actors outside the programme when they can be monetised (such as financial expenditure on staff costs, and contributions by governments or households).
It is more straightforward to assess the VFM of a donor programme based on programme costs alone, when these costs are allocated by programme components. From a donor’s perspective, VFM analysis based on programme costs can be seen as more relevant, since it provides a direct assessment of the quantity of donor funds invested to achieve a given result.
However, in programmes that seek to leverage significant funding from other sources (including government funding and household contributions), these additional contributions need to be included in order to derive the total costs of achieving those results and to provide a basis for comparisons with other programmes.
Taking account of these other contributions also allows estimating a leverage ratio, the ratio of non-programme to programme costs (such as household contributions to programme costs). The leverage ratio can potentially be included in the VFM analysis as an indicator of cost-efficiency, as it measures the extent to which the programme has been able to leverage additional funding to achieve results.
In programme-level reports and section 4 below, we have clearly identified whether non-programme contributions were estimated and how they were included in the analysis.
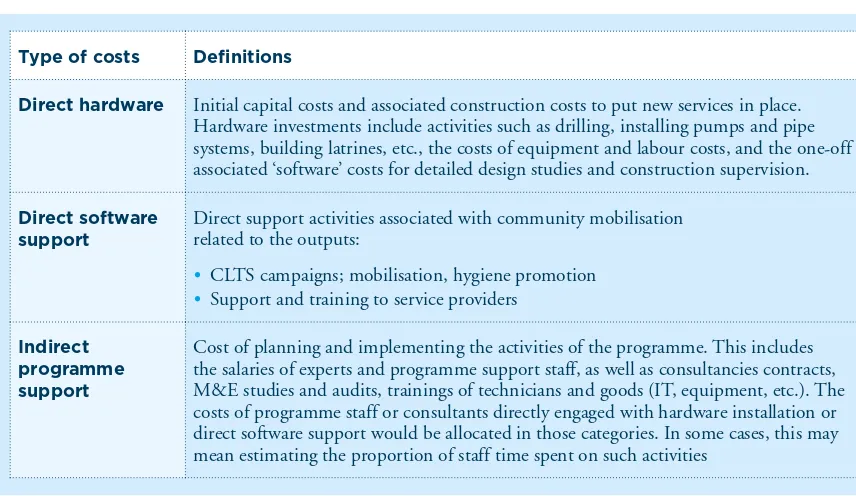
[image:15.595.134.562.404.652.2]For the purpose of the analysis, costs were categorised by types of inputs, distinguishing between hardware, direct software support and indirect programme support (IPS) costs. These cost categories are further defined in Table 2 below.
Table 2. Programme cost categories
Type of costs Definitions
Direct hardware Initial capital costs and associated construction costs to put new services in place. Hardware investments include activities such as drilling, installing pumps and pipe systems, building latrines, etc., the costs of equipment and labour costs, and the one-off associated ‘software’ costs for detailed design studies and construction supervision.
Direct software
support Direct support activities associated with community mobilisation related to the outputs:
• CLTS campaigns; mobilisation, hygiene promotion
• Support and training to service providers
Indirect programme support
Cost of planning and implementing the activities of the programme. This includes the salaries of experts and programme support staff, as well as consultancies contracts, M&E studies and audits, trainings of technicians and goods (IT, equipment, etc.). The costs of programme staff or consultants directly engaged with hardware installation or direct software support would be allocated in those categories. In some cases, this may mean estimating the proportion of staff time spent on such activities
WSSP
Country: Ethiopia
Actual expenditure: US$ 198 million
DFID contribution: US$ 107 million
Dates: 2008-2013
Scale: National
Sector: Rural Water, Sanitation and Hygiene
Implementation: Gov. of Ethiopia
3
Overview of programmes analysed
This section provides a brief overview of the programmes that have been analysed by the VFM-WASH project team, based on a number of key descriptors (type of programme, location, years, budget, grant recipient, implementing partners etc.).
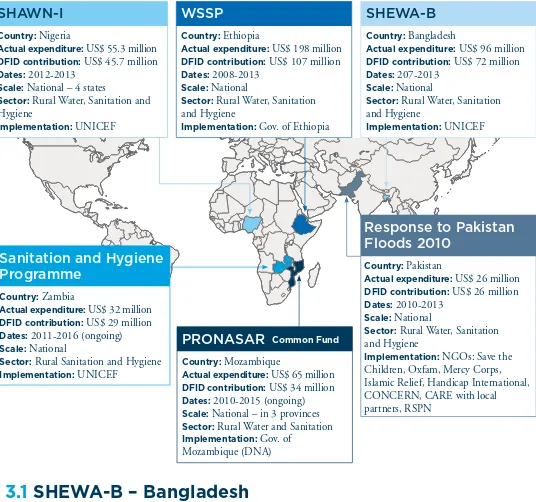
[image:16.595.32.568.192.694.2]A more detailed presentation of the results for each programme can be found in a series of briefs presenting summary findings from the analysis of each programme and in the full summary reports, all of which are available at www.vfm-wash.org. Figure 3 below maps the programme reviewed.
Figure 3. Overview of WASH programmes analysed 3
SHEWA-B
Country: Bangladesh
Actual expenditure: US$ 96 million
DFID contribution: US$ 72 million
Dates: 207-2013
Scale: National
Sector: Rural Water, Sanitation and Hygiene
Implementation: UNICEF
SHAWN-I
Country: Nigeria
Actual expenditure: US$ 55.3 million
DFID contribution: US$ 45.7 million
Dates: 2012-2013
Scale: National – 4 states
Sector: Rural Water, Sanitation and Hygiene
Implementation: UNICEF
PRONASAR
Country: MozambiqueActual expenditure: US$ 65 million
DFID contribution: US$ 34 million
Dates: 2010-2015 (ongoing)
Scale: National – in 3 provinces
Sector: Rural Water and Sanitation
Implementation: Gov. of Mozambique (DNA)
Common Fund
Country: Zambia
Actual expenditure: US$ 32 million
DFID contribution: US$ 29 million
Dates: 2011-2016 (ongoing)
Scale: National
Sector: Rural Sanitation and Hygiene
Implementation: UNICEF
Sanitation and Hygiene
Programme
Response to Pakistan
Floods 2010
Country: Pakistan
Actual expenditure: US$ 26 million
DFID contribution: US$ 26 million
Dates: 2010-2013
Scale: National
Sector: Rural Water, Sanitation and Hygiene
Implementation: NGOs: Save the Children, Oxfam, Mercy Corps, Islamic Relief, Handicap International, CONCERN, CARE with local partners, RSPN
2 Funding figures represent actual expenditure for completed programmes and budgets in the case of ongoing programmes.
3.1
SHEWA-B – Bangladesh
3 VFM analysis of these components was conducted in the main report but results were not included in the synthesis as this was the only instance where this was done.
4 US$ 17 million was spent on a wide range of evaluation and monitoring studies
in Bangladesh. Thus SHEWA-B had a strong programmatic focus on sanitation and hygiene behaviour change. Additional components included the provision of arsenic-free drinking water, school WASH, support to national policy development, and strengthening sub-national planning processes and implementation capacity.3 The programme targeted 60 rural upazilas (sub-districts)
known to be at risk of arsenic contamination in groundwater and where poverty incidence was greater than 40%. It directly targeted 21.4 million people with hygiene promotion within the selected intervention areas, and indirectly targeted an additional 10 million people outside intervention areas, bringing the total number of targeted beneficiaries to 31.4 million.
The programme was implemented by UNICEF. Project support was channelled to GoB through the Department for Public Health Engineering (DPHE). Total programme expenditure was US$ 96 million, of which DFID contributed US$ 72 million, DPHE US$ 16.3 million in direct
contributions plus US$ 2 million in staff costs, and UNICEF US$ 2.5 million. In addition, the programme leveraged US$ 66 million in household contributions.
The programme was implemented at a historic moment as Bangladesh moved from one phase of WASH development (increasing basic access) to another (improving levels of service, sustainability and equity). The programme was subject to an almost-unprecedented degree of monitoring and evaluation.4 It included an impact evaluation conducted at the end of the programme in 2013,
which included a detailed assessment of changes in hygiene behaviour in the programme areas.
Scope of the VFM analysis. The VFM analysis was carried out after the programme had formally ended in 2013 and covered the 6 years of implementation (2007-2013). The analysis was able to examine key cost-effectiveness indicators associated with implementation of SHEWA-B and use these to identify potential improvements in subsequent programming in rural water supply and sanitation in Bangladesh. Specifically the VFM team provided input to the design of a results framework for a new DFID-supported intervention implemented by UNICEF and the Government of Bangladesh.
3.2
WSSP – Ethiopia
Programme overview. The Water Supply and Sanitation Programme (WSSP) was a government-led programme to improve urban and rural WASH in Ethiopia. Phase 1 ran from 2004-2008 with US$ 116 million funding from the World Bank. Phase 2 was implemented between 2008 and 2013, funded by DFID with a contribution of US$ 107 million, through a trust fund arrangement with the World Bank. The latter provided an additional credit of US$ 80 million in 2010. Overall Phase 2 disbursed about US$ 198 million. In addition, the government contributed to staff and indirect programme support costs.
There were three components to WSSP, namely: i) Rural Water Supply and Sanitation, ii) Urban Water Supply and Sanitation and iii) Programme Support. The programme was designed to build the capacity of public and private stakeholders to plan, construct and maintain water supply and sanitation facilities. It aimed at building physical infrastructure such as hand-dug wells, boreholes, reticulated systems, and institutional and public latrines. The programme provided implementation support, including support for hygiene promotion. WSSP was operational in one third of woredas (districts) in Ethiopia, and provided access to improved water and sanitation to an estimated 5.1 million people in urban and rural areas.
The programme was implemented jointly by the Ministry of Water, Irrigation and Energy, the Ministry of Education and the Ministry of Health at national level and regional and woreda (i.e. district) governments at local level.
3.3
PRONASAR Common Fund (CF)
– Mozambique
Programme overview. PRONASAR (National Water Supply and Sanitation Programme) is a government-led programme to improve rural WASH in Mozambique. This annual multi-donor programme was established in 2009. Its initial objective was to provide access to improved water and sanitation facilities to 7.4 million rural inhabitants by 2015. The government of Mozambique (GoM) and development partners supported PRONASAR through two pillars. Pillar A supported specific programmes funded by different funders. Pillar B works through a Common Fund (CF) mechanism established in 2010 to pool funding from various donors. The first phase of PRONASAR Common Fund was implemented by the government between January 2010 and March 2015. By the end of 2014, US$ 60.6 million had been disbursed by donors and the GoM to the PRONASAR CF from an initial budget of US$ 65 million. DFID was the main donor to the Common Fund contributing US$ 33.9 million.5 In the first phase,
the Common Fund aimed to improve the quality and increase the coverage and sustainability of WASH services by providing hardware and software support in 15 districts in three priority provinces (Maputo, Gaza and Zambezia) for the construction of water points, the construction and rehabilitation of small piped water schemes and sanitation promotion activities. The first phase of the programme aimed to improve access to water for 537,000 people and access to sanitation for 145,000 people. It also provided technical assistance and training in all of the other provinces. A second phase has been agreed in principle and planning is currently under way.
Scope of the VFM analysis. The VFM analysis was carried out while activities were still being implemented. It focused on investments made between 2011 and 2014 through the PRONASAR Common Fund (Pillar B). It was not possible to separate out DFID’s specific contribution from other expenditure going through the Common Fund, as they are not separately tracked.
3.4
SHAWN – Nigeria
Programme overview. The Sanitation, Hygiene and Water in Nigeria (SHAWN) Programme is funded by DFID and implemented by UNICEF Nigeria. The first phase (referred to as SHAWN-I) ran from 2010 to 2013. It aimed to accelerate progress in latrine usage, adoption of improved handwashing practices and consumption of safe water for 2.3 million people. It had four main components: sanitation and hygiene promotion; water; deployment of resources at state and local government levels to enable scaling up state-wide access to WASH services; and capacity building of government staff. It initially covered 12 Local Government Authorities (LGAs), with eight more added in December 2011, making a total of 20 LGAs.
SHAWN-I disbursed about US$ 55.3 million between March 2010 and November 2013, of which US$ 45.7 million came from DFID. Co-funding came from UNICEF and the government of Nigeria. Programme funds were disbursed through UNICEF Nigeria but LGAs were in charge of implementation in an effort to increase the potential for sustainability and scale-up after the programme ends. The implementation of the second phase (referred as SHAWN-II) is currently under way (from August 2013 to November 2018) with a total budget of US$ 150 million).
Scope of the VFM analysis. The VFM analysis was carried out after the programme had formally ended in 2013. It covered the investments made during the whole duration of SHAWN-I (2010-2013) but it was not possible to track VFM variations between years. The VFM analysis focused on the first two components of the SHAWN-I programme: sanitation and hygiene on the one hand, and water on the other. The two other components were treated as indirect programme support.
3.5
Response to 2010 floods – Pakistan
Programme overview. In Pakistan, funding to address the humanitarian crisis following from the 2010 floods was analysed. Flooding started in July 2010 as a result of heavy monsoon rains in all four of the main provinces in Pakistan, and resulted in widespread inundation all along the main stem of the Indus River, and some of its tributaries. The floods affected more than 20 million people in an estimated 11,000 villages throughout Pakistan. Sindh province was hit especially hard. DFID coordinated its WASH relief efforts by supporting nine different organisations that received a combined total of more than US$ 26 million to implement WASH emergency and recovery
interventions in areas affected by floods. The type of intervention varied but included rehabilitation of water supply and sanitation infrastructure, provision of drinking water through tanker trucks and handpumps, construction of household and communal latrines, the distribution of hygiene kits and water treatment tablets, hygiene education and training of local staff.
Scope of the VFM analysis. The VFM analysis focused on activities undertaken between 2010 and 2012 in the Sindh province, which was a principal programme area for the DFID response. VFM data was collected and analysed for three NGOs active in the humanitarian response and working on WASH in Sindh, namely Care, Islamic Relief and Mercy Corps.
3.6
Zambia Sanitation and Hygiene
Programme (ZSHP) – Zambia
Programme overview. The Zambia Sanitation and Hygiene Programme (ZSHP) is a programme funded by DFID and being implemented by UNICEF-Zambia between November 2011 and March 2016. It aims to accelerate progress in latrine use and improve handwashing practices by targeting 3 million people and 500,000 school children in 1,000 schools in 67 districts. The programme is a component of Zambia’s National Rural Water Supply and Sanitation Programme (NRWSSP), and is complemented by additional investments in rural WASH by the Ministry of Local Government and Housing (MoLGH), the African Development Bank, and the Millennium Challenge Corporation, among other national and international organisations. The ZSHP is the largest programme of its kind in Zambia that focuses exclusively on rural sanitation and hygiene. The ZSHP encompasses several activities including (1) ‘Community Approaches to Total Sanitation’ (CATS), where community facilitators engage with people to end open defecation through sensitisation and collective action to build and use toilets; (2) institutional sanitation, through which appropriate sanitation facilities in schools are built, and a complementary hygiene promotion strategy and school-based management system are developed;6 (3) a communication
and hygiene promotion strategy, using both interpersonal communication and mass media; and (4) sanitation marketing.
The total programme budget is US$ 32 million, of which US$ 21 million have been spent up to the end of 2014. DFID is contributing a total of US$ 29 million over the life of the programme. For implementation, UNICEF has partnered with nine NGOs (Afya Mzuri, Akros, CIDRZ, Plan International, SNV, Varen, Village Water, WaterAid and World Vision), which act as facilitators at the district level.
Scope of the VFM analysis. The VFM analysis was carried out while the programme was still being implemented. It covers the period from 2012 to 2014 and focusses on CATS and institutional sanitation, as these are the main programme components.7
6 Sanitation facilities for schools are gender-segregated (with a ratio of 50 children per latrine) and have a handwashing facility nearby (with water and cleansing agents available) that allow more than one child to wash their hands at the same time. At least one sanitation facility is also equipped with hand bars for disabled children.
4
Summary of key findings from
the VFM analysis
This section presents key results of the VFM analysis of the programmes under review, presented by type of programme component (access to water, sanitation promotion, hygiene promotion, etc.). It draws out illustrative results based on the five key dimensions of VFM (economy, efficiency, cost-efficiency, effectiveness and cost-effectiveness).
The purpose of this section is to illustrate the type of information that has emerged from the analysis conducted during the project and to set out how such findings can be relevant for programme managers and funders. This section is based on detailed analysis done at country level, which has been captured in programme-level reports available at www.vfm-wash.org. Sections 4 and 5 go further in extracting learning points from the project, particularly in terms of how VFM analysis can support management decisions (Section 4) and what the implications are in terms of improving the functioning of monitoring systems (Section 5).
Results are presented here by main programmatic components (i.e. water, sanitation, hygiene promotion and WASH in schools) so as to facilitate understanding within a particular area of activity. However, there are important interactions between components in most programmes which also need to be taken into consideration when looking at the results and seeking to assess the VFM of an overall programme. Some expenditure, such as social mobilisation, often contributes to both water and sanitation and/or sanitation and hygiene components.
VFM indicators calculated for each programme are presented at the beginning of each section. They are not intended to be compared across countries for a number of reasons: they were calculated for different years, outputs may not be exactly identical and costs vary according to location and to the programme implementation status.8 Such comparisons are more relevant when they are carried out
within the same country (comparisons between programme modalities and implementers) or within the same programme across the years. However, international comparisons can be drawn in terms of efficiency, effectiveness or in terms of cost breakdown between international programmes. In order to allow comparability across countries, VFM indicators were calculated using the actual expenditure associated with each result in local currency. These figures were then converted into US$ using official exchange rates from the World Bank database.9
4.1
Water supply at household level
Five programmes conducted activities related to the provision of water supply at household level. By contrast, the ZSHP in Zambia focused exclusively on sanitation and hygiene.
These activities mostly consisted of constructing or rehabilitating water points, mainly in rural areas. PRONASAR CF in Mozambique also built small piped schemes in small towns and WSSP in Ethiopia built water supply systems in small, medium and large sized towns. In the majority of cases, the programmes funded public water points, except in the case of Bangladesh, where households also invested in private water supply solutions following social mobilisation activities funded by the programme.
Water services were provided through a variety of technological solutions, including:
• Springs and hand-dug wells,
• Shallow and deep tubewells or boreholes fitted with handpumps or motorised pumps, and
8 The summary tables of VFM indicators do not present the nuanced detail and analysis underlying these figures, for reasons of space. The detail can be seen in the full country reports which are available at www.vfm-wash.org. Variation in data availability and quality means that indicators are not usually directly comparable between countries.
• Piped network systems (the latter are referred to as Small Water Supply Systems (SWSS) in Mozambique and rural piped schemes (RPS) in Ethiopia).
These investments were carried out in a range of hydrogeological contexts, including deep and shallow groundwater, and with a range of water quality constraints, including the presence of arsenic in groundwater supplies in Bangladesh.
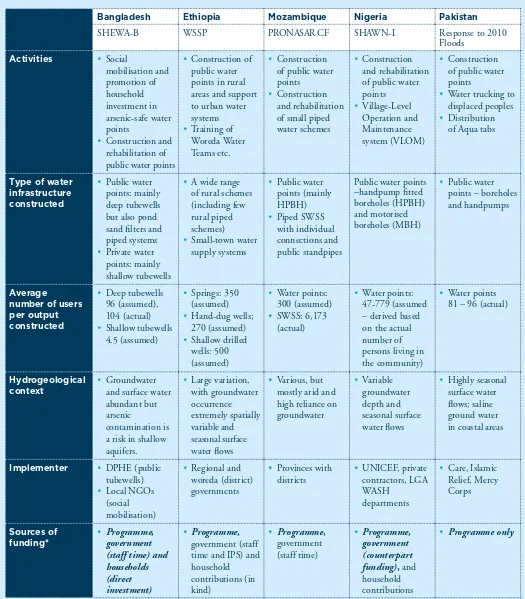
[image:21.595.46.571.162.761.2]Table 3 below presents in more detail the main characteristics of the water activities for each of the programmes under review.
Table 3. Water supply activities – programmes’ characteristics
Bangladesh Ethiopia Mozambique Nigeria Pakistan
SHEWA-B WSSP PRONASAR CF SHAWN-I Response to 2010
Floods
Activities • Social
mobilisation and promotion of household investment in arsenic-safe water points
• Construction and rehabilitation of public water points
• Construction of public water points in rural areas and support to urban water systems
• Training of Woreda Water Teams etc.
• Construction of public water points
• Construction and rehabilitation of small piped water schemes
• Construction and rehabilitation of public water points
• Village-Level Operation and Maintenance system (VLOM)
• Construction of public water points
• Water trucking to displaced peoples
• Distribution of Aqua tabs
Type of water infrastructure constructed
• Public water points: mainly deep tubewells but also pond sand filters and piped systems
• Private water points: mainly shallow tubewells
• A wide range of rural schemes (including few rural piped schemes)
• Small-town water supply systems
• Public water points (mainly HPBH)
• Piped SWSS with individual connections and public standpipes
Public water points –handpump fitted boreholes (HPBH) and motorised boreholes (MBH)
• Public water points – boreholes and handpumps
Average number of users per output constructed
• Deep tubewells 96 (assumed), 104 (actual)
• Shallow tubewells 4.5 (assumed)
• Springs: 350 (assumed)
• Hand-dug wells; 270 (assumed)
• Shallow drilled wells: 500 (assumed)
• Water points: 300 (assumed)
• SWSS: 6,173 (actual)
• Water points: 47-779 (assumed – derived based on the actual number of persons living in the community)
• Water points 81 – 96 (actual)
Hydrogeological
context • Groundwater and surface water abundant but arsenic
contamination is a risk in shallow aquifers.
• Large variation, with groundwater occurrence extremely spatially variable and seasonal surface water flows
• Various, but mostly arid and high reliance on groundwater
• Variable groundwater depth and seasonal surface water flows
• Highly seasonal surface water flows; saline ground water in coastal areas
Implementer • DPHE (public tubewells)
• Local NGOs (social mobilisation)
• Regional and woreda (district) governments
• Provinces with districts
• UNICEF, private contractors, LGA WASH
departments
• Care, Islamic Relief, Mercy Corps
Sources of
funding* • Programme, government (staff time) and households (direct investment)
• Programme,
government (staff time and IPS) and household contributions (in kind)
• Programme,
government (staff time)
• Programme, government (counterpart funding), and
household contributions
• Programme only
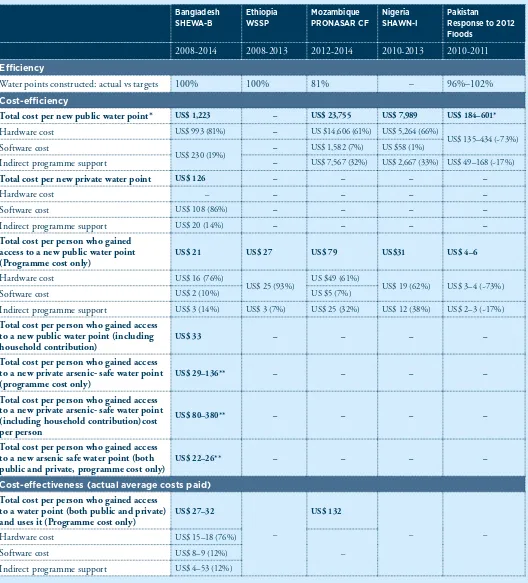
Table 4 below presents the main VFM indicators calculated for water supply activities.
Table 4. Summary of VFM indicators for water supply activities
(*) The types of public water points varied widely, ranging from tubewells/boreholes in Mozambique and Nigeria and a range of technologies including a few piped schemes in Bangladesh and Ethiopia. (**) Due to uncertainty about the prevalence of arsenic in private water points, the costs per person gaining access to arsenic-safe water can only be expressed as a range.
Bangladesh SHEWA-B
Ethiopia WSSP
Mozambique PRONASAR CF
Nigeria SHAWN-I
Pakistan
Response to 2012 Floods
2008-2014 2008-2013 2012-2014 2010-2013 2010-2011 Efficiency
Water points constructed: actual vs targets 100% 100% 81% – 96%–102%
Cost-efficiency
Total cost per new public water point* US$ 1,223 – US$ 23,755 US$ 7,989 US$ 184–601*
Hardware cost US$ 993 (81%) – US $14,606 (61%) US$ 5,264 (66%)
US$ 135–434 (~73%) Software cost
US$ 230 (19%) – US$ 1,582 (7%) US $58 (1%)
Indirect programme support – US$ 7,567 (32%) US$ 2,667 (33%) US$ 49–168 (~17%)
Total cost per new private water point US$ 126 – – – –
Hardware cost – – – – –
Software cost US$ 108 (86%) – – – –
Indirect programme support US$ 20 (14%) – – – –
Total cost per person who gained access to a new public water point (Programme cost only)
US$ 21 US$ 27 US$ 79 US$31 US$ 4–6
Hardware cost US$ 16 (76%)
US$ 25 (93%) US $49 (61%) US$ 19 (62%) US$ 3–4 (~73%)
Software cost US$ 2 (10%) US $5 (7%)
Indirect programme support US$ 3 (14%) US$ 3 (7%) US$ 25 (32%) US$ 12 (38%) US$ 2–3 (~17%)
Total cost per person who gained access to a new public water point (including household contribution)
US$ 33 – – – –
Total cost per person who gained access to a new private arsenic- safe water point (programme cost only)
US$ 29–136** – – – –
Total cost per person who gained access to a new private arsenic- safe water point (including household contribution)cost per person
US$ 80–380** – – – –
Total cost per person who gained access to a new arsenic safe water point (both public and private, programme cost only)
US$ 22–26** – – – –
Cost-effectiveness (actual average costs paid)
Total cost per person who gained access to a water point (both public and private) and uses it (Programme cost only)
US$ 27–32
–
US$ 132
– –
Hardware cost US$ 15–18 (76%)
–
Software cost US$ 8–9 (12%)
4.1.1 Economy
For water supply, “economy” assesses whether inputs, including physical supplies for water point construction (e.g. cement or handpumps) and staff inputs, were purchased at the appropriate quality and at the right price. However, only two programmes – both implemented by UNICEF – comprehensively monitored the costs of water construction contracts: namely SHAWN-I in Nigeria and SHEWA-B in Bangladesh, as outlined in Box 1 and Box 2 below. For the remaining three programmes, qualitative information was used to assess the economy dimension of VFM at the level of input costs. For example, in Ethiopia, we found that there was high inflation during the programme (23% on average annually), causing dramatic increases in construction and labour costs and requiring an additional IDA credit in 2010, but no qualitative data was available to assess the specific impact on programme costs.
Whilst installing a handpump-fitted borehole (HPBH) appears roughly twice as expensive in Nigeria than in Bangladesh, it is important to note that these figures are taken from different contexts. Handpumps are cheaper in Bangladesh as they are manufactured locally, whereas in most African countries they are imported.
Box 1. Cost of water point construction contracts in Bangladesh (SHEWA-B)
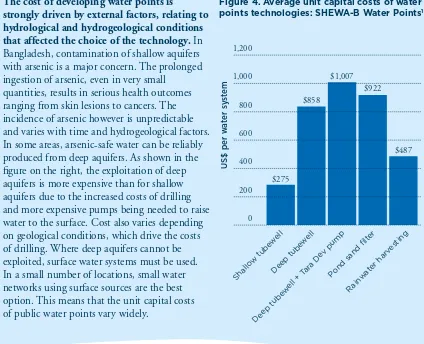
The cost of developing water points is
strongly driven by external factors, relating to hydrological and hydrogeological conditions that affected the choice of the technology. In
Bangladesh, contamination of shallow aquifers with arsenic is a major concern. The prolonged ingestion of arsenic, even in very small
[image:23.595.139.563.283.627.2]quantities, results in serious health outcomes ranging from skin lesions to cancers. The incidence of arsenic however is unpredictable and varies with time and hydrogeological factors. In some areas, arsenic-safe water can be reliably produced from deep aquifers. As shown in the figure on the right, the exploitation of deep aquifers is more expensive than for shallow aquifers due to the increased costs of drilling and more expensive pumps being needed to raise water to the surface. Cost also varies depending on geological conditions, which drive the costs of drilling. Where deep aquifers cannot be exploited, surface water systems must be used. In a small number of locations, small water networks using surface sources are the best option. This means that the unit capital costs of public water points vary widely.
Figure 4. Average unit capital costs of water points technologies: SHEWA-B Water Points10
1,200 $275 $858 $1,007 $922 $487 1,000 800 600 400 200 0 Shallo w tube well
US$ per w
at er s ys tem Deep tube well Deep tube well + T
ara De v pump
Pond sand filt er
Rain water harv
esting
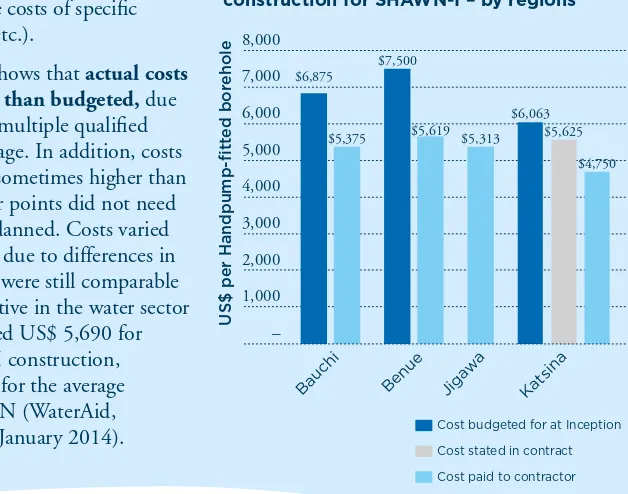
Box 2. Costs of water point construction contracts in Nigeria (SHAWN-I)
SHAWN-I monitored the total costs of water point drilling based on construction contracts (but did not monitor the costs of specific inputs, such as cement, etc.).
The figure on the right shows that actual costs
were consistently lower than budgeted, due
to competition between multiple qualified contractors at bidding stage. In addition, costs stated in contracts were sometimes higher than those paid, because water points did not need to be drilled as deep as planned. Costs varied slightly between regions, due to differences in drilling depths, but they were still comparable to other organisations active in the water sector in Nigeria. WaterAid cited US$ 5,690 for hardware costs of HPBH construction, compared to US$ 5,264 for the average contractor under SHAWN (WaterAid,
[image:24.595.142.456.86.333.2]personal communication, January 2014).
Figure 5. Budgeted and actual costs for Handpump-fitted borehole (HPBH) construction for SHAWN-I – by regions
8,000
$6,875
$5,375 $7,500
$5,619 $5,313 $6,063$5,625
$4,750 7,000 6,000 5,000 4,000 3,000 2,000 Bauchi
US$ per Handpump-fitt
ed bor
ehole
Benue Jigawa Katsina
1,000
–
Cost budgeted for at Inception Cost stated in contract Cost paid to contractor
4.1.2 Efficiency and cost-efficiency
Efficiency. Assuming that plans and budgets have been appropriately drawn up (i.e. that they reflect realistic and sufficiently ambitious objectives) and expenditure is in line with budgets, meeting planned targets can be used as a proxy indicator of efficiency. In four out of five programmes with a water component, data on the number of water points planned and constructed was available. The realisation rate for water point construction ranged between 80% and 100%, with programmes in Ethiopia and Pakistan performing well (around 100%) and Mozambique less well (81%). Variations in achievement rates were affected by several factors:
• Contracting and funding delays – In Mozambique, disbursement of funds to PRONASAR CF has been unpredictable, slow and often late. This led to delays in the contracting of construction companies and thus in output realisation. In Nigeria, delays in contracting resulted from delays in securing government counterpart funding. In Ethiopia, implementers received budget allocations late from higher levels of administration (regions from MoFED and woredas from regions), which resulted in procurement delays and a mismatch between funding availability and appropriate timing for construction. Budgets were received just before the rainy season, when water points cannot be constructed.
• Changes in pre-conditions for water provision – In Nigeria, realisation rates for water point construction were initially low because water points could only be constructed in ODF villages (and achieving ODF status can take time). When this pre-condition was lifted half way through the programme, the number of water points constructed per year increased. Whereas no water points had been constructed prior to January 2012, 627 water points had been constructed by September 2012 and 3,808 by December 2013.
• Technical drilling issues – In Mozambique, the realisation rate for water points dropped to 73% in 2013 but improved over time (81% on average throughout the life of the programme). Technical difficulties were encountered with drilling, due to complex hydrogeological conditions, which required a change in technology.
part because public tubewells can be drilled to deeper depths where the aquifer is less affected by arsenic. There was some uncertainty about the prevalence of arsenic in private tubewells constructed by the programme, which means that efficiency rates could only be estimated within a range between lower- and upper-bound estimates for rates of arsenic using data on arsenic contamination from a survey in SHEWA-B communities (between 0.3% and 79%).
• Other external factors – In Mozambique, flooding of the Zambezi River and political turmoil in 2013 affected delivery of outputs. The realisation rate of water point construction dropped from 77% in 2012 to 72% in 2013, but then increased to 93% in 2014.
Cost-efficiency. The average total cost for providing access to a new public water point, over the life of each programme, ranged between US$ 4-6 per person in Pakistan to US$ 79 per person in Mozambique for a range of water point technologies and it averaged US$ 194 per person gaining access to a small piped scheme in Mozambique. These costs included the costs of construction contracts, supervision contracts, community mobilisation and indirect programme support (IPS). Yet, it is important to note that it was not possible to include all IPS costs for all programmes (in particular, it was difficult to precisely estimate the value of IPS costs borne by the government). Thus, IPS is likely to be under-estimated in Ethiopia and Mozambique, but to be overestimated in Nigeria. Values also include households’ contributions for Bangladesh, but not for Nigeria, Mozambique and Ethiopia as the latter could not be estimated in those cases (often because in-kind or cash contributions recommended by the programmes could not be monitored and probably were not made in reality, or were only made to cover O&M costs, as in Ethiopia and Mozambique). It is important to note that cost-efficiency indicators are not intended to be directly compared between programmes, as costs vary depending on the type of technology, hydrological and socio-political context, as explained in the section above on economy.
The cost per person who gained access to a new water point can greatly vary depending on the method used for evaluating the number of users per water point. It was only in Bangladesh and Pakistan that beneficiary numbers were based on household survey data from baseline and endline surveys, whereas in Ethiopia, Mozambique and Nigeria the number of users per water point was assumed based on infrastructure types or the number of people living in a service area. If assumptions regarding the number of beneficiaries per water point change, as happened in Mozambique and Nigeria during the life of the programmes under review, this can drastically improve or worsen the cost-efficiency per person over time, without any real change in actual service levels.
The cost-efficiency of building water points is affected by contracting conditions. In Nigeria, Ethiopia, Bangladesh and Mozambique a performance-based contract was used that specified that contractors were only paid when a tubewell/borehole yields water (i.e. the contractor hits the aquifer). This arrangement may have resulted in an efficient translation of inputs into outputs. However, the impact on cost of water points cannot be assessed as the additional expenditure for drilling unsuccessful tubewell/borehole would be borne by the contractors rather than the programme, but would likely result in higher prices per tubewell/borehole as contractors build in the risk. Alternatively, the contractor could be paid when the water point continues to yield water over time.
Collecting annual cost efficiency data for a specific programme allows monitoring of VFM trends overtime. It was only in Mozambique that sufficient data was available to estimate annual cost-efficiency indicators and therefore, track variations in cost-cost-efficiency.13 Here, we found that the
cost per person decreased over time (see Box 3 over the page). These figures make a strong case for demonstrating the improvements of PRONASAR CF’s performance over time.
11 This is because in Nigeria it was not possible to attribute general capacity building initiatives to specific components and therefore, to exclude IPS costs that should have been allocated to activities out of the scope of VFM analysis. 12 In Nigeria, households were required to match 3-5% of donor funding for hardware costs and were encouraged to put aside 2.5% of hardware costs as a fund for operation and maintenance (O&M) – though data was not available on how much of this was secured.
$11,817
30,000
$26,693
$21,303
$17,595
25,000
20,000
15,000
10,000
2011
US$ per output
2012 2013 2014
5,000
0
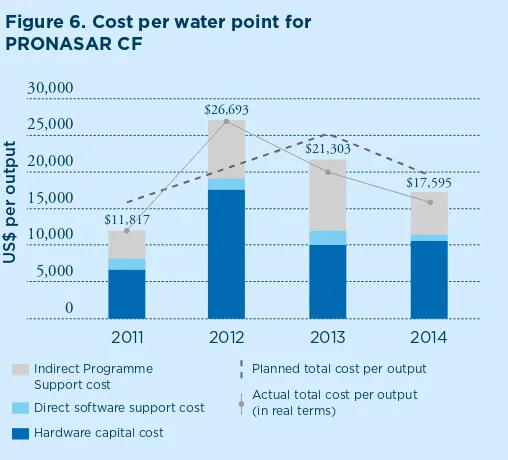
Box 3. Annual variations in cost per water point for PRONASAR CF – Mozambique
The analysis found that the average cost per water point constructed (estimated over a one-year period) decreased by 35% between 2012 and 2014,
mainly due to a reduction in the cost of hardware.14 This could
[image:26.595.215.469.53.283.2]be explained by improvements in procurement performance, a change in the characteristics of outputs (depth of boreholes) or by use of lower cost technology.
Figure 6. Cost per water point for PRONASAR CF
Indirect Programme Support cost
Planned total cost per output
Direct software support cost Actual total cost per output (in real terms) Hardware capital cost
Source: Estimates by authors from PRONASAR PIA and Relatorio Balanço data for 2012 to 2014
4.1.3 Effectiveness and cost-effectiveness
Effectiveness and cost-effectiveness assess how water point construction translates into people having sustained access to water and actually using the water source. A key difference with measuring efficiency and cost-efficiency is that these indicators take account of the actual number of people using a facility, preferably after a few years of service, as opposed to an assumed number of people at the time of construction. However, getting these numbers requires having access to robust monitoring data. Only the SHEWA-B programme in Bangladesh collected data on the actual number of beneficiaries using water points at the end of the programme.
Effectiveness of water point construction can be affected by a number of factors:
• Water points continuing to function overtime, which depends on adequate maintenance (including spare part availability) and hydrological factors (affecting water availability and quality);
• Water points being effectively used by local users over time.
Effectiveness needs to be monitored in terms of marginal changes over baseline conditions. In Bangladesh, baseline water access in the programme intervention areas was high, so although new water points were built, this may not have resulted in people moving from using ‘unimproved’ to ‘improved’ sources. Instead, it may have improved service levels (e.g. by improving accessibility, reliability and predictability of access and reducing times for water collection) for households that were already using ‘improved’ sources (see Box 4 opposite).