Absenteeism from primary schools, 2014/15
This annual Statistical First Release reports on absenteeism by pupils of compulsory school age in maintained primary schools, and pupils aged 5 to 10 in maintained middle, special and independent schools in Wales. Information relates to the entire academic year, from 2005/06 to 2014/15.
Chart 1: Absenteeism by pupils of compulsory school age, 2005/06 to 2014/15
0.0 1.0 2.0 3.0 4.0 5.0 6.0 7.0 8.0
2006 2007 2008 2009 2010 2011 2012 2013 2014 2015
R at e o f a b s e n te ei sm (p er c e nt ) Unauthorised absence Overall absence
Persistent absenteeism
(Table 8)Other key points
(Tables 8 and 10)SDR 198/2015 1 December 2015
Statistician: Stephen Hughes Tel: 029 2082 3599 E-mail: [email protected]
Next update: December 2016 (provisional)
Twitter: www.twitter.com/statisticswales | www.twitter.com/ystadegaucymru Just under 1 in 70 pupils
were persistent absentees in primary schools (or 1.4%).
5.1%
overall absence from primary schools.1.0%
unauthorised absence from primary schools.After increasing in 2012/13, overall absenteeism
continues to fall.
Unauthorised absence did not change between 2013/14 and 2014/15.
A decrease in agreed family holidays in 2014/15 contributed towards the decrease in overall absence.
Contents
PageChange in absenteeism over time, by school type
Chart 1 Absenteeism by pupils of compulsory school age, 2005/06 to 2014/15 1 Table 1 Overall absenteeism by pupils of compulsory school age, by sector 4 Table 2 Unauthorised absenteeism by pupils of compulsory school age, by sector 4
Change in absenteeism over time, by gender
Table 3 Absenteeism by pupils of compulsory school age in all schools, by gender 5
Absenteeism and free school meal entitlement comparison
Table 4 Absenteeism by pupils of compulsory school age in all mainstream primary schools, by proportion entitled to free school meals, 2014/15
6
Chart 2 Overall absenteeism by pupils of compulsory school age, by maintained primary
school and free school meal percentage, 2014/15 6
Local authority and consortium analysis of absenteeism
Table 5 Absenteeism by pupils of compulsory school age in all mainstream primary and special schools, by local authority and consortium
7
Chart 3 Range of local authorities’ rates of overall absenteeism by pupils of compulsory school age
8
Chart 4 Range of local authorities’ rates of unauthorised absenteeism by pupils of
compulsory school age 9
Chart 5 Overall absenteeism by pupils of compulsory school age in all maintained primary
and special schools, by local authority, 2014/15 10
Chart 6 Unauthorised absenteeism by pupils of compulsory school age in all maintained primary and special schools, by local authority, 2014/15
11
Map 1 Overall absenteeism by pupils of compulsory school age from maintained primary and special schools, 2014/15
12
Map 2 Unauthorised absenteeism by pupils of compulsory school age from maintained primary and special schools, 2014/15
13
Number of pupils, by length of absence
Table 6 Distribution of pupils in maintained primary schools by length of overall absence, 2014/15
14
Table 7 Distribution of pupils in maintained primary schools by their overall absence rates,
2014/15 14
Chart 7 Distribution of pupils in maintained primary schools by length of overall absence 15
Persistent absentees
Table 8 Pupils of compulsory school age who were persistent absentees from maintained
primary schools 16
Change in absenteeism over time, by reason for absence
Table 9 Distribution of reasons for absence by pupils of compulsory school age in mainstream primary and middle schools, by reason for absence
17
Table 10 Percentage of sessions missed by pupils of compulsory school age in mainstream primary and middle schools, by reason for absence
18
Introduction
Tables 1 to 7 break down the percentage of half-day sessions missed due to absenteeism by school type, gender, local authority, free school meal entitlement, etc. Table 8 shows the number of pupils who are considered persistent absentees (a definition of persistent absenteeism can be found in the Notes section). Tables 9 and 10 report on the reasons for absence from 2011/12 to 2014/15.
Chart 1 displays the percentage of half-day sessions missed due to overall and unauthorised absenteeism from maintained primary, special and independent schools from 2005/06. Chart 2 plots schools’ free school meal entitlement against their overall absenteeism rates to shows the correlation between the two types of data. Charts 3 and 4 show how the ranges in local authority absence rates have changed over time. Charts 5and 6 order local authorities by their overall and unauthorised absenteeism rates, showing how local authorities compare with each other. Chart 7 groups pupils by their rates of absence and shows how these groups have changed over time. Chart 8 displays the same data as Chart 1, but provides additional information that help to put the changes in absence rates into context.
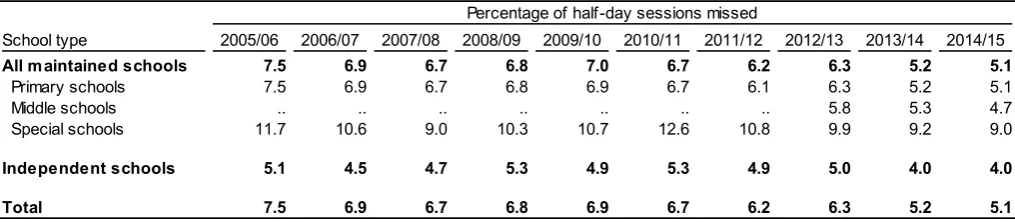
Table 1: Overall absenteeism by pupils of compulsory school age, by sector (a)
Percentage of half-day sessions missed
School type 2005/06 2006/07 2007/08 2008/09 2009/10 2010/11 2011/12 2012/13 2013/14 2014/15
All maintained schools 7.5 6.9 6.7 6.8 7.0 6.7 6.2 6.3 5.2 5.1
Primary schools 7.5 6.9 6.7 6.8 6.9 6.7 6.1 6.3 5.2 5.1
Middle schools .. .. .. .. .. .. .. 5.8 5.3 4.7
Special schools 11.7 10.6 9.0 10.3 10.7 12.6 10.8 9.9 9.2 9.0
Independent schools 5.1 4.5 4.7 5.3 4.9 5.3 4.9 5.0 4.0 4.0
Total 7.5 6.9 6.7 6.8 6.9 6.7 6.2 6.3 5.2 5.1
[image:4.595.42.553.295.403.2]Source: Pupils' Attendance Record, Welsh Government (a) Figures do not include data for 7 independent schools that did not respond to the survey.
Table 2: Unauthorised absenteeism by pupils of compulsory school age, by sector (a)
Percentage of half-day sessions missed
School type 2005/06 2006/07 2007/08 2008/09 2009/10 2010/11 2011/12 2012/13 2013/14 2014/15
All maintained schools 1.0 0.9 0.9 1.0 1.0 0.9 0.8 0.9 1.0 1.0
Primary schools 1.0 0.9 0.9 1.0 1.0 0.9 0.8 0.9 1.0 1.0
Middle schools .. .. .. .. .. .. .. 0.6 0.9 0.9
Special schools 0.9 1.2 0.9 1.0 1.2 1.3 0.9 0.6 1.1 0.8
Independent schools 0.1 0.1 0.1 0.2 0.1 0.2 0.1 0.2 0.1 0.1
Total 1.0 0.9 0.9 1.0 1.0 0.9 0.7 0.9 1.0 1.0
Source: Pupils' Attendance Record, Welsh Government (a) Figures do not include data for 7 independent schools that did not respond to the survey.
Overall absence continued to decrease in 2014/15. The rate of overall absence (which includes both authorised and unauthorised absences) from maintained primary, special and independent schools rose in 2012/13, mainly due to illness. In the two years since that peak, the rate of overall absence decreased.
While the rate of overall absence decreased in primary schools, the rate of unauthorised absence remained the same. In 2011/12 the percentage of half-day sessions missed due to unauthorised absence from all primary schools reached its lowest point in the past 10 years. By 2013/14 this figure had risen to 1.0 per cent, and in 2014/15 it did not change.
The reasons behind the decrease in overall absence from maintained primary and middle schools are shown in Tables 9and 10.
In 2014/15:
5.1%
overall absence from primary schools.1.0%
unauthorised absence from primary schools.Overall absence continues to fall, following a rise in 2012/13.
Unauthorised absence stayed the same as in 2013/14.
highest rate seen over the past 10 years was 1.0 per cent. The rate of unauthorised absence stayed at that value in 2014/15.
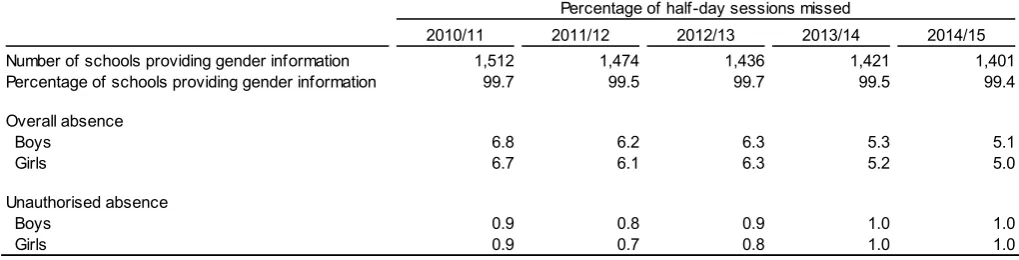
Table 3: Absenteeism by pupils of compulsory school age in all schools, by gender (a)
Percentage of half-day sessions missed
2010/11 2011/12 2012/13 2013/14 2014/15
Number of schools providing gender information 1,512 1,474 1,436 1,421 1,401
Percentage of schools providing gender information 99.7 99.5 99.7 99.5 99.4
Overall absence
Boys 6.8 6.2 6.3 5.3 5.1
Girls 6.7 6.1 6.3 5.2 5.0
Unauthorised absence
Boys 0.9 0.8 0.9 1.0 1.0
Girls 0.9 0.7 0.8 1.0 1.0
Source: Pupils' Attendance Record, Welsh Government (a) Caution should be taken w hen comparing year on year changes for data on absenteeism by gender. Although it became compulsory for
(a) maintained schools to provide gender information in 2007/08, it remains voluntary for special and independent schools, so different
(a) numbers of schools provide this information each year.
Boys had a slightly higher rate of overall absence than girls in 2014/15. This has been the case over the past 5 years except during 2012/13 when boys and girls had the same rate of overall absence. Boys and girls had the same rate of unauthorised absence from maintained primary, special and
independent schools in 2014/15.
In 2014/15:
Overall absence was slightly higher for boys than girls. Boys and girls had the same rate of unauthorised absence.
Table 4: Absenteeism by pupils of compulsory school age in all mainstream primary
schools, by proportion entitled to free school meals, 2014/15 (a)
Percentage of half-day sessions missed
Percentage entitled to free school meals Overall absence Unauthorised absence Number of schools
8% or less 3.9 0.6 312
16% or less, but over 8% 4.6 0.7 344
24% or less, but over 16% 5.2 1.0 246
32% or less, but over 24% 5.6 1.2 201
over 32% 6.2 1.7 239
All maintained primary schools 5.0 1.0 1,342
Source: Pupils' Attendance Record and PLASC, Welsh Government (a) Free school meal data are based on a three year average.
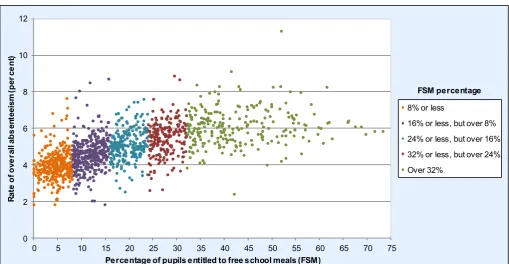
Table 4 suggests that there is a relationship between the proportion of pupils entitled to free school meals and the rate of absenteeism. It suggests that in general schools with a higher proportion of pupils entitled to free school meals have higher absenteeism rates.
It may be easier to spot this pattern in Chart 2. Each of the dots on this chart represents 1 of the 1,342 mainstream primary schools that submitted attendance data to the Welsh Government in 2014/15. The schools’ rates of overall absenteeism have been plotted against the percentage of their pupils entitled to free school meals.
The pattern formed by the schools’ dots in Chart 2 looks like an upward slope. The chart shows that schools with similar percentages of pupils entitled to free school meals can have very different rates of overall absence. But the upward slope pattern suggests that schools with a higher percentage of pupils entitled to free school meals in general have higher absence rates.
Chart 2: Overall absenteeism by pupils of compulsory school age, by maintained primary
school and free school meal percentage, 2014/15
0 2 4 6 8 10 12
0 5 10 15 20 25 30 35 40 45 50 55 60 65 70 75
R at e o f o ve ra ll ab s en te ei sm (p er c e n t)
Percentage of pupils entitled to free school meals (FSM)
8% or less
16% or less, but over 8% 24% or less, but over 16% 32% or less, but over 24% Over 32%
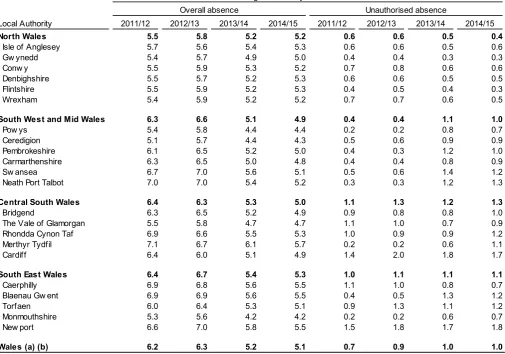
[image:6.595.43.553.454.718.2]Table 5: Absenteeism by pupils of compulsory school age in all mainstream primary and
special schools, by local authority and consortium
Percentage of half-day sessions missed due to:
Overall absence Unauthorised absence
Local Authority 2011/12 2012/13 2013/14 2014/15 2011/12 2012/13 2013/14 2014/15
North Wales 5.5 5.8 5.2 5.2 0.6 0.6 0.5 0.4
Isle of Anglesey 5.7 5.6 5.4 5.3 0.6 0.6 0.5 0.6
Gw ynedd 5.4 5.7 4.9 5.0 0.4 0.4 0.3 0.3
Conw y 5.5 5.9 5.3 5.2 0.7 0.8 0.6 0.6
Denbighshire 5.5 5.7 5.2 5.3 0.6 0.6 0.5 0.5
Flintshire 5.5 5.9 5.2 5.3 0.4 0.5 0.4 0.3
Wrexham 5.4 5.9 5.2 5.2 0.7 0.7 0.6 0.5
South West and Mid Wales 6.3 6.6 5.1 4.9 0.4 0.4 1.1 1.0
Pow ys 5.4 5.8 4.4 4.4 0.2 0.2 0.8 0.7
Ceredigion 5.1 5.7 4.4 4.3 0.5 0.6 0.9 0.9
Pembrokeshire 6.1 6.5 5.2 5.0 0.4 0.3 1.2 1.0
Carmarthenshire 6.3 6.5 5.0 4.8 0.4 0.4 0.8 0.9
Sw ansea 6.7 7.0 5.6 5.1 0.5 0.6 1.4 1.2
Neath Port Talbot 7.0 7.0 5.4 5.2 0.3 0.3 1.2 1.3
Central South Wales 6.4 6.3 5.3 5.0 1.1 1.3 1.2 1.3
Bridgend 6.3 6.5 5.2 4.9 0.9 0.8 0.8 1.0
The Vale of Glamorgan 5.5 5.8 4.7 4.7 1.1 1.0 0.7 0.9
Rhondda Cynon Taf 6.9 6.6 5.5 5.3 1.0 0.9 0.9 1.2
Merthyr Tydfil 7.1 6.7 6.1 5.7 0.2 0.2 0.6 1.1
Cardiff 6.4 6.0 5.1 4.9 1.4 2.0 1.8 1.7
South East Wales 6.4 6.7 5.4 5.3 1.0 1.1 1.1 1.1
Caerphilly 6.9 6.8 5.6 5.5 1.1 1.0 0.8 0.7
Blaenau Gw ent 6.9 6.9 5.6 5.5 0.4 0.5 1.3 1.2
Torfaen 6.0 6.4 5.3 5.1 0.9 1.3 1.1 1.2
Monmouthshire 5.3 5.6 4.2 4.2 0.2 0.2 0.6 0.7
New port 6.6 7.0 5.8 5.5 1.5 1.8 1.7 1.8
Wales (a) (b) 6.2 6.3 5.2 5.1 0.7 0.9 1.0 1.0
Source: Pupils' Attendance Record, Welsh Government (a) Includes independent schools.
(b) Figures do not include data for 7 independent schools that did not respond to the survey.
Merthyr Tydfil had the highest rate of overall absenteeism from primary schools in 2014/15 (5.7 per cent of half-day sessions missed). Out of all consortia, South East Wales had the highest rate of overall absence in 2014/15.
Monmouthshire had the lowest rate of overall absenteeism in 2014/15 (4.2 per cent) even though it is in the consortium with the highest rate of overall absence – South East Wales.
The lowest rate of unauthorised absenteeism from primary schools in 2014/15 was seen in Gwynedd and Flintshire (0.3 per cent). Newport had the highest rate of unauthorised absence (1.8 per cent).
In 2014/15, for local authorities: Overall absence
5.7%
the highest rate of overall absence.4.2%
the lowest rate of overall absence.Unauthorised absence
1.8%
the highest unauthorised absence rate.0.3%
the lowest unauthorised absence rate.Chart 3: Range of local authorities’ rates of overall absenteeism by pupils of compulsory
school age
Chart 3 shows how the range of overall absence rates at the local authority level has changed over time and can be used in conjunction with the ‘Overall absence’ columns in Table 5. For each year the top of the blue band shows the highest local authority’s absence and the bottom of the blue band shows the lowest local authority’s absence. The dark blue line within this band is the average overall absence rate for Wales.
0 1 2 3 4 5 6 7 8 9
2006 2007 2008 2009 2010 2011 2012 2013 2014 2015
R
at
e
o
f a
b
s
e
n
te
eis
m
(p
er
c
e
nt
)
Range of overall absence
Overall absence (average for Wales)
The highest rate of overall absenteeism in local authorities decreased again in 2014/15. It is at its lowest value in the past 10 years. This can be seen by the fact that the top of the blue band is the lowest it has been since 2005/06.
Although the lowest rate of overall absence did not change in 2014/15, it is still the lowest it has been in the past 10 years.
The highest rate of overall absenteeism at the local authority level has been falling since it last peaked in 2008/09. The lowest rate, on the other hand, has fluctuated since then.
In 2014/15:
The highest rate of overall absence amongst LAs fell.
Chart 4: Range of local authorities’ rates of unauthorised absenteeism by pupils of
compulsory school age
Chart 4 shows how the range of unauthorised absence rates at the local authority level has changed over time and can be used in conjunction with the ‘Unauthorised absence’ columns in Table 5. For each year the top of the blue band shows the highest local authority’s absence and the bottom of the blue band shows the lowest local authority’s absence. The dark blue line within this band is the average unauthorised absence rate for Wales.
0 1 2 3 4 5 6 7 8 9
2006 2007 2008 2009 2010 2011 2012 2013 2014 2015
R
at
e
o
f a
b
s
e
n
te
eis
m
(p
er
c
e
nt
) Range of unauthorised absence
Unauthorised absence (average for Wales)
Chart 5: Overall absenteeism by pupils of compulsory school age in all maintained
primary and special schools, by local authority, 2014/15
5.7 5.5 5.5 5.5 5.3 5.3 5.3 5.3 5.2 5.2 5.2 5.1 5.1 5.0 5.0 4.9 4.9 4.8 4.7 4.4 4.3 4.2
0.0 1.0 2.0 3.0 4.0 5.0 6.0 7.0 8.0
Merthyr Tydfil Newport Caerphilly Blaenau Gwent Flintshire Denbighshire Isle of Anglesey Rhondda Cynon Taf Wrexham Neath Port Talbot Conwy Swansea Torfaen Pembrokeshire Gwynedd Bridgend Cardiff Carmarthenshire The Vale of Glamorgan Powys Ceredigion Monmouthshire
Rate of overall absenteeism (per cent)
Chart 6: Unauthorised absenteeism by pupils of compulsory school age in all maintained
primary and special schools, by local authority, 2014/15
1.8 1.7 1.3 1.2 1.2 1.2 1.2 1.1 1.0 1.0 0.9 0.9 0.9 0.7 0.7 0.7 0.6 0.6 0.5 0.5 0.3 0.3
0.0 1.0 2.0 3.0 4.0 5.0 6.0 7.0 8.0
Newport Cardiff Neath Port Talbot Rhondda Cynon Taf Swansea Blaenau Gwent Torfaen Merthyr Tydfil Pembrokeshire Bridgend The Vale of Glamorgan Ceredigion Carmarthenshire Monmouthshire Powys Caerphilly Conwy Isle of Anglesey Wrexham Denbighshire Flintshire Gwynedd
Rate of unauthorised absenteeism (per cent) Average for
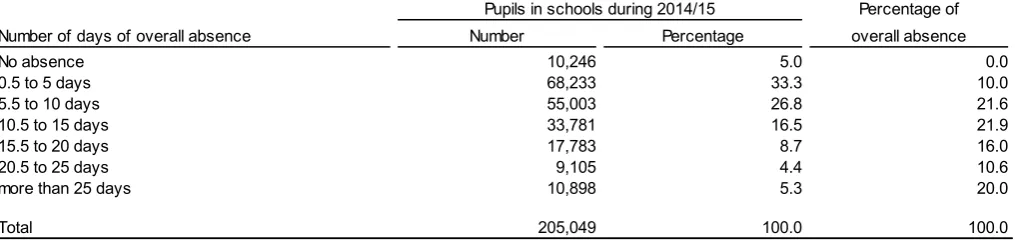
Table 6: Distribution of pupils in maintained primary schools by length of overall
absence, 2014/15
Pupils in schools during 2014/15 Percentage of
Number of days of overall absence Number Percentage overall absence
No absence 10,246 5.0 0.0
0.5 to 5 days 68,233 33.3 10.0
5.5 to 10 days 55,003 26.8 21.6
10.5 to 15 days 33,781 16.5 21.9
15.5 to 20 days 17,783 8.7 16.0
20.5 to 25 days 9,105 4.4 10.6
more than 25 days 10,898 5.3 20.0
Total 205,049 100.0 100.0
Source: Pupils' Attendance Record, Welsh Government
Table 7: Distribution of pupils in maintained primary schools by their overall absence
rates, 2014/15
Pupils in schools during 2014/15 Percentage of
Overall absence rate Number Percentage overall absence
0% 10,246 5.0 0.0
Over 0%, but 4% at most 96,584 47.1 19.6
Over 4%, but 6% at most 33,685 16.4 16.2
Over 6%, but 10% at most 40,704 19.9 30.3
Over 10%, but 20% at most 20,637 10.1 26.2
Over 20%, but 30% at most 2,285 1.1 4.9
Over 30%, but 50% at most 695 0.3 2.2
Over 50% 213 0.1 0.7
Total 205,049 100.0 100.0
Source: Pupils' Attendance Record, Welsh Government
5.0 per cent of pupils had no absence from maintained primary school in 2014/15. That means that just under 10,250 pupils did not miss any school sessions.
On the other hand, 5.3 per cent of pupils (just under 10,900 pupils) missed more than 25 days, or 5 weeks, of school.
Over 200 pupils were absent for more than half the time that they were on roll at a maintained primary school.
Please note that the number of pupils with over 20 per cent absenteeism in Table 7 does not relate to persistent absentees (defined in the Notes section) because it includes pupils who may have been on roll for a short period of time. Such pupils may have high absence rates, but the number of sessions that they missed is relatively small so they are not termed persistent absentees. For an analysis of
In 2014/15:
205,049
number of pupils in maintained primary schools.5.3%
percentage of pupils absent for more than 25 days(10,898 pupils).
5.0%
percentage of pupils with no absence (10,246pupils).
Chart 7: Distribution of pupils in maintained primary schools by length of overall
absence
Chart 7 groups all pupils attending maintained primary schools in Wales by the number of days that they were absent and plots the percentage of pupils that fall into four groups from 2007/08 to 2014/15. As the legend shows, the bottom bars relate to the percentage of pupils who had no absence and the bars above it increase in length of absence to the top bars which represent the percentage of pupils who were absent for 20.5 days or over. We can only produce this chart for the last eight years as the necessary data are not available before that.
3.0 2.8 2.4 2.7 3.6 2.9 5.0 5.0
50.8 50.0 49.6 50.6 53.9 51.8
59.2 60.1
29.2 29.8 30.4 30.0 28.2 30.2
25.2 25.1
17.0 17.4 17.6 16.7 14.3 15.1 10.6 9.8
0% 10% 20% 30% 40% 50% 60% 70% 80% 90% 100%
2008 2009 2010 2011 2012 2013 2014 2015
20.5 days or over 10.5 to 20 days 0.5 to 10 days No absence
The percentage of pupils with no absence from maintained primary school did not change between 2013/14 and 2014/15. This value is the highest it has been in 8 years. More than twice as many pupils in 2014/15 had no absence from school than in 2009/10.
The percentage of pupils missing at least 20.5 days from maintained primary schools in 2014/15 was the lowest that it has been in 8 years. It has been falling since 2012/13.
With the exception of 2012/13, the two groups of pupils with the highest absence have been shrinking since 2009/10. This means that fewer pupils are having higher levels of absence. In Table 8 you will find more information about pupils with high absence known as persistent
absentees.
In 2014/15:
The percentage of pupils with no absence was the highest it has been.
The percentage of pupils absent for 20.5 days or over decreased.
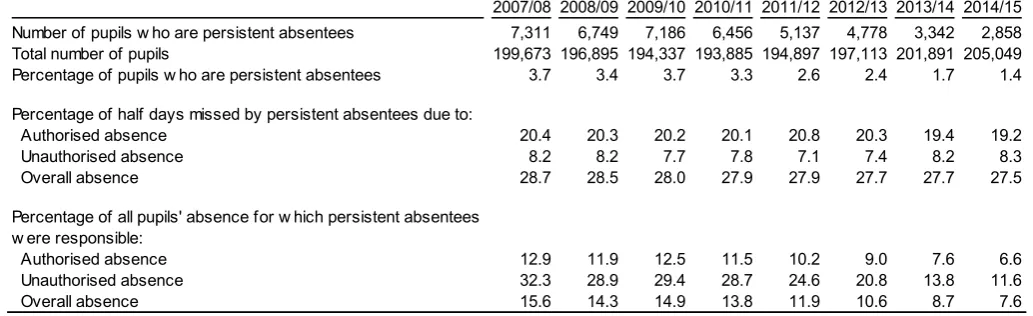
Table 8: Pupils of compulsory school age who were persistent absentees from
maintained primary schools (a)
2007/08 2008/09 2009/10 2010/11 2011/12 2012/13 2013/14 2014/15 Number of pupils w ho are persistent absentees 7,311 6,749 7,186 6,456 5,137 4,778 3,342 2,858 Total number of pupils 199,673 196,895 194,337 193,885 194,897 197,113 201,891 205,049 Percentage of pupils w ho are persistent absentees 3.7 3.4 3.7 3.3 2.6 2.4 1.7 1.4
Percentage of half days missed by persistent absentees due to:
Authorised absence 20.4 20.3 20.2 20.1 20.8 20.3 19.4 19.2
Unauthorised absence 8.2 8.2 7.7 7.8 7.1 7.4 8.2 8.3
Overall absence 28.7 28.5 28.0 27.9 27.9 27.7 27.7 27.5
Percentage of all pupils' absence for w hich persistent absentees w ere responsible:
Authorised absence 12.9 11.9 12.5 11.5 10.2 9.0 7.6 6.6
Unauthorised absence 32.3 28.9 29.4 28.7 24.6 20.8 13.8 11.6
Overall absence 15.6 14.3 14.9 13.8 11.9 10.6 8.7 7.6
Source: Pupils' Attendance Record, Welsh Government (a) Persistent absentees are pupils w ho w ere absent for at least 20 per cent of half-day sessions. For 2014/15 this means that persistent
(a) absentees in primary schools missed at least 76 half-day sessions. See the Notes section for a more detailed description.
The percentage of pupils who were persistent absentees was the lowest in 2014/15 that it has been over the past 8 years. This value has been falling since it peaked at 3.7 per cent in 2009/10.
There were less than half as many persistent absentees in 2014/15 as there were in 2007/08 when the number could first be calculated.
The rates of absenteeism are much higher for persistent absentees than for all pupils in Wales as seen in Tables 1 and 2. The rate of overall absence for all pupils in maintained primary schools was 5.1 per cent in 2014/15. But persistent absentees missed 27.5 per cent of half-day sessions from maintained primary schools.
The rate of overall absence for persistent absentees fell in 2014/15, but the rate of unauthorised absence increased.
The percentage of all pupils’ absence for which persistent absentees were responsible has been decreasing since 2009/10. This is because as the number of persistent absentees drops, the impact they have on absence rates for all pupils in Wales also lessens.
In 2014/15:
205,049
number of pupils in maintained primary schools.2,858
number of persistent absentees (1.4 per cent). Percentage of persistent absentees continues to decrease.Table 9: Distribution of reasons for absence by pupils of compulsory school age in
mainstream primary and middle schools, by reason for absence
Type of absence Code Reason for absence 2011/12 2012/13 2013/14 2014/15
Authorised I Illness 51.7 56.9 57.2 60.5
M Medical or dental appointments 10.2 6.2 6.3 5.9
R Religious observance 0.2 0.2 0.4 0.3
S Study leave 0.1 - -
-T Traveller absence 0.5 0.5 0.5 0.4
H Agreed family holiday 19.3 17.0 11.7 8.4
F Agreed extended family holiday 0.6 0.3 0.2 0.1
E Excluded, but no alternative provision made 0.3 0.3 0.3 0.3
C Other authorised (not covered by other codes or descriptions) 4.8 5.0 4.5 4.3
Total authorised absence 87.7 86.4 81.1 80.2
Unauthorised G Family holiday (not agreed or sessions in excess of agreement) 1.3 3.1 8.0 9.7
U Late (arrived after the register closed) 1.1 0.9 1.1 1.0
O Other unauthorised (not covered by other codes or descriptions) 7.7 7.7 9.1 8.6
N No reason for the absence provided yet 2.2 1.9 0.8 0.5
Total unauthorised absence 12.3 13.6 18.9 19.8
Overall Total overall absence 100.0 100.0 100.0 100.0
Source: Pupils' Attendance Record, Welsh Government
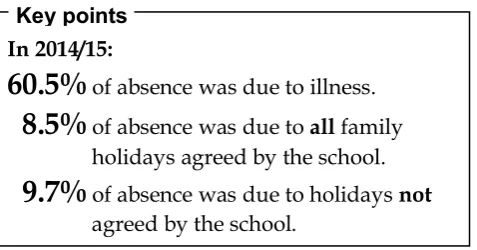
Illness was the most common reason given for absence from maintained primary schools in 2014/15. 60.5 per cent of all half-day sessions missed by pupils were because of illness.
The second most common reason for absence was family holidays not agreed by the school. This is the first time since reasons for absence were collected that unauthorised family holidays were more common than authorised family holidays.
Tables 9 and 10 show the data in two different ways. Table 9 shows how much of the absence from primary schools was because of each reason. Table 10 shows the percentage of half-day sessions missed because of each reason. So, for example, illness accounts for 60.5 per cent of absence, but only 3.1 per cent of half-day sessions were missed for this reason.
In 2014/15:
60.5%
of absence was due to illness.8.5%
of absence was due to all family holidays agreed by the school.9.7%
of absence was due to holidays not agreed by the school.[image:17.595.181.420.363.488.2]
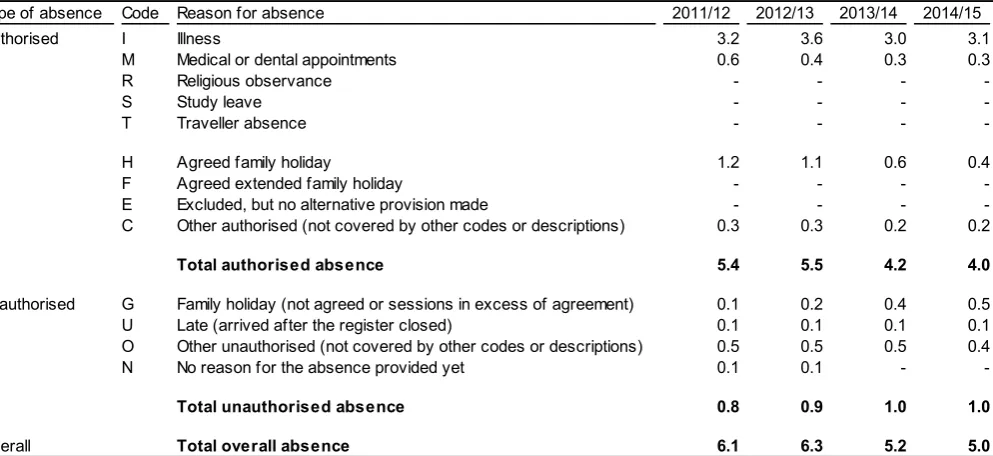
Table 10: Percentage of sessions missed by pupils of compulsory school age in
mainstream primary and middle schools, by reason for absence
Type of absence Code Reason for absence 2011/12 2012/13 2013/14 2014/15
Authorised I Illness 3.2 3.6 3.0 3.1
M Medical or dental appointments 0.6 0.4 0.3 0.3
R Religious observance - - -
-S Study leave - - -
-T Traveller absence - - -
-H Agreed family holiday 1.2 1.1 0.6 0.4
F Agreed extended family holiday - - -
-E Excluded, but no alternative provision made - - -
-C Other authorised (not covered by other codes or descriptions) 0.3 0.3 0.2 0.2
Total authorised absence 5.4 5.5 4.2 4.0
Unauthorised G Family holiday (not agreed or sessions in excess of agreement) 0.1 0.2 0.4 0.5
U Late (arrived after the register closed) 0.1 0.1 0.1 0.1
O Other unauthorised (not covered by other codes or descriptions) 0.5 0.5 0.5 0.4
N No reason for the absence provided yet 0.1 0.1 -
-Total unauthorised absence 0.8 0.9 1.0 1.0
Overall Total overall absence 6.1 6.3 5.2 5.0
Source: Pupils' Attendance Record, Welsh Government
The percentage of half-day sessions missed from primary schools due to illness increased in 2014/15. The increase was small, so it was still not as high as its peak in 2012/13.
Agreed family holidays continued to fall between 2013/14 and 2014/15. The percentage of half-day sessions missed for family holidays agreed by the school fell by 0.2 percentage points between these years.
While agreed family holidays decreased, the data show that family holidays not agreed by the school increased. This also happened in 2012/13 and 2013/14.
The decrease in agreed family holidays in 2014/15 was larger than the increase in unauthorised family holidays. This means that less half-day sessions were missed because of holidays in 2014/15 than in previous years.
The changes in absence because of holidays could be related to the fact that some schools have changed the way that they deal with term-time holidays. In 2012/13 some schools decided to take a firmer stance when considering term-time holidays. In 2013/14 more schools decided to do the same.
The overall rate of unauthorised absence did not change in 2014/15. This is because the percentage of half-day sessions missed because of ‘Other unauthorised’ reasons decreased by the same amount
In 2014/15:
Small increase in absence due to illness and medical/dental appointments. Decrease in absence due to agreed family holidays.
Small increase in unauthorised family holidays.
Chart 8: Absenteeism by pupils of compulsory school age with reasons for absence,
2005/06 to 2014/15
Chart 8 shows the change in overall and unauthorised absence over time. It includes information about events that may have affected pupils’ absence in the years that they occurred. The events will be
explained in more detail below.
0.0 1.0 2.0 3.0 4.0 5.0 6.0 7.0 8.0 9.0
2006 2007 2008 2009 2010 2011 2012 2013 2014 2015
R at e o f a b s e n te ei sm (p er c e nt ) Unauthorised absence
Overall absence Increase in absence
due to illness.
Schools take a f irmer stance on term-time holiday s.
Fewer sessions missed due to term-time holiday s. Extreme weather conditions
increase pupils' absence.
2009/10
Extreme weather conditions during the winter affected pupils’ attendance during the winter of 2009/10. Prolonged periods of snow and ice prevented some pupils from attending school. These pupils were marked as having authorised absence. In following years schools were able to mark such pupils as ‘not required to attend’, so extreme weather would be less likely to affect absence rates.
2012/13
Overall absence in 2012/13 increased because of illness. Outbreaks of diseases, such as Measles, may have contributed to this increase in illness absence.
Some schools took a firmer stance with respects to term-time holidays. In 2012/13 the percentage of sessions missed due to family holidays did not change from the year before. However, agreed family holidays decreased slightly and unauthorised holidays increased by the same amount. The schools’ decisions regarding term-time holidays may have had an effect on this year’s rate of unauthorised absence.
2013/14
Accessing the data electronically
The data behind some of the charts and tables in this release can be found on StatsWales (a free-to-use internet service that allows visitors to view, manipulate, create and download tables and charts). Please select Education and skills > Schools and teachers > Absenteeism on the following site:
www.statswales.wales.gov.uk
Further data relating to these tables or attendance data for individual schools is available on request; please email [email protected].
School level data is also available on My Local School (Updated in December 2015) mylocalschool.wales.gov.uk.
The presentation of this release has been improved in order to aid interpretation of the data. Feedback would be welcome. Please email any comments to [email protected].
Notes
1 Context
1.1 Policy/Operational
All children who are receiving an education at school during the normal school day must be placed on the attendance register. An attendance register records every pupil’s attendance at every session the school is open to pupils and must be called twice a day: at the start of the morning session and once during the afternoon session. The register must show whether each pupil is present, engaged in an approved educational activity off-site (treated as present if they attend that provision), or absent. In addition, where a pupil of compulsory school age is absent, the register must also show whether the absence was authorised or unauthorised.
Improving attendance continues to be a key Ministerial priority. Data suggest that absence impacts on an individual learner’s attainment. Therefore, attendance needs to remain a priority for schools to ensure that children and young people are given the chance to achieve their potential. The development of the Attendance Analysis Framework has played an important role in raising the profile of attendance in the context of school improvement.
The Framework sets out a standardised and robust approach to data analysis. It is intended to identify systematic problems in schools and local authorities, and identify ways that these might be addressed. Using the Framework as a basis an extensive analysis is carried out on each local authority’s attendance data. The Framework, along with an analysis report, highlights areas where the Welsh Government feels there are weaknesses or strengths are sent to each local authority.
1.2 Related Publications
A similar release relating to absenteeism from maintained secondary, special and independent schools in Wales during the 2014/15 academic year entitled ‘Absenteeism from Secondary Schools, 2014/15’ was released on 26 August 2015 and can be found here:
http://gov.wales/statistics-and-research/absenteeism-secondary-schools. Although data for secondary schools were collected in the same way as those for primary schools, they only cover the period from the start of the academic year to the late May bank holiday. Primary school absenteeism data cover the whole academic year.
England publishes absenteeism data for primary and secondary schools in the statistical release entitled ‘Pupil absence in schools in England: 2013 to 2014’. The latest available statistics can be found here: https://www.gov.uk/government/collections/statistics-pupil-absence. Some data published in this statistical release relate to the whole academic year (six half terms), while other relate to the period from the start of the academic year to the late May bank holiday (five half terms). Absenteeism data for England do not include independent schools, while they are included in some of Wales’ data. Data for state-funded schools in England include academies. There are no academies in Wales. Care should be taken when comparing data.
Scotland publishes absenteeism data for primary and secondary schools in supplementary dataset tables. The latest available statistics can be found on their website:
http://www.scotland.gov.uk/Topics/Statistics/Browse/School-Education/AttendanceAbsenceDatasets. Absenteeism data for Scotland do not include special or
presented separately to primary schools. Data do not include independent schools. As with other countries, care should be taken when comparing data.
2 Data Source
The Pupils’ Attendance Record is made up of pupil-level attendance data collected electronically from maintained schools, care of their local authority (LA). School-level attendance data from independent schools are collected via a voluntary, paper-based survey. The same form is sent to maintained special schools via their local authorities and it is mandatory for special schools to respond. All collections are carried out by Knowledge and Analytical Services within the Welsh Government.
3 Definitions
3.1 Coverage
The absenteeism information in this Statistical First Release relates to the percentage of half-day sessions missed by pupils due to unauthorised and overall absence for the whole of the academic year. Pupils of compulsory school age (5-15) registered at maintained primary schools and pupils aged 5-10 registered at special and independent schools are included in the data (ages as on 31st August before the start of the academic year). Attendance data were received from 1,409 schools with pupils within these age groups in the 2014/15 academic year.
A new type of schools was created during the 2012/13 academic year, middle schools. These schools provide education for pupils of both primary and secondary school age. Data from middle schools are categorised as ‘maintained schools’ in this Statistical First Release, but only include data for pupils aged 5-10 (as on 31st August before the start of the academic year). As with data for other schools, primary attendance data for middle schools cover the entire academic year.
The free school meal data are collected through the January Pupil Level Annual Schools Census
(PLASC) and is based on a 3-year average. Where schools have merged, the 3-year average for the new school includes free school meal data for the previous schools for the year or years that they were open prior to merging.
3.2 Types of Absence
All (or ‘overall’) absences comprise those which are authorised and unauthorised:
an authorised absence is an absence with permission from a teacher or other authorised
representative of the school. This includes instances of absence for which a satisfactory explanation has been provided (e.g. illness, family bereavement or religious observance);
an unauthorised absence is an absence without permission from a teacher or other authorised
representative of the school. This includes all unexplained or unjustified absences.
Note that pupils undertaking approved and supervised educational activities conducted away from the school (e.g. work experience or educational visits) are deemed to be present at the school.
3.3 Term dates
Attendance and absence data were collected on the days that schools were open to pupils between the following dates:
Autumn term – from 1 September 2014 to 25 December 2014. Spring term – from 26 December 2014 to 5 April 2015.
3.4 Persistent Absentees
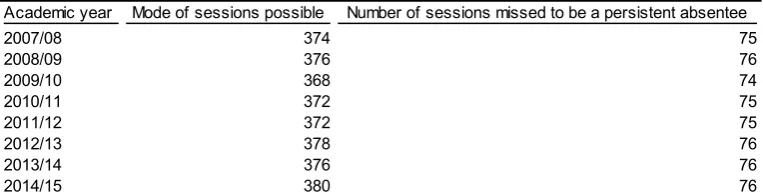
Persistent absentees are pupils who were absent for at least 20 per cent of the mode number of half-day sessions that schools were open to pupils (which does not include INSET days). The following example of how persistent absentees were evaluated for 2014/15 will help to explain what this means:
The mode is the number which appears most often, so the mode number of half-day sessions that schools were open to pupils is the most frequent number of sessions that they were open to pupils. For the 2014/15 academic year most maintained primary schools were open to pupils for 380 half-day sessions.
Twenty per cent of that figure equals 76 (380 * 0.2 = 76) half-day sessions.
So a persistent absentee in 2014/15 was someone who was absent for at least 76 half-day sessions.
[image:24.595.43.425.312.410.2]Because the mode number of sessions that schools were open to pupils changes from year to year the figure used to determine whether a pupil is a persistent absentee or not also changes. The following table shows the values used to evaluate persistent absenteeism from 2007/08 to 2014/15.
Values used to calculate persistent absenteeism
Academic year Mode of sessions possible Number of sessions missed to be a persistent absentee
2007/08 374 75
2008/09 376 76
2009/10 368 74
2010/11 372 75
2011/12 372 75
2012/13 378 76
2013/14 376 76
2014/15 380 76
4 Key Quality Information
This section provides a summary of information on this output against five dimensions of quality: Relevance, Accuracy, Timeliness and Punctuality, Accessibility and Clarity, and Comparability.
Between September and November 2010 we conducted a public consultation on our Education Statistics outputs in which we asked for feedback on the quality of the outputs.
4.1 Relevance
The statistics are used both within and outside the Welsh Government to monitor educational trends and as a baseline for further analysis of the underlying data. Some of the key users are:
Ministers and the Members Research Service in the National Assembly for Wales. The Department for Education and Skills in the Welsh Government.
Estyn, Her Majesty’s Inspectorate of Education and Training in Wales. The Department for Education in England.
other government departments. local authorities and schools. Wales Audit Office.
other areas of the Welsh Government. the research community.
These statistics are used in a variety of ways. Some examples of these are: advice to Ministers.
the all-Wales education core data packs (the replacement for the National Pupil Database). LA and school comparisons and benchmarks.
to inform the education policy decision-making process in Wales. development of a national school categorisation system for Wales. to inform Estyn during school inspections.
contributes to the National Performance Indicators. international benchmarking.
the education domain of the Welsh Index of Multiple Deprivation. to assist in research in educational attainment.
the attendance analysis framework.
4.2 Accuracy
The Welsh Government works closely with schools and local authorities in order to ensure all data are validated before tables are published. Data are collated into an electronic return and submitted to the Welsh Government through DEWi, a secure online data transfer system developed by the Welsh Government. Various stages of automated validation and sense-checking are built into the process to ensure a high quality of data.
With the aim of further improving the accuracy of the data a new stage in the validation process was implemented for the first time when collecting the 2011/12 data. A table was sent to each local authority containing a summary of the data for all of their maintained primary schools which they were asked to check. A similar table was sent to local authorities for the first time in the 2013/14 data collection for local authorities to check their special schools’ data. In the past a letter was sent to special schools directly to ask them to check a summary of their data. The same letter is still sent to independent schools.
During the 2009/10 academic year extreme weather conditions forced a large number of schools to close to protect the welfare of their students. Some schools were able to remain open for pupils who could safely attend. Those who were unable to attend on these days were recorded as having authorised absence, thereby inflating the schools’ overall absence percentages. Since not all schools had partial closures due to the inclement weather, and those that did close for a varying number of days and had a varying percentage of pupils absent, the scale of the effect of these partial closures on local authorities’ absence rates could not be measured.
The statistical category ‘Not required to attend’ was introduced to the Welsh Government’s attendance data collection in 2010/11. Half-day sessions are recorded in this category in situations when individual pupils’ attendance is not possible but the school remains open, such as when pupils are not able to safely attend school, and will not be counted towards the total number of sessions that they could attend in a year. This means that extreme weather conditions no longer adversely affect either schools’ or local authorities’ attendance percentages.
4.3 Timeliness and Punctuality
There were no major delays in the collection, validation and analysis of these data, meaning that this edition of the Statistical First Release was able to be published two days earlier than the last edition.
4.4 Accessibility and Clarity
This Statistical First Release is pre-announced and then published on the Statistics section of the Welsh Government website. It is accompanied by more detailed tables on StatsWales, a free to use service that allows visitors to view, manipulate, create and download data.
4.5 Comparability
Pupil-level absence data was collected from maintained primary schools for the first time in 2007/08. However, the definitions and calculations involved in the collection have not changed, so comparability over time has not been affected.
Since 2002/03 primary schools have been asked to provide, on a voluntary basis, their attendance information broken down by gender. In 2007/08 it became compulsory for maintained primary schools to provide gender information whilst remaining voluntary for special and independent schools. 1,401 schools (99.4%) supplied gender data in 2014/15, compared with 1,421 schools (99.5%) of schools in 2013/14. It is not advisable to compare year on year changes prior to 2007/08 in absenteeism by gender as different schools responded each year.
Due to the effect that partial closures of schools due to extreme weather conditions during the 2009/10 academic year had on schools’ attendance rates caution should be used when comparing year-on-year changes.
During the 2012/13 academic year outbreaks of illnesses such as Measles may have had an adverse affect on local authorities’ attendance. Caution should be taken when comparing local authority-level data for this year.
Also in 2012/13, some schools decided to take a firmer stance on term-time holidays. In the 2013/14 academic year more schools made the same decision. These decisions may have had an effect on the rates of absenteeism in these years.
Before 2013/14 absence rates for special and independent schools were calculated by dividing the number of half-day sessions absent by the number of half-day sessions that the school was open multiplied by the number of pupils on roll in the January Pupil-Level Annual School Census (PLASC) and multiplying this number by 100. In 2013/14 it was decided to use a more accurate calculation of absence percentages, dividing the number of half-day sessions absent by the total number of sessions that pupils were on roll in the school and multiplying by 100. Although schools have been asked to provide the total number of sessions that pupils were on roll in the school since 2013/14, some still provided the number of half-day sessions that the school was open. In 2013/14 one school only provided the number of half-day sessions that the school was open. In 2014/15 five schools only provided the number of half-day sessions that the school was open. For this reason, although the majority of special and independent schools’ absence percentages were calculated using the new
method, some schools’ percentages were calculated using the old method. In future data collections the Welsh Government will endeavour to make sure that all special and independent schools’ absence percentages are calculated using the new, more accurate method. Because of the change in