How to Communicate Evaluation Work in Design Science Research? An
Exemplar Case Study
Anup Shrestha
School of Management & Enterprise
University of Southern Queensland
Toowoomba, Queensland, Australia
Email:
[email protected]
Aileen Cater-Steel
School of Management & Enterprise
University of Southern Queensland
Toowoomba, Queensland, Australia
Email:
[email protected]
Mark Toleman
School of Management & Enterprise
University of Southern Queensland
Toowoomba, Queensland, Australia
Email:
[email protected]
Abstract
How should we communicate evaluation work in design science research (DSR)? A case study based on our industry collaboration research project encountered this challenge after finding limited guidance on a structure to effectively communicate DSR evaluation work. We propose a logic model as a consistent reporting structure to communicate DSR evaluation by presenting a unified view of inputs, outputs, and immediate and long-term outcomes. The case study is based on an IT service organisation where a novel research artefact to conduct IT service process assessments was implemented. We present this case study as a real-life exemplar for an experimental design involving the use of a logic model to communicate DSR evaluation work. This case study provides a source of qualitative evaluation data to explore and analyse how the application of a simple logic model might provide the much needed structure to communicate critical evaluation activities in a DSR project.
Keywords
Design Science Research Evaluation, Logic Model, Case Study, Process Assessment, IT Service Management
INTRODUCTION
In contrast to widely popular research methods in the Information Systems (IS) discipline that are used to investigate or validate hypotheses, the primary goal of the emerging Design Science Research (DSR) method (Hevner et al. 2004) is to develop a new artefact. The focus on the design of a new artefact is particularly suitable for IS research since “the [IS] field should not only try to understand how the world is, but also how to change it” (Carlsson et al. 2011, p. 109). Benbasat and Zmud (2003) argued that the IT artefact should form the core of the IS discipline. There is a good support for this position in the IS literature (Furneaux & Wade 2009). Gregor (2006) distinguished five interrelated types of theory and all types of theory can inform Type V: “Theory for design and action”. Based on a design theory, the knowledge of people and technology can inform the design of new IS artefacts (Gregor 2006). DSR is focused on the creation of IT artefacts to solve identified organisational problems (Hevner et al. 2004). However if the research has an exclusive focus on the “design” of the artefact, then there is a lack of evidence that the artefact achieves its purpose to solve a class of problems. Unless DRS artefacts are rigorously evaluated, the outcomes could be viewed as merely unconfirmed propositions. Therefore, evaluation in DSR is important to answer the crucial question: “how well the artefact performs?” (March & Smith 1995, p. 254).
evaluation in naturalistic or artificial forms and the timing of evaluation, i.e. during design process or after artefact development (Pries-Heje, Baskerville & Venable 2008) demonstrate a challenging set of considerations for artefact evaluation. Hevner et al. (2004) provided an extensive list of quality attributes for artefact evaluation such as functionality, completeness, consistency, accuracy, performance, reliability, usability and organisation fit among others. Moreover a hierarchy of IS artefact evaluation criteria has been proposed with 20 evaluation methods based on a review of 26 DSR publications (Prat, Comyn-Wattiau & Akoka 2014). However, selection of relevant artefact evaluation factors depends on the artefact itself and its purpose (Venable, Pries-Heje & Baskerville 2012). The presence of several criteria to evaluate multiple properties of an artefact makes artefact evaluation a convoluted process to conduct and communicate. Beyond providing a strategic evaluation framework (Venable et al. 2012) or a holistic view of important evaluation methods (Prat et al. 2014), very little guidance has been provided towards a structure that a researcher can follow to report DSR evaluation in a consistent manner. This state of affairs in DSR constitutes what we can call “a lack of structure” in communicating DSR evaluation work.
The purpose of this paper is to respond to the lack of a consistent structure to communicate DSR evaluation work by proposing a DSR evaluation reporting structure based on a simple logic model. The logic model has been used by program managers and evaluators for over three decades to describe the effectiveness of their programs. In its simplest form, the logic model displays logical relationships between the inputs, activities, outputs and outcomes of a program (Julian, Jones & Deyo 1995). Logic modelling methods such as program logic are used extensively for performance evaluation of programs (McLaughlin & Jordan 1999). Consequently the logic model is featured as one of the qualitative evaluation research methods (Patton 1990). We demonstrate an exemplar case of how DSR evaluation work can be reported using the logic model structure. This example presents a case study that is conducted to evaluate a process type artefact (Gregor & Jones 2007) in a naturalistic setting. The research artefact is a new approach to conduct IT service process assessments, referred to as the software-mediated process assessment (SMPA) approach. The SMPA approach evaluation is communicated using the proposed logic model.
The following section in the paper discusses current literature on DSR evaluation highlighting the lack of a structure to communicate DSR evaluation work. Next, we present the DSR evaluation reporting structure based on a simple logic model. Using the proposed evaluation reporting structure, the subsequent sections demonstrate an exemplar DSR evaluation case. Finally, we provide conclusions and discuss implications for future research.
LITERATURE REVIEW
Rigorous artefact evaluation primarily assesses two aspects: if the artefact causes a significant improvement; and if the artefact works in a real situation (Checkland & Scholes 1990). The IS design theories (Pries-Heje & Baskerville 2008) or design principles (Sein et al. 2011) provide rigorous theoretical insights to evaluate the utility of DSR artefacts. A design theory can govern DSR based on several extant methods, such as the kernel theories (Iivari 2007; Walls et al. 2004), case studies (Van Aken 2006) or systematic literature review (Carlsson et al. 2011). By conducting a rigorous artefact evaluation, the design theories can be supported or critiqued. As a result better utility artefacts can be designed (Venable et al. 2012).
Other disciplines outside of DSR such as project and program management are relatively mature in terms of addressing the issue of communicating evaluation activities. Recently various methods have also been proposed for evaluation of DSR artefacts. Five classes of evaluation methods were proposed by Hevner et al. (2004): observational methods that include case studies and field work; analytical methods that include static and dynamic analyses and optimization techniques; experimental methods including controlled experiments and simulations; testing methods including functional and structural testings; and descriptive methods including informed arguments and scenarios. In their DSR methodology, Peffers et al. (2007) suggested two steps for rigorous DSR evaluation: demonstration of how the artefact is implemented in a feasible manner; and evaluation to assess how well the artefact works.
Being a relatively new and emerging research method, DSR lacks helpful templates to present research work. Upon reviewing literature, we found that researchers have communicated bogus design processes for software projects in the past (Parnas & Clements 1986). However Parnas and Clements (1986) went on to suggest that a well-documented design process, albeit fake, may still facilitate evaluation for future enhancements of artefacts. We argue that a useful communication structure for the design process can enhance legitimacy and rigour of evaluation work. Gregor and Hevner (2013) have proposed a DSR study publication schema with guidance to present DSR research. Their work provides significant insights into showcasing how DSR research makes knowledge contribution and how to present DSR work as a whole. In the evaluation section, they suggested that evidence must be provided to demonstrate that the artefact is worthy and has value (Gregor & Hevner 2013). While it is clear that evaluation strategy, process and outcome need to be reported in a DSR study, the crucial question of “how” to communicate these details has not been clearly answered. Consequently reports of DSR evaluation lack structure and rigour. We base our work on addressing this challenge.
REPORTING STRUCTURE FOR DSR EVALUATION
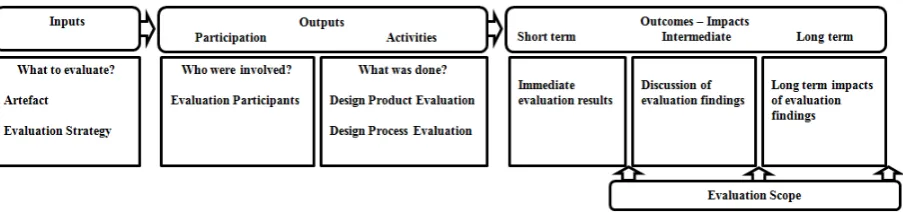
[image:3.595.75.527.300.407.2]A logic model that we propose as a consistent reporting structure for DSR evaluation is presented in Figure 1. The reporting structure presents a unified view of (1) inputs in terms of the artefact to evaluate and the evaluation strategy adopted; (2) discussion of participation and activities to clearly explain the evaluation process; and (3) outcomes from the evaluation in terms of immediate findings, their discussion and long-term impacts.
Figure 1: DSR Evaluation Reporting Structure
A clear definition of the artefact to be evaluated is necessary to provide context for the evaluation effort. Consistent with other research methods, hypotheses and/ or propositions that relate to the artefact and its evaluation can be proposed based on a literature review in order to instil rigour in DSR activities before the actual evaluation work. In most DSR studies, description of the artefact would have been provided during the reporting of the design and development of the artefact. Hence artefact description is generally reported prior to the evaluation section. In such cases, the DSR evaluation section should begin by reporting a clear choice of evaluation methods, timing and setting undertaken in the study. The DSR strategic evaluation framework by Venable et al. (2012) is a definitive guide for this purpose. An evaluation protocol may be derived from the evaluation strategy to clearly communicate the plans for undertaking DSR evaluation.
Next, in terms of the evaluation activities, both the design process (DSR methodology) evaluation and the design product (artefact) evaluation could be reported as evaluation activities. The key focus in this section is to clearly mention the factors considered for evaluation, how the evaluation protocol was followed (also deviations from the protocol if any) and an evidence-based account of the evaluation process followed.
Finally, the three dimensions of outcome: short-term; intermediate; and long-term outcomes of a DSR evaluation provide three scope demarcations to communicate varying levels of impact of the outcomes of a DSR evaluation. Since perfect evaluations are next to impossible, researchers should also highlight any limitations before communicating evaluation results. Subsequently, immediate evaluation results are reported as short-term outcomes of evaluation. More elaborate discussions on evaluation findings and their implication on practice can be structured as intermediate evaluation outcomes. Likewise, long-term evaluation outcomes may comprise lasting impacts and implications to theory and the body of knowledge. When communicating iterative "build-evaluate" cycles, i.e. ex-ante evaluation process, communication of evaluation outcome is generally limited to immediate evaluation results. Such formative evaluations are usually reported as part of artefact design and description (Vaishnavi & Kuechler 2004).
EVALUATION OF AN ARTEFACT FOR IT SERVICE PROCESS ASSESSMENTS
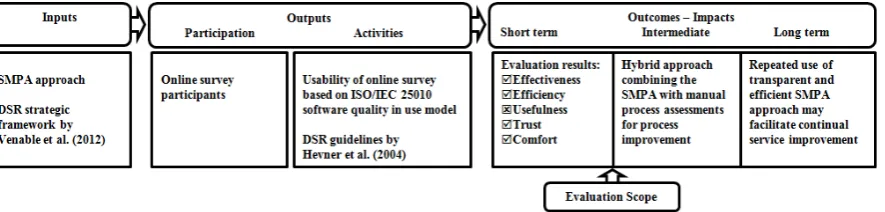
[image:4.595.78.521.243.349.2]In the following sections, we report our evaluation experience from a large DSR project using the proposed DSR evaluation reporting structure. Firstly, a brief introduction of the artefact, the SMPA approach, is provided to understand the context of artefact evaluation. The evaluation strategy adopted from Venable et al. (2012) is then discussed for the case. Evaluation activities are then reported as part of design product evaluation using ISO/IEC 25010 software quality in use factors (ISO/IEC 2011) and design process evaluation using DSR method guidance from Hevner et al. (2004). Evaluation activities can be based on a general hypothesis/ proposition about the evaluation. In this case, the hypothesis can be developed in terms of usability for the design product evaluation and in terms of adherence to the DSR research method for the design process evaluation. Finally the results of the evaluation are presented along with a discussion of three-level evaluation outcomes. Figure 2 presents the DSR evaluation reporting structure followed in the case study. The case study is an IT service organisation based in Brisbane, Australia. It employs over 400 staff who provide a range of IT services as both internal and external service provider. The case organisation participated in our research to trial the use of international standards in process assessment of IT services.
Figure 2: Reporting Structure for SMPA Approach Evaluation
Research Artefact
Before a detailed account of the artefact evaluation, we briefly explain the research artefact that is proposed as a novel approach to conduct IT service process assessments. The artefact evaluated in our case is referred to as the SMPA approach in the discipline of IT Service Management (ITSM). The description of the artefact (SMPA approach in our case) represents one of the inputs in the DSR reporting structure (Figure 2). ITSM is a service-oriented IT management framework that advocates best practice IT service processes based on IT Infrastructure Library (ITIL®) and the international standard for ITSM ISO/IEC 20000 to ensure that IT delivers quality service to businesses. One of the challenges in ITSM is the lack of uniformity and transparency in the way IT service processes are assessed for improvement (Lloyd, 2011). Moreover it has been reported that existing process assessment methods are costly and time-consuming.
In response to the challenges in IT service process assessments, the SMPA approach is proposed as our research artefact. The SMPA approach is a standards-based approach by which organisations can self-assess their processes using a software tool to determine process capabilities. Existing ITSM process assessment frameworks such as Tudor’s IT Process Assessment (Barafort et al. 2009) use proprietary assessment models and follow indistinct assessment activities. The issue of transparency is therefore a significant hurdle in conducting an objective process assessment. The SMPA approach, being software-mediated, uses an online survey tool to collect process assessment data. ISO/IEC 15504 is the international standard for process assessment (ISO/IEC 2004). We used the assessment model from this standard to generate assessment questions. Three IT service processes were selected for the SMPA approach: Problem Management (PrM), Configuration Management (CoM) and Service Level Management (SlM) in our case study. The online survey for assessment consists of 163 questions spread across all five capability levels for the three processes. Individuals belonging to the ITSM discipline in the process roles of process manager (PM), process performer (PP) or external process stakeholder (EPS) participated in the survey. Every question is rated using the scale: “Not”, “Partially”, “Largely”, “Fully” and “Not Applicable” as defined in the standard. Survey participants chose one of the options in the scale and could optionally enter comments as well.
While most of the existing process assessments rely on process-specific indicators to collect objective evidence of process capabilities, the SMPA approach facilitates a top-down approach where assessment at each level of process capability is conducted through online surveys. In the SMPA approach, explicit questions based on the standard indicators are presented. All responses for survey questions are stored in order to calculate process capability metrics. Rather than the assessment team making a subjective choice based on the testimony of process stakeholders, the online survey collects and objectively measures feedback from the process stakeholders directly from the responses. The approach of asking questions directly in a web-based survey environment represents a faster and more efficient data collection method compared to assessment interviews. Figure 3 presents the structure of the SMPA approach. The SMPA approach includes a survey engine for assessment questions, processing of survey responses to determine process capability and a knowledge base to amass into a report process improvement recommendations resulting from assessments.
Figure 3: Structure of the SMPA approach
Since the assessment participants interact with the survey engine in the SMPA approach, the DSR evaluation is focused on determining the usability of the online survey approach in IT service process assessments.
Evaluation Strategy
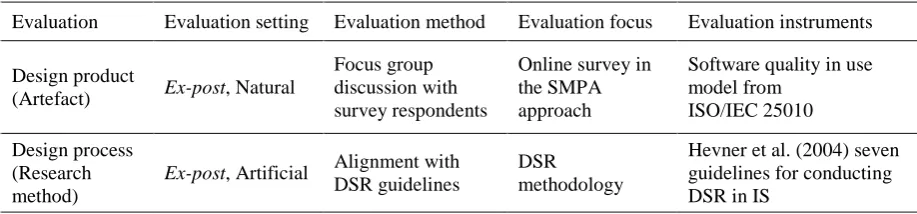
Evaluation of the SMPA approach was organised based on the evaluation strategy advocated by Pries-Heje et al. (2008). The evaluation strategy represents another input in the DSR reporting structure (Figure 2). Following the information system design theory (Walls et al. 2004), the evaluation strategy separates the evaluation of the design product (the research artefact) and the design process (artefact design process). In this project, the research artefact is the SMPA approach as discussed earlier. The artefact design process is represented by the DSR methodology (Peffers et al. 2007). Moreover, two evaluation aspects considered in the evaluation strategy are the timing of the evaluation (ex-ante or ex-post) and the setting of the evaluation (artificial or naturalistic). Pries-Heje et al. (2008) suggested at least two evaluation episodes: “design-evaluate-construct-evaluate”. Ex-ante evaluation occurs before and during artefact design and development whereas ex-post evaluation occurs after the artefact is developed (Peffers et al. 2012). Table 1 presents the evaluation protocol developed from the evaluation strategy. Case study research was undertaken for an ex-post, naturalistic evaluation of the research artefact conducted at an IT service organisation.
Table 1. Evaluation Protocol
Evaluation Evaluation setting Evaluation method Evaluation focus Evaluation instruments Design product
(Artefact) Ex-post, Natural
Focus group discussion with survey respondents
Online survey in the SMPA approach
Software quality in use model from ISO/IEC 25010 Design process
(Research method)
Ex-post, Artificial Alignment with DSR guidelines
DSR methodology
Hevner et al. (2004) seven guidelines for conducting DSR in IS
Recently, Seidel and Watson (2014) have drawn attention to the difference between pathways to predictive accuracy, as the major goal of basic science, and prescriptive accuracy, as the major goal of practice. Our ex-post naturalistic evaluation aims to ensure results of high practical applicability for stakeholders, such as IT service managers (Rosemann & Vessey 2008), thereby contributing to prescriptive accuracy.
[image:5.595.65.524.523.630.2]section of the DSR reporting structure (Figure 2). In this section, detailed activities of evaluation including participants involved are discussed.
Design Product Evaluation
The online survey in the SMPA approach was implemented to query the existing process activities regarding how process stakeholders interact with the process. Therefore a transparent measure of usability was considered as the primary factor to evaluate the SMPA approach. A focus group was organised at the case study organisation to evaluate the usability of the online survey in the SMPA approach. Since all participants of the focus group had completed the assessment surveys, it was interesting to note the inconsistencies and variations that existed among the participants in terms of their experiences and attitudes towards the usability of the online survey. The session was recorded and later transcribed for subsequent content analysis.
[image:6.595.64.520.266.356.2]The standard definitions were transformed to operational definitions of usability characteristics to align their meaning to specific contexts of use for the evaluation of the survey approach. The operational definitions of the five usability characteristics that were evaluated for the online assessment survey are described in Table 2.
Table 2. Operational definitions of usability characteristics Usability characteristics Operational definition
Effectiveness Accuracy and transparency of the online assessment survey Efficiency Time, cost and resources required for the online assessment survey Usefulness Representative and understandable assessment questions to answer Trust Confidence in validity of the online assessment survey
Comfort Ease of using online assessment survey
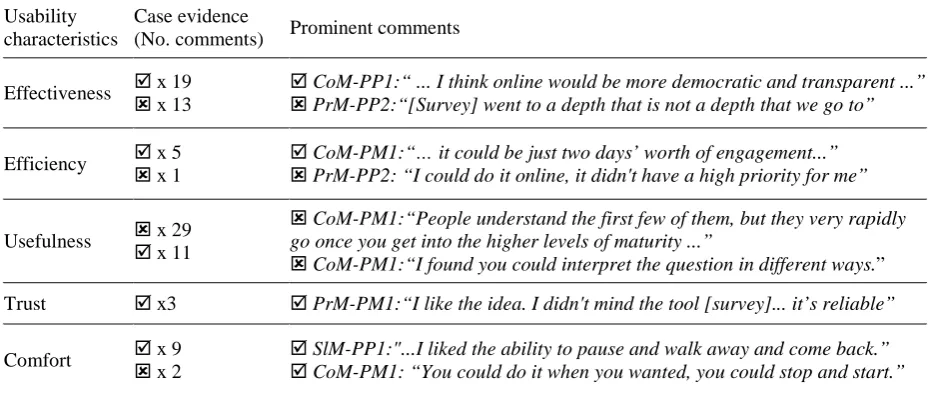
To maintain the privacy of individuals, survey participants were coded by their most relevant role in each process. Eleven participants commented on the usability of the survey approach based on their context of use. Comments from the focus group on the usefulness of the SMPA approach were analysed for themes related to the five software quality in use characteristics. These attributes based on an international standard provide a structure to evaluate the usability of the online survey experience in ITSM process assessments. The use of a matrix to analyse qualitative evaluation factors has been reported as a useful approach in case study research (Huberman & Miles 1994). The evaluation based on discussions is reported as either positive for strong evidence of support on each factor or negative if there is evidence of strong disagreement on each factor. A summary of the evaluation results of the online assessment survey is presented in Table 3.
Table 3. Summary of online assessment survey evaluation results (from 11 participants) Usability
characteristics
Case evidence
(No. comments) Prominent comments
Effectiveness x 19 x 13 CoM-PP1:“ ... I think online would be more democratic and transparent ...” PrM-PP2:“[Survey] went to a depth that is not a depth that we go to”
Efficiency x 5 x 1 CoM-PM1:“… it could be just two days’ worth of engagement...” PrM-PP2: “I could do it online, it didn't have a high priority for me”
Usefulness x 29 x 11
CoM-PM1:“People understand the first few of them, but they very rapidly go once you get into the higher levels of maturity ...”
CoM-PM1:“I found you could interpret the question in different ways.” Trust x3 PrM-PM1:“I like the idea. I didn't mind the tool [survey]... it’s reliable”
Comfort x 9 x 2
SlM-PP1:"...I liked the ability to pause and walk away and come back.” CoM-PM1: “You could do it when you wanted, you could stop and start.” indicates the usability characteristic was strongly supported in a comment
indicates the usability characteristic was strongly opposed in a comment
[image:6.595.69.535.489.686.2]Configuration Management strongly supported the accuracy of the survey and praised the ability to add comments: “I think for accuracy, I think online would probably be more appropriate to be honest... You could qualify your answer, on every question as well, with a comment.”(CoM-PM1)
Another process manager raised the problem of preconceived human bias in a manual assessment and how an online survey can overcome such problems: “I think it then depends on the person conducting the interview and their knowledge of you or the organisation. It's all their preconceived ideas built in. Whereas if you are doing it online there’s no nagging, no judging… it’s transparent in that sense.” (PrM-PM1)
However some process stakeholders preferred a manual assessment suggesting that it is more collaborative: “I think one-on-one [manual] is a better option because you have opportunity to seek immediate clarification if you are unsure. And immediate feedback.” (SlM-PM1)
Ironically, one of the important criticisms of the online survey was its strict alignment with the standard. Several process stakeholders thought that a direct alignment with the standard was not applicable in a real world setting: “I felt it was being a bit too clinical in the way questions were drilling down based on the standard. It was making it harder to relate it to real world application.”(SlM-EPS2)
In terms of efficiency, there was a wide consensus that the online survey requires less time, cost and resources to conduct compared with the manual assessment. This is not surprising given the level of automation achieved by the online survey. Over 80% of the comments were positive, for example: “…rather than six weeks’ worth of engagement, it could be just two days’ worth of engagement where you could specifically ask” (CoM-PM1)
There was one particularly interesting comment against the efficiency of the online survey. One of the process stakeholders suggested that an online survey that can be filled out anytime can encourage laggard behaviour: “A whole bunch of other work got done and I kept putting it [online survey] off and off.”(PrM-PP2)
The usefulness of the online survey in terms of representative and understandable questions had largely negative comments (72%). Consistent with the negative comments regarding effectiveness, there were a number of criticisms regarding the applicability of the survey questions due to the strict alignment of the survey with the standard. For example: “No, questions did not apply well to the process. I was reading some in the last sections and I was struggling to see how they applied to configuration management.”(CoM-PP1)
A process stakeholder suggested that the survey questions demanded background knowledge of the terminology used in the question, particularly from the ITIL® framework. Therefore questions would be harder to answer for someone without the knowledge of the terminology, irrespective of their actual process roles: “I think you will get different responses depending on whether someone has done formal ITIL as opposed to just having a fairly good understanding on how the processes work.”(SlM-PP1)
A universal recommendation to improve the usefulness of the online survey was to provide relevant examples along with the questions: “I found that the examples helped. The examples were more meaningful than the questions, whenever there was an example.”(PrM-PP1)
The three direct comments regarding validity of the online survey were all positive. One of the stakeholders suggested that the trustworthiness of the survey promotes transparency in the assessment exercise: “you could see what the tool [online survey] was trying to achieve. You could see what was being asked, how it was progressing because it was asking greater levels of details as you went along.”(CoM-PM1)
Finally, more than 80% of comments were positive regarding the ease of using the online survey. Almost all survey respondents were happy with the clean interface of the online survey in terms of the colour, layout and format. For example: “colours, layout, sequencing, flexibility in terms of resource requirements it worked quite well on our PCs, there wasn't any problem.”(SlM-PM1)
Design Process Evaluation
The design process evaluation was conducted as an iterative design process with multiple cycles of formative evaluations in order to explicate the rigour of the design process. These evaluations attempted to assess if the process of developing the SMPA approach in terms of design process and research method has rigour, relevance and aligns well with the DSR methodology.
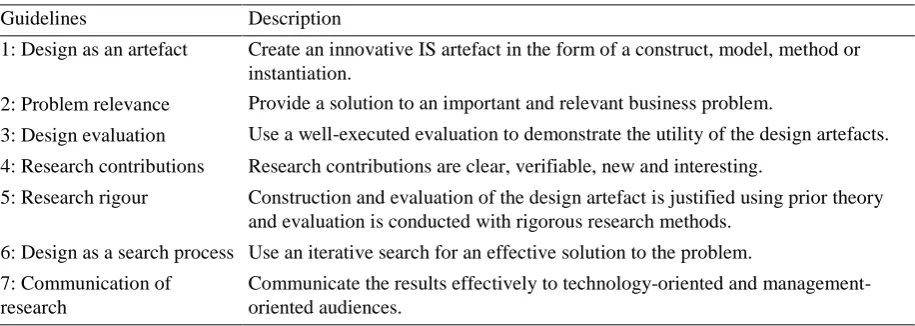
Table 4. Design science research guidelines, drawn from Hevner et al. (2004).
Guidelines Description
1: Design as an artefact Create an innovative IS artefact in the form of a construct, model, method or instantiation.
2: Problem relevance Provide a solution to an important and relevant business problem.
3: Design evaluation Use a well-executed evaluation to demonstrate the utility of the design artefacts. 4: Research contributions Research contributions are clear, verifiable, new and interesting.
5: Research rigour Construction and evaluation of the design artefact is justified using prior theory and evaluation is conducted with rigorous research methods.
6: Design as a search process Use an iterative search for an effective solution to the problem. 7: Communication of
research
Communicate the results effectively to technology-oriented and management-oriented audiences.
Design as an artefact. This project has resulted in the development of an approach to facilitate transparent and efficient process assessments for IT service providers in their quest towards service improvement. The SMPA approach is an innovative method and the outputs are not only accessible to practitioners, but also more fine-grained and readily corroborated with evidence.
Problem relevance. The SMPA approach is a response to the research opportunities that emerged based on the shortcomings of the existing ITSM process assessment approaches in the ITSM industry. It can be argued that the ongoing problem of ambiguity and costly IT service process quality measurements requires a “theory for design and action” (Gregor 2006, p. 611) for guiding process assessments. The SMPA approach is therefore addressing a relevant problem in the industry.
Design evaluation. In order to evaluate the usability of the SMPA approach, the international standard of software quality in use ISO/IEC 25010 has been applied in this research. A DSR evaluation reporting structure based on a logic model has been used to communicate design evaluation.
Research contributions. The development and evaluation of the SMPA approach indicated the approach can provide a fine-grained analysis of the IT service processes of an organisation. The approach is efficient and transparent due to the use of standard assessment models. The evaluation of usability of the online survey in the SMPA approach has shown a benefit to IT service process stakeholders.
Research rigour. The design and evaluation of the SMPA approach includes a careful justification of each step using standard guidelines, theoretical insights and evidence from case studies. As part of the research project, the design, construction and evaluation of the design artefact has used established research frameworks.
Design as a search process. This study used ongoing comparisons between existing process assessment approaches, guidance from extant kernel theories, and case study evidence to develop a transparent and efficient SMPA approach. Earlier iterations of method development and evaluation fed into further analysis and development of the SMPA approach.
Communication of research. The research findings have been disseminated through academic and practitioner outlets. Through case studies and practitioners’ seminars, feedback indicated the SMPA approach is accessible to both researchers and practitioners. DSR publication schema (Gregor & Hevner 2013) and the DSR evaluation reporting structure proposed in this paper provided useful templates to communicate the DSR research.
Evaluation Findings
The scope of our case study DSR research was principally to evaluate the short-term outcomes - the first-level evaluation outcome. However, deeper analysis of evaluation findings and further iterations evaluation may uncover interesting intermediate and long-term outcomes with lasting implications for research and practice. In our case, the intermediate outcome may provide a set of requirements for a hybrid approach combining the SMPA with manual process assessments for process improvement. Likewise, a long-term evaluation may find that repeated use of the SMPA approach facilitates continual service improvement in ITSM.
CONCLUSION
Although evaluation plays a major part in DSR, very little guidance and examples have been provided of how one could actually communicate this part of DSR. To address this need, we have presented a DSR evaluation reporting structure based on a simple logic model along with an example of a real-life DSR case study where the structure is applied. Reporting on the evaluation of the SMPA approach suggests that key insights can be drawn from the DSR evaluation reporting structure that can potentially impact and improve the way the DSR evaluation process is communicated. Our research addresses the opportunity to explore how the concepts of a logic model from the program evaluation discipline might inform DSR evaluation. We will continue to investigate how the proposed reporting structure could be applied in other DSR evaluations and whether this can promote transparency and clarity in communication of DSR evaluation work. Another future research direction could examine previous DSR papers and catalogue the types of structure used to report evaluation. Then it could be ascertained if elements were missed during evaluation or reporting of evaluation, providing valuable insights as to how the previous DSR papers could have benefited from use of our structure.
In providing our DSR evaluation report as an exemplar case study, we presented the reporting structure in adequate detail to allow for potential replication, and confirmation of findings. We hope other researchers can use the proposed reporting structure as a template to communicate evaluation results. It can be argued that this example is only useful to very limited instances of DSR evaluation since it reports an ex-post evaluation of one artefact in a single organisation. However we argue that formative DSR evaluations where multiple cycles of “design-evaluate” are conducted can also follow the proposed reporting structure and therefore, a more general view should be taken. Although we agree on the broader perspective, our intention for this paper is to give researchers an example of how DSR evaluation can be reported to showcase the impact of the research work. To conclude, this paper contributes to the IS community because prior work has not adequately addressed the important question of how design science evaluation work can be communicated? We have made a contribution to the growing body of guidelines for DSR research. Further research is needed to gain experience in reporting evaluation of DSR artefacts and to refine our novel template to communicate DSR evaluation methods.
REFERENCES
Barafort, B., Betry, V., Cortina, S., Picard, M., St-Jean, M., Renault, A. and Valdès, O. 2009. ITSM Process Assessment Supporting ITIL. Zaltbommel, Netherlands: Van Haren Publishing.
Benbasat, I. and Zmud, R.W. 2003. “The Identity Crisis within the IS Discipline: Defining and Communicating the Discipline's Core Properties,” MIS Quarterly (27:2), pp 183-194.
Carlsson, S.A., Henningsson, S., Hrastinski, S. and Keller, C. 2011. “Socio-technical IS Design Science Research: Developing Design Theory for IS Integration Management,” Information Systems and e-Business Management (9:1), pp 109-131.
Checkland, P. and Scholes, J. 1990. Soft Systems Methodology in Practice. 1st edn. Chichester, UK: J Wiley. Furneaux, B. and Wade, M. 2009. “Theoretical Constructs and Relationships in Information Systems Research,”
In Yogesh Dwivedi, Michael Williams, Scott Schneberger (eds.) Handbook of Research on Contemporary Theoretical Models in Information Systems. PA, USA: Information Science Reference, pp 1-17.
Gregor, S. 2006. “The Nature of Theory in Information Systems,” MIS Quarterly (30:3), pp 611-642.
Gregor, S. and Jones, D. 2007. “The Anatomy of a Design Theory,” Journal of the Association for Information Systems (8:5), pp 312-335.
Gregor, S. and Hevner, A.R. 2013. “Positioning and Presenting Design Science Research for Maximum Impact,” MIS Quarterly (37:2), pp 337-355.
Hevner, A.R., March, S.T., Park, J. and Ram, S. 2004. “Design Science in Information Systems Research,” MIS Quarterly (28:1), pp 75-105.
Iivari, J. 2007. “A Paradigmatic Analysis of Information Systems as a Design Science,” Scandinavian Journal of Information Systems (19:2), Article 5.
ISO/IEC. 2004. “ISO/IEC 15504-2:2004 – Information Technology – Process Assessment – Part 2: Performing an Assessment,” Geneva, Switzerland: International Organization for Standardization.
ISO/IEC. 2011. “ISO/IEC 25010:2011 – Systems and software engineering – Systems and software Quality Requirements and Evaluation (SQuaRE) - System and software quality models,” Geneva, Switzerland. Julian, D.A., Jones, A. and Deyo, D. 1995. “Open Systems Evaluation and the Logic Model: Program Planning
and Evaluation Tools,” Evaluation and Program Planning (18:4), pp 333-341.
Lloyd, V. 2011. ITIL Continual Service Improvement. London, UK: The Stationery Office.
March, S.T. and Smith, G.F. 1995. “Design and Natural Science Research on Information Technology,” Decision Support Systems (15:4), pp 251-266.
McLaughlin, J.A. and Jordan, G.B. 1999. “Logic Models: A Tool for Telling Your Program's Performance Story,” Evaluation and Program Planning (22:1), pp 65-72.
Parnas, D.L. and Clements, P.C. 1986. “A Rational Design Process: How and Why to Fake It,” IEEE Transactions on Software Engineering (SE-12:2), pp 251-257.
Patton, M.Q. 1990. Qualitative Evaluation and Research Methods. Thousand Oaks, CA: SAGE Publications. Peffers, K., Tuunanen, T., Rothenberger, M.A. and Chatterjee, S. 2007. “A Design Science Research
Methodology for Information Systems Research,” Journal of Management Information Systems (24:3), pp. 45-78.
Peffers, K., Rothenberger, M., Tuunanen, T. and Vaezi, R. 2012. “Design Science Research Evaluation”, In 7th International Conference on Design Science Research in Information Systems, Las Vegas, NV: Springer. Prat, N., Comyn-Wattiau, I. and Akoka, J. 2014. “Artifact Evaluation in Information Systems Design Science
Research - A Holistic View,” In 18th Pacific Asia Conference on Information Systems, Chengdu, China. Pries-Heje, J. and Baskerville, R. 2008. “The Design Theory Nexus,” MIS Quarterly (32:4), pp 731-755.
Pries-Heje, J., Baskerville, R. and Venable, J.R. 2008. “Strategies for Design Science Research Evaluation,” In 16th European Conference on Information Systems, Galway, Ireland.
Rosemann, M. and Vessey, I. 2008. “Toward Improving the Relevance of Information Systems Research to Practice: The Role of Applicability Checks,” MIS Quarterly (32:1), pp 1-22.
Seidel, S. and Watson, R.T. 2014 “Improving the Societal Effectiveness of IS Research: The Pursuit of Prescriptive Accuracy.” Retrieved 09 August, 2014, from http://papers.ssrn.com/sol3/papers.cfm?abstract_id=2477917
Sein, M.K., Henfridsson, O., Purao, S., Rossi, M. and Lindgren, R. 2011. “Action Design Research,” MIS Quarterly (35:1), pp 37-56.
Vaishnavi, V. and Kuechler, W. 2004. “Design Science Research in Information Systems.” Retrieved 10 July, 2014, from http://www.desrist.org/design-research-in-information-systems
Van Aken, J.E. 2006. “The Nature of Organizing Design: Both Like and Unlike Material Object Design,” Eindhoven Center for Innovation Studies (ECIS), No. 06-13.
Venable, J., Pries-Heje, J. and Baskerville, R. 2012. “A Comprehensive Framework for Evaluation in Design Science Research,” In 7th International Conference DESRIST, Las Vegas, NV: Springer-Verlag.
Walls, J.G., Widmeyer, G.R. and El Sawy, O.A. 2004. “Assessing Information System Design Theory in Perspective: How Useful was our 1992 Initial Rendition,” Journal of Information Technology Theory and Application (6:2), pp 43-58.
COPYRIGHT