Adapting to climate change: perspectives from rural communities in Lombok, eastern Indonesia
189
0
0
Full text
(2) Adapting to Climate Change: Perspectives from Rural Communities in Lombok, Eastern Indonesia. Thesis submitted by Lalu Adi Gunawan. MEnvMgmt, Flinders University. June 2015. For the Degree of Doctor of Philosophy In the College of Marine and Environmental Sciences Faculty of Science and Engineering James Cook University.
(3) ii.
(4) PREFACE. Lombok is one of the poorest islands in Indonesia, where people suffer many hardships. Poverty, environmental degradation and economic volatility are constant problems. Climate variability is increasingly exacerbating the challenges that people face. In 2009, I attended a workshop about the impacts of climate change on small islands, which was held by the World Wildlife Fund’s (WWF) Nusa Tenggara office. Since then, I have held discussions with WWF and many other institutions from my position in the provincial government. I have tried to understand how to integrate climate issues into development planning. I have become convinced that rigid scientific predictions derived from models are not going to solve the problems related to climate issues. It has become increasingly clear that a much better understanding of the factors that determine the ability of people to cope with climate fluctuations is needed, especially if there is to be any hope of helping them to deal with longterm change. In 2010, I was awarded an Australian Award Scholarship to pursue studies towards a Doctor of Philosophy degree. This gave me the opportunity to spend four years studying adaptation and development in rural areas of Lombok. As a development planner and local person, I have tried to demonstrate that rural communities in Lombok have endogenous strengths, which need to be reinforced if they are to deal with future climate uncertainties. My first visit in 2011 to the three study locations mentioned in this thesis brought a new insight for me as a researcher and development practitioner. In the three different locations, I saw that the stage of development differed, even though some development programs were implemented in similar ways. Each community had complex but distinct socio-economic problems. On the basis of this ‘first sight’, I began to question why different communities and households were more vulnerable than others, and how this related to their current level of development. The. i.
(5) research reported here is an attempt to find answers to the question of what pre-determines people’s ability to cope with climate variability and other changes in their livelihoods.. ii.
(6) ACKNOWLEDGEMENTS So which of the favors of your Lord (Allah) would you deny? (QS. Ar-rahman, 13) First and foremost, I express my deepest gratitude to Allah the Greatest, the Most Compassionate and Merciful. At the beginning of my plan to pursue a PhD, I was told by my colleagues that doing a PhD was not as easy as I might think. Another strong comment from my colleagues in the local development planning board in West Lombok District, claimed that a PhD is too high a degree for regular jobs in local government in Indonesia. In fact, I acknowledge that obtaining a PhD is not a stress-free journey (for sure!), but along the way, I have developed much knowledge and other valuable experiences that I have never encountered during my professional career. All of those experiences will be absolutely vital for local development in Indonesia. I would not have made it this far without a huge contribution from the many people I met throughout my journey. I would like to deliver my gratitude and acknowledgement to my supervisors, Professor Jeff Sayer, Professor Steve Turton, Dr. Intu Boedhihartono and Dr James Butler, for their endless support and motivation. They knew that I needed more support than others, as my progress was slow. I first met Professor Sayer and Dr Boedhihartono in Bali and later they agreed to supervise my PhD under the Development Practice Program, along with Professor Turton. The supervisory team was consolidated further when I met Dr Butler from the Commonwealth Scientific and Industrial Research Organisation (CSIRO) for the first time as he was leading research in West Nusa Tenggara Barat Province; his research coincidentally being in line with my PhD topic. My special gratitude goes to the Australia Awards Scholarships (AAS) Program for the second chance of pursuing study in Australia. I would like to thank the AAS liaison officers, Alex Salvador and Katherine Elliot, who were always there for any problems and complaints that I had. I send my gratitude to James Cook University, especially the Graduate Research School for providing the budget for data collection. I also thank the International Student Centre at James Cook University for providing continual support and regular free lunches. I send my big thanks to the most important contributors to this thesis, my friends (Pak Adi, Pak Saefudin, Pak Abidin and Pak Dul) and all participants and local organisations in the three villages, for their kindness and openness in sharing their knowledge and for being patient during all processes of data collection. I thank my colleagues and the Government of North and. iii.
(7) East Lombok, local non-government organisations (Konsepsi, Lumbung and Santiri) for new knowledge and experience of how to approach the community. Special thanks to my beloved family: my parents, Mamiq, Ibu, and my sisters, who kept asking about my study progress every time I phoned them. My sincerest gratitude is delivered to Shintia, my beloved wife, who gave me never-ending support when I felt low and discouraged; and my children, my sunshine: Aisyah and Akhtar, who brightened my everyday life. I always felt re-motivated every time my Aisyah said, ‘You can do it Daddy and I will be like you when I grow up!’ Big thanks also to my big brother, Mercy Rampengan, for sharing brotherhood and everything since the first time we met in Bali in 2010. Thanks also to my little sister Lingfei Weng (Lydia) for being a motivator for success.. iv.
(8) STATEMENT OF THE CONTRIBUTION BY OTHERS Supervision . Professor Jeffrey Sayer (Principal supervisor). . Professor Steve Turton (Co-supervisor). . Dr Agni Klintuni Boedhihartono (Associate supervisor). . Dr James Butler (Associate supervisor). Study design and analytical supports Aspect of assistance Proposal writing and study design, fieldwork. Nature of assistance, names and contribution I was helped by Professor Jeffrey Sayer and Dr James Butler to design my study and proposal writing. Dr Ilan Kelman helped during proposal writing and choosing the methods. Professors Jeffrey Sayer and Steve Turton, and Dr Intu Boedhihartono and James Butler accompanied me when pilot testing the methodology and evaluation.. Chapters writing and analytical assistance. I collected the data, designed the Chapter outlines, and analysed the data. Specific contributions were given as follows: Professor Jeffrey Sayer helped me restructure and edit Chapters 1, 2, and 5, and a potential paper based on Chapter 3; Dr James Butler supported me with the arguments and writing of Chapters 4, 6, and 7, and a potential paper based on Chapter 4; Professor Chris Margules helped me to refine and edit Chapters 1, 4, 5 and 6; Professor Steve Turton helped me to restructure Chapter 3 and with reviewing all chapters; Dr Intu Boedhihartono provided comments on the draft outline in Chapter 5; Mr Tri Hardianto from the Indonesian Central Bureau of Statistics assisted me with statistical analysis.. v.
(9) Research funding No. 1. 2. Agency/Institute Australia Award Scholarship (AAS) Program administered by the Department of Foreign Affairs and Trade (DFAT), Australia: Living allowance, tuition fees, travel (fieldwork and return home), Overseas Health Cover and Study Enrichment Allowance School of Earth and Environmental Sciences Post-Graduate Research Scheme TOTAL. $ (AUD) 232,388.63 (estimated value at the time of offer and excluding the 3 months extension). Period 2011-2015. 3000 3000 238,388.63. 2012 2013. Editorial support Professor Chris Margules Professor Jeffrey Sayer Professor Steve Turton Dr Intu Boedhihartono Dr James Butler Ms Jennifer Atherton Ms Elizabeth Poon Statistical analysis Mr Tri Hardianto (the Indonesian Central Bureau of Statistics) Ethics Approvals JCU Human Ethics Approval #H4663. vi.
(10) ABSTRACT Climate change and increasing variability will have especially profound adverse impacts upon the lives of rural communities in developing countries. However, households have differing asset bases and livelihood strategies, and therefore may have variable levels of vulnerability. Designing appropriate climate adaptation strategies must take these differences into account. This study examined the heterogeneity of vulnerability amongst rural communities in Lombok, Indonesia, and considers implications for climate adaptation policy interventions. Three villages, with differing natural resource bases, were selected as case studies: forest, rain-fed agriculture, and coastal fisheries and aquaculture. Based on a questionnaire survey (n=250), a household typology was generated. Cannon’s (2008) vulnerability framework was applied to analyse the factors driving vulnerability for each household type in the villages. Interviews (n=72) with individuals from different household types were also employed to determine their perceptions about vulnerability and adaptation preferences. Participatory focus group discussions and social network mapping were also utilised to triangulate causes of vulnerability and dependencies between household types. Three main key conclusions emerged. First, although climate variability contributes to increased livelihood vulnerability, the degradation of traditional institutions through modernisation and social change was considered to be a more serious problem. In particular, traditional institutions are an important source of adaptive capacity for poorer households. Second, community structures are complex, with different household types depending on one another for support. Social cohesion and mutual assistance are important for maintaining livelihood activities both in difficult times and during normal daily situations. Third, current development programs do not account for this variability of household types, their adaptation needs or the linkages between them. As a result, wealthier households benefit more than poorer ones, and there is little evidence of ‘trickle down’ benefits from rich to poor. This inequality could potentially lead to maladaptation. These patterns were similar across all case study villages. However, the dynamic interactions among households types differed based on the strength of social cohesion and local institutions. Therefore adaptation policies must be better designed and be more egalitarian. Specifically they must restore and maintain traditional institutions and social capital. The ‘vulnerability components framework’ from Cannon (2008) was used to identify necessary intervention points for different household types. These components are interlinked to each other and enable understanding of what causes some people to be more at risk of a hazard than others.. vii.
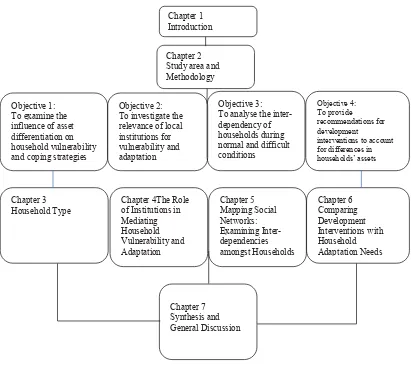
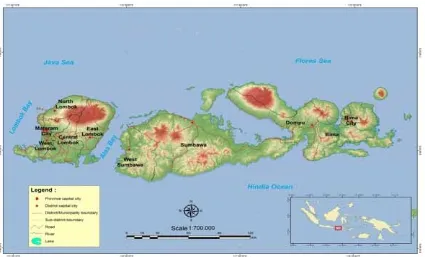
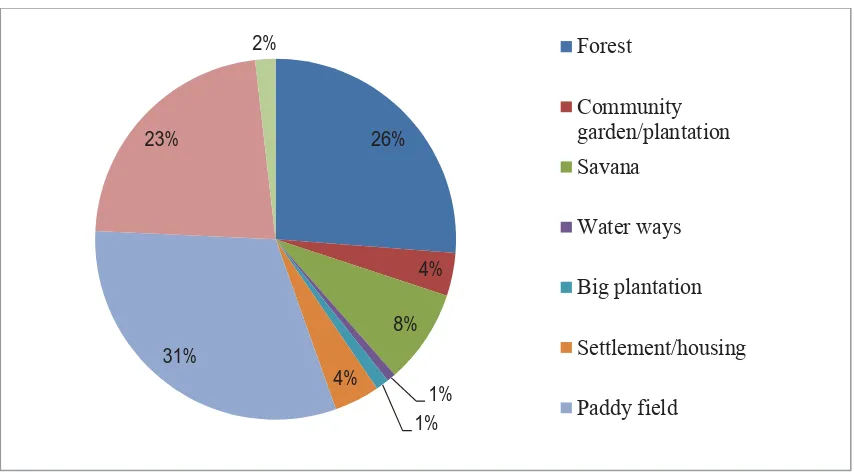
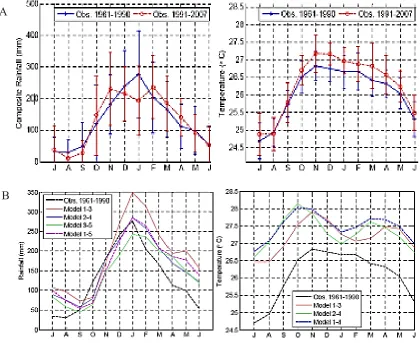
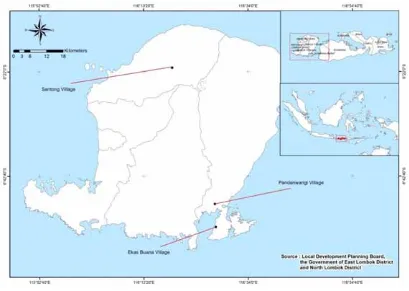
(11) TABLE OF CONTENTS PREFACE ............................................................................................................................................... i ACKNOWLEDGEMENTS ................................................................................................................... ii STATEMENT OF THE CONTRIBUTION BY OTHERS ......................................................................v ABSTRACT.......................................................................................................................................... vi TABLE OF CONTENTS ...................................................................................................................... vii LIST OF TABLES ............................................................................................................................. x LIST OF FIGURES ............................................................................................................................ xi CHAPTER 1: INTRODUCTION ........................................................................................................ 1 1.1 CLIMATE VARIABILITY AND CHANGE IN INDONESIA ........................................................................ 3 1.1.1 Climate Impacts ...................................................................................................................... 3 1.1.2 Policy responses at the national level ...................................................................................... 5 1.2 VULNERABILITY, LIVELIHOOD, ADAPTATION AND DEVELOPMENT: AN OVERVIEW ............................ 9 1.2.1 Contextualising vulnerability in times of rapid change ............................................................ 9 1.2.2 Vulnerability framework for analysis .................................................................................... 10 1.2.3 Livelihoods and global change .............................................................................................. 12 1.2.4 Adaptation and development ................................................................................................. 15 1.2.5 Vulnerability components for household analysis: framework of the study ............................ 18 1.3 RESEARCH AIM AND OBJECTIVES ................................................................................................... 22 1.4 THESIS ORGANISATION AND STRUCTURE........................................................................................ 22 CHAPTER 2:. STUDY AREA AND METHODOLOGY .............................................................. 25. 2.1 INTRODUCTION ............................................................................................................................. 25 2.2 STUDY AREA ................................................................................................................................. 25 2.2.1 Geography and land use ....................................................................................................... 25 2.2.2 Socio-economic characteristics ............................................................................................. 27 2.2.3 Climate variability and changes ............................................................................................ 29 2.3 STUDY LOCATIONS ........................................................................................................................ 31 2.3.1 General characteristics, livelihood activities and historical overview ................................... 31 2.4 METHODOLOGY ............................................................................................................................ 37 2.4.1 Understanding of patterns and stories using mixed methods: ................................................ 37 2.4.2 Research process .................................................................................................................. 39 2.4.3 Sampling methods ................................................................................................................. 41 2.4.4 Data collection and analyses................................................................................................. 41 2.5 CHAPTER SUMMARY ..................................................................................................................... 49 CHAPTER 3:. HOUSEHOLD TYPES ........................................................................................... 51. 3.1 INTRODUCTION ............................................................................................................................. 51 3.2 VULNERABILITY AND ASSETS: UNDERSTANDING THE LINK FOR ANALYSIS ...................................... 53 3.3 METHODS ..................................................................................................................................... 54. viii.
(12) 3.4 RESULTS ....................................................................................................................................... 54 3.4.1 Defining household types by livelihood asset attributes ......................................................... 54 3.4.2 Characteristics of livelihood assets in three villages ............................................................. 55 3.4.3 Underlying drivers of livelihood vulnerability asset groups ................................................... 64 3.4.4 Household types and coping decisions .................................................................................. 69 3.5 DISCUSSION .................................................................................................................................. 73 3.5.1 Asset type and determinant characteristics ............................................................................ 73 3.5.2 Vulnerability and coping strategies within household type .................................................... 74 3.6 CHAPTER SUMMARY ..................................................................................................................... 76 CHAPTER 4:. THE ROLE OF INSTITUTIONS IN MEDIATING HOUSEHOLD. VULNERABILITY AND ADAPTATION .......................................................................................... 79 4.1 INTRODUCTION ............................................................................................................................. 79 4.2 LINKAGES BETWEEN ASSETS AND INSTITUTIONS ............................................................................ 80 4.3 METHODS ..................................................................................................................................... 80 4.4 RESULTS ....................................................................................................................................... 81 4.4.1 Household type ..................................................................................................................... 81 4.4.2 Local institutions and livelihoods .......................................................................................... 82 4.5 DISCUSSION .................................................................................................................................. 86 4.5.1 Vulnerability components and livelihood asset type............................................................... 86 4.5.2 Asset structures and adaptation ............................................................................................ 87 4.5.3 Potential of hybrid institutions and institutional revitalisation .............................................. 88 4.6 CHAPTER SUMMARY ..................................................................................................................... 90 CHAPTER 5: MAPPING THE SOCIAL NETWORK: EXAMINING DEPENDENCIES AMONGST HOUSEHOLDS............................................................................................................... 93 5.1 INTRODUCTION ............................................................................................................................. 93 5.2 SOCIAL CAPITAL AND NETWORK ANALYSIS .................................................................................... 95 5.3 METHODS ..................................................................................................................................... 98 5.4 RESULTS ..................................................................................................................................... 100 5.4.1 The network structure ......................................................................................................... 100 5.4.2 Network centrality: the pattern of dependencies .................................................................. 103 5.4.3Network activities and responses ......................................................................................... 105 5.5 DISCUSSION ................................................................................................................................ 106 5.5.1 Household type and network structure ................................................................................ 107 5.5.2 Social networks and capacity .............................................................................................. 108 5.6 CHAPTER SUMMARY ................................................................................................................... 109 CHAPTER 6: COMPARING DEVELOPMENT INTERVENTIONS WITH HOUSEHOLD ADAPTATION NEEDS ..................................................................................................................... 112 6.1 INTRODUCTION ........................................................................................................................... 112. ix.
(13) 6.2 METHODS ................................................................................................................................... 114 6.2.1 Data collection ................................................................................................................... 114 6.2.2 Data Analysis...................................................................................................................... 115 6.3 RESULTS ..................................................................................................................................... 116 6.3.1 Development programs and their beneficiaries ................................................................... 116 6.3.2 Households Adaptation Priorities ....................................................................................... 117 6.3.3 Compatibility Analysis ........................................................................................................ 118 6.3.4 Interviews ........................................................................................................................... 121 6.3.5 Social networks and linked benefits ..................................................................................... 123 6.4 CHAPTER SUMMARY ................................................................................................................... 124 CHAPTER 7: SYNTHESIS AND CONCLUSION........................................................................... 126 7.1 MEETING THE AIM OF THE RESEARCH: UNDERSTANDING COMMUNITY DIVERSITY AS A FACTOR IN LOCALITY-SPECIFIC ADAPTATION ...................................................................................................... 126. 7.2 SYNTHESIS OF RESULTS AND FINDINGS ........................................................................................ 126 7.3 CHALLENGES FOR ADAPTATION POLICY AND DEVELOPMENT IN INDONESIA: AN EGALITARIAN OR UTILITARIAN APPROACH?.................................................................................................................. 128. A. Community variation and local institutions ............................................................................. 128 B. Vulnerability is determined by components of systems ............................................................. 129 C. Economic growth and social capital: some reflections ............................................................ 130 7.4 INSIGHTS FOR DEVELOPING COUNTRIES ....................................................................................... 132 7.5 RESEARCH CONTRIBUTIONS TO THE CLIMATE CHANGE AND ADAPTATION DISCOURSE ................... 133 7.6 LIMITATIONS OF STUDY ............................................................................................................... 133 7.7 FUTURE SCOPE OF RESEARCH ...................................................................................................... 134 7.8 CONCLUDING REMARKS .............................................................................................................. 135 REFERENCES................................................................................................................................... 136 APPENDICES .................................................................................................................................... 153 APPENDIX 1 QUESTIONNAIRE FOR SANTONG (FOREST COMMUNITY) AND PANDANWANGI (RAIN-FED AGRICULTURE) ................................................................................................................................. 153. APPENDIX 2 QUESTIONNAIRE FOR EKAS BUANA (COASTAL COMMUNITY) .......................................... 160 APPENDIX 3 THE RESULTS OF STEPWISE ANALYSIS ............................................................................ 167 APPENDIX 4 A COMPARISON OF WORD CLOUD ANALYSIS BETWEEN GOVERNMENT DOCUMENTS AND VULNERABILITY DRIVERS PERCEIVED BY RESPONDENTS IN THREE STUDY LOCATIONS ........................ 168. x.
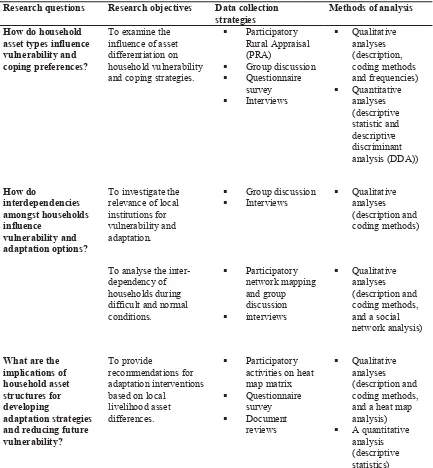
(14) LIST OF TABLES. Table 2.1 Total population, area, density, Human Development Index (HDI) and poverty rate of each administrative region in Lombok Island............................................................................ 29 Table 2.2 The correlation between research questions, objectives, data collection and analyses. .................................................................................................................................................. 42 Table 2.3 Themes in the questionnaire survey and sources of questions. .................................. 43 Table 2.4 Participatory tools and detail of activities in each study location. ............................. 45 Table 3.1 General characteristics (resources, livelihood activities and social characteristics) of livelihood asset Types 1-4, in three villages on Lombok island. ............................................... 57 Table 3.2 Respondents characteristics and frequencies ............................................................. 59 Table 3.3 Stepwise results of selecting significant variables* ................................................... 61 Table 3.4 Functions at group means (centroids) ........................................................................ 62 Table 3.5 Examples of detailed issues, mentioned most often by respondents that are perceived as increasing their livelihood vulnerability. ............................................................................... 68 Table 4.1 Characteristics of the three domains of local institutions and their benefits to household types in Ekas Buana ................................................................................................. 84 Table 4.2 Potential future interventions, by institution type, to support livelihood activities at Ekas Buana ............................................................................................................................... 88 Table 5.1 Characteristics of network structures (adapted from Prell, Hubacek & Reed 2009) .. 97 Table 5.2 Examples of activities in network interactions and responses. ................................ 106 Table 6.1 Current development programs in Ekas Buana and their targeted beneficiaries, nominated by interviewees. ..................................................................................................... 116 Tables 6.2 A-D: Compatibility analyses comparing adaptation priorities and current development programs among household types. Table 6.2A: Type 1 households; 6.2B: Type 2 households; 6.2C: Type 3 households and 6.2D: Type 4 households. Colour codes are: green = high compatibility (score = 2); yellow = indirect or medium compatibility (score = 1); red = no compatibility (score = 0). ........................................................................................................ 119. xi.
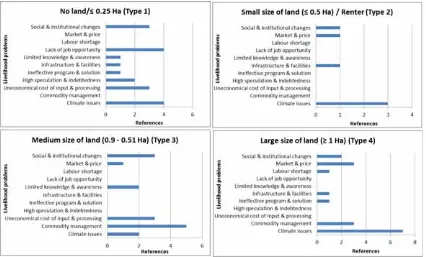
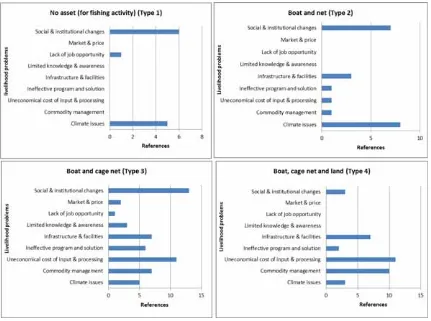
(15) LIST OF FIGURES. Figures 3.1 A-C. Cluster plots showing the separation trend of livelihood types in each village. The coloured circles indicate individual cases of analysis based on asset types. The ‘-’ and ‘+’ values (x and y axes) represent the direction of group classification.......................................... 64 Figure 3.2 A comparison of the perceptions of livelihood vulnerability drivers in Santong, by household type (Types 1-4)......................................................................................................... 65 Figure 3.3 A comparison of the perceptions of livelihood vulnerability drivers in Pandanwangi, by household type (Types 1-4). ................................................................................................... 66 Figure 3.4 A comparison of the perceptions of livelihood vulnerability drivers in Ekas Buana, by household type (Types 1-4). ................................................................................................... 67 Figure 3.5 Coping preferences in response to extreme weather events in Santong, by household type (Types 1-4). ......................................................................................................................... 70 Figure 3.6 Coping preferences in response to extreme weather events in Pandanwangi, by household type (Types 1-4)......................................................................................................... 71 Figure 3.7 Coping preferences in Ekas Buana ............................................................................ 72 Figure 5.1 Types of social capital (Aldrich 2012a). .................................................................... 96 Figure 5.2A-B. Network mapping process (A) and results (B). ............................................... 100 Figure 5.3 Network structure during normal conditions ........................................................... 102 Figure 5.4 Network structure during difficult times. ................................................................ 102 Figure 5.5 Degree of centrality during normal conditions. ....................................................... 104 Figure 5.6 Degree of centrality during difficult times. ............................................................. 105 Figure 6.1 Adaptation priorities identified by each household type in Ekas Buana, as a percentage of respondents from Type 1 (n = 16), Type 2 (n = 20), Type 3 (n = 32) and Type 4 (n = 12) households. .................................................................................................................. 118 Table 6.2A. Type 1 households................................................................................................. 119 Figure 6.3 Seaweed farming activities in Ekas Buana .............................................................. 122 Figure 6.4 The interaction of each household types based on 'labouring' link during difficult time ........................................................................................................................................... 123 Figure 7.1 A proposed vulnerability components framework for use in identifying the focus of interventions targeting particular groups in the community (adapted from Cannon (2008)).... 130. xii.
(16) Figures 3.1 A-C. Cluster plots showing the separation trend of livelihood types in each village. The coloured circles indicate individual cases of analysis based on asset types. The ‘-’ and ‘+’ values (x and y axes) represent the direction of group classification ......................................... 64 Figure 3.2 A comparison of the perceptions of livelihood vulnerability drivers in Santong, by household type (Types 1-4). ...................................................................................................... 65 Figure 3.3 A comparison of the perceptions of livelihood vulnerability drivers in Pandanwangi, by household type (Types 1-4). ................................................................................................. 66 Figure 3.4 A comparison of the perceptions of livelihood vulnerability drivers in Ekas Buana, by household type (Types 1-4). ................................................................................................. 67 Figure 3.5 Coping preferences in response to extreme weather events in Santong, by household type (Types 1-4). ....................................................................................................................... 70 Figure 3.6 Coping preferences in response to extreme weather events in Pandanwangi, by household type (Types 1-4). ...................................................................................................... 71 Figure 3.7 Coping preferences in Ekas Buana ........................................................................... 72 Figure 5.1 Types of social capital (Aldrich 2012a). .................................................................. 96 Figure 5.2A-B. Network mapping process (A) and results (B). .............................................. 100 Figure 5.3 Network structure during normal conditions .......................................................... 102 Figure 5.4 Network structure during difficult times. ............................................................... 102 Figure 5.5 Degree of centrality during difficult times. ............................................................ 105 Figure 6.1 Adaptation priorities identified by each household type in Ekas Buana, as a percentage of respondents from Type 1 (n = 16), Type 2 (n = 20), Type 3 (n = 32) and Type 4 (n = 12) households. ................................................................................................................ 118 Table 6.2A. Type 1 households ............................................................................................... 119 Figure 6.3 Seaweed farming activities in Ekas Buana ............................................................. 122 Figure 6.4 The interaction of each household types based on 'labouring' link during difficult time ......................................................................................................................................... 123 Figure 7.1 A proposed vulnerability components framework for use in identifying the focus of interventions targeting particular groups in the community (adapted from Cannon (2008)) ... 130. xiii.
(17)
(18) CHAPTER 1: INTRODUCTION There is a general consensus throughout the world that climate change will have especially profound adverse impacts upon the lives of the rural poor. According to the World Bank Development Report (World Bank 2009), around 70 percent of the world’s extremely poor people live in rural areas and their livelihoods depend on activities that are susceptible to climate change. The poor and marginalised have the least capacity to deal with the impacts of environmental changes (Metz & Kok 2008). Their poverty may be exacerbated by climate change and increasing climate variability and extremes. There are many reasons to believe that adverse climate impacts will be especially acute in the poorer, remote islands of eastern Indonesia. These impacts are likely to be highest in areas with weak institutions and where the people are particularly short of assets – education, savings, land, health – that might enable them to adapt to changes. The remote islands of eastern Indonesia are at great risk; they are isolated and have weaker government institutional capacities than the main islands in the west of the country. They also have the highest incidence of poverty in the country, experience highly variable climate conditions, and have a high level of dependence on agriculture (MoE 2010a). The percentage of the population experiencing chronic malnutrition ranges from 8 percent in a normal year, to 12 percent in El Niño years (Skoufias et al. 2010). Climate variation drives crop failure and has other severe impacts on agriculture, notably crop yields. However, a study conducted by Skoufias et al. (2010) on ‘Welfare Impacts of Rainfall Shocks in Rural Indonesia’ showed that the empirical evidence for welfare losses due to weather shocks is rather weak. The most vulnerable households were those that had low levels of income with limited assets and little access to resources and services. Household adaptation strategies and actions to deal with climate stressors have also received little attention (Skoufias et al. 2010). The complexity of individual situations creates a significant challenge in formulating climate adaptation policies at local and regional levels. Indonesia has a National Climate Change Adaptation Strategy (MoE 2007b), which was developed by the national government and disseminated to provincial and local administrative levels. Out of necessity, it is a very general document and it prescribes broad policy guidance; it does not, and could not, deal with the specificity of the multitude of situations found in the 17,000 islands of the Indonesian archipelago. In general, it prescribes actions that government agencies might take to help the population deal with climate change and increasing climate extremes. 1.
(19) The National Action Plan Addressing Climate Change (NAPACC) is expert-driven and presents a top-down view of how adaptation might be addressed. The Action Plan was developed in 2007 by the State Ministry of Environment, with contributions from several other related ministries, departments and institutions (MoE 2007b). It has been communicated to local governments at the provincial- and district-levels, but there is little evidence on the extent to which it has influenced the climate plans and programs of the provinces or regencies. There appears to have been minimal effort to draw upon local knowledge and behaviour in developing the plans. People throughout eastern Indonesia have a long experience of dealing with fluctuating climates. As a consequence of this, they have accumulated knowledge and local institutional arrangements that have enabled them to cope with climate variability and other livelihood changes in the past. In general, this local knowledge has not been taken into consideration in the development of government plans for climate adaptation. In fact, the complexity of socioecological contexts in eastern Indonesia varies from one community to another, even on a single island. A study conducted by Butler et al. (2014) in West Nusa Tenggara Province shows that vulnerability drivers are highly varied across the region. These drivers are categorised into three clusters: (i) political, developmental, climate and environmental change, (ii) economic growth and (iii) modernisation. Community structures and dynamics also have to be considered in developing future adaptation policies. My study addresses the fundamental gaps in adaptation policies adopted by Indonesian government at all levels. I examine the underlying attributes of a community’s vulnerability and adaptation needs, based on household asset structures. The asset structure describes the main sources of household livelihoods. The main hypothesis of my thesis is that social-ecological dynamics and linked asset structures require locally specific adaptation strategies. Understanding the vulnerability of asset structure groups to climate and other changes is not merely a technical challenge, it is a social and institutional challenge. I have sought to establish baseline information on existing coping strategies (Butler et al. 2014; Wise et al. 2014). Finally, I examine the issues that will need to be addressed in deciding whether to adopt a utilitarian approach to benefit as many people as possible; or an egalitarian approach which focuses on the poorest households (Brooks et al. 2011). There is also a need to identify interventions which will result in a ‘no-regrets’ policy for climate adaptation strategies (Christoplos 2010).. 2.
(20) 1.1 Climate Variability and Change in Indonesia 1.1.1 Climate Impacts Indonesia is an archipelagic country and is prone to climate-related stresses and other natural hazards (Rampengan et al. 2014). Climate variability and associated weather extremes have already had devastating impacts on several big cities on the main islands of the country (Case, Ardiansyah & Spector 2007), but it is especially threatening to the small islands, particularly those in oceanic locations (MoE 2007a). The increase in temperature in recent decades has triggered more frequent storms, strong winds and erractic rainfall patterns (Parry et al. 2007). This has had major impacts, particularly on people who already suffer from poverty and marginalisation; climate change and increasing weather extremes will make their lives even worse. Climate-related hazards and risks affect Indonesia in several different ways. WWF Indonesia has identified four main potential climate impacts in Indonesia (Case, Ardiansyah & Spector 2007). The first is changes in water and food availability. This is driven by the decline of precipitation in some parts of the country and this trend is projected to continue, particularly in the south-eastern provinces. Increasing duration and intensity of dry seasons will lead to greater frequency of droughts. Conversely, other parts of the country have experienced increases in rainfall which has led to flooding, especially in big cities such as Jakarta and Semarang. In 2007, it was reported in The Jakarta Post that the Jakarta floods inundated 145,742 houses, at least 57 people were killed, and 80 districts were affected. This triggered chaotic traffic conditions and damaged infrastructure (Bappenas 2007). Changes in water availability also hit the agriculture sector, where seasonality and rainfall changes led to declines in food production. The second potential climate impact is sea-level rise. The Fifth Assessment report for Asia by the Intergovernmental Panel for Climate Change (IPCC), reported that the increase in sea-level varied across coastal areas in Asia by 1-3 mm/year, depending on spatial location (Hijioka et al. 2014 ; IPCC 2014). This trend is projected to escalate to about 5.4 mm per year and could increase further in the next century. Sea-level rise is causing coastal erosion and destruction of fish nursery grounds. These changes will have serious impacts on the livelihoods of coastal communities, most notably of fishermen. The third potential climate-related impact is the loss of biodiversity and ecosystem services. This impact has many inter-related components. According to the IPCC’s Fourth Assessment report for Asia, climate change has the potential to put up to 50 percent of Asia’s total 3.
(21) biodiversity at risk (Cruz et al. 2007). The combination of effects of climate change and habitat fragmentation are likely causes of the increased risk of extinction (Hijioka et al. 2014 ). Changes in the distributions of plants and animals through the availability of suitable habitats are also projected in response to both direct and indirect impacts of climate change. For example, natural selection in Mongolian taiga forests has been reported to respond heterogeneously to recent climate changes, where regeneration of diverse species is more widespread than the increased growth of existing stands of larch. In marine ecosystems, 88 percent of coral reefs have been damaged globally and the degree of damage is expected to increase during the next 30 years (Wilkinson 2004 cited in Case, Ardiansyah & Spector 2007). The increase in carbon dioxide is also degrading marine ecosystems; for example, temperature rise and acidification combine to cause coral bleaching. Long periods of drought and strong winds are expected to trigger more frequent forest fires and this will be a threat to terrestrial habitats and native flora and fauna species. However, changes in climate could also benefit some areas: for example, the cereal-producing areas in northern and eastern Kazakhstan, Central Asia (Hijioka et al. 2014 ). Farmers in these areas are likely to have a longer growing season and warmer winters. The fourth climate-related impact is on human health. Temperature increases and more extreme weather events will provoke changes in the distribution and frequency of vector-borne and water-borne diseases, especially diarrhoeal diseases, which will increase morbidity and mortality (Checkley et al. 2000). During rainy periods dengue fever is also expected to rise (PEACE 2007). Eastern Indonesia has additional problems as several of the poorest provinces lie along the El Niño Southern Oscillation (ENSO) gradient. They are likely to suffer from food shortages caused by droughts and erratic rainfall (United Nations Development Programme 2007). For example, in East Nusa Tenggara province (West Timor, East Sumba and islands east of Flores), most of the local communities already suffer from climate variations. A report from the United Nations Development Program (UNDP) (2007) argued that this situation is exacerbated by poor soils and the lack of availability of alternative food sources. As a consequence, more than one third of the population in many of these districts live below the poverty line. Figure 1.1 shows the concentration (percentage) of people living below the poverty line in Indonesia, and notes the higher concentration of poverty in eastern provinces (dark red color). Erratic rainfall patterns also disrupt water supplies, both for irrigation and drinking water (United Nations Development Programme 2007). On Lombok and Sumbawa islands (West 4.
(22) Nusa Tenggara Province), the variability of rainfall has reduced the number of permanent water sources from 580 to 180, and has depleted the water levels of main rivers in the regions (Bappeda NTB 2010a).. Legend (% > 35 25 - <35 20 - <25 15 - <20 10 - <15 0 - <10 Urban area/ No data Province Boundary. Figure 1.1 Map of the proportion (%) of people living below the poverty line (DKP 2009). 1.1.2 Policy responses at the national level Regulations and policy The Indonesian government has made climate change mitigation and adaptation a top priority in its development strategies. The National Action Plan Addressing Climate Change (NAPACC) was developed in 2007. This document is part of the formal commitment of all countries who signed the United Nations Framework Convention on Climate Change (UNFCC) (Agrawal 2008). In Indonesia, the development of the NAPACC was led by the State Ministry of Environment with contributions from several other related ministries, departments, and institutions (MoE 2007b). There are three main themes in the document: mitigation, adaptation and institutional capacity improvement. The plan describes several strategies to increase resilience in six of the highest risk sectors: (i) agriculture, (ii) coastal and marine fisheries, (iii) infrastructure, (iv) health, (v) forestry and (vi) biodiversity. The NAPACC proposes an institutional arrangement for climate adaptation in all sectors which are heavily reliant on national government departments and institutions. The role of provincial and local governments and of civil society and local stakeholders receives little attention in the document. 5.
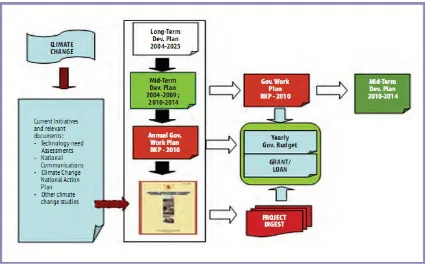
(23) In response to the NAPACC, the Indonesian government, through its National Development Planning Agency or Badan Perencanaan Pembangunan Nasional (BAPPENAS), has prepared a ‘National Development Planning Response to Climate Change’. This is referred to as the ‘Yellow Book’ (MoE 2010a). The main purpose of this book is to integrate climate change strategies into general development planning. The basic principle is that climate change strategies must involve all sectors and be based upon intense coordination amongst all stakeholders. The objectives of the Yellow Book are: (i) to integrate climate change programs as a part of national development planning (ii) to present sectoral and cross-sectoral priorities on climate change within the framework of sustainable development (iii) to provide an overview of funding mechanisms and institutional arrangements (iv) to provide clear guidance for development partnerships on climate change. The Yellow Book is used as a bridging document to allow climate issues to be incorporated into future development plans (MoE 2010a). It specifically targets the Mid-term Development Plan or Rencana Pembangunan Jangka Menengah Nasional (RPJMN) for 2010-2014, and the government annual work plan, or Rencana Kerja Pemerintah (RKP 2009, 2010). The RPJMN identifies sectoral and cross-sectoral issues, and makes budget allocations (Figure 1.2).. Figure 1.2 Flowchart showing the process involved in the development of the Indonesian Climate Change Sectoral Roadmap (ICCSR) (MoE 2010a). The integration of climate change and development programs is expected to be achieved through the Indonesian Climate Change Sectoral Roadmap (ICCSR). This is intended to exploit 6.
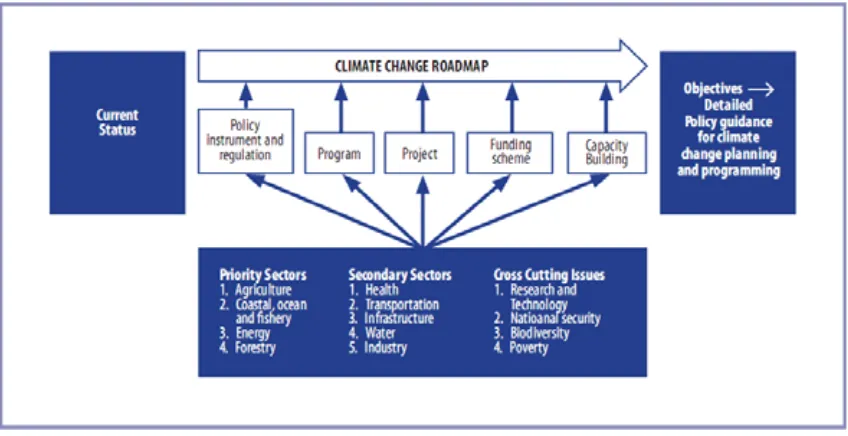
(24) synergies between the climate actions planned within development sub-sectors (Bappenas 2010). The ICCSR describes sectoral policies, strategies and programs for adaptation to and mitigation of climate change. The sectoral road map also provides detailed technical descriptions of sectoral policy directions and long-term sectoral commitments to emission reductions and adaptation measures (Figure 1.3).. Figure 1.3 Flowchart showing the process involved in the development of the Indonesian Climate Change Sectoral Roadmap (ICCSR) (MoE 2010a). The ICCSR also provides guidance for financial resource allocations especially from international donor agencies. In conjunction with the climate change program referred to in the Yellow Book, the Indonesian government has developed an integrated financing institution in order to pool all financial resources provided by donors (Simamora 2008). The Indonesian Climate Change Trust Fund (ICCTF) has been developed to promote coordinated action to respond to climate change (Bappenas 2009). The rationale for the development of the ICCTF is to mobilise external funds to support climate change measures, and also to serve as a means to support the sectoral roadmap in mainstreaming climate change issues into national development plans. The specific objectives of the ICCTF are: (i). to align donor support for climate change actions with Government of Indonesia (GoI) policies. (ii). to improve targeting of investment in climate change using decentralised structures. (iii). to accelerate priority investment in climate change mitigation and adaptation measures which the GoI cannot support with its own means. (iv). to prepare and promote a comprehensive policy framework for mitigation and adaptation. (v). to facilitate private sector investment in climate change initiatives. 7.
(25) Knowledge disparities and unclear direction In September 2009, the president of Indonesia, Susilo Bambang Yudhoyono, announced a commitment of Indonesia under his leadership to voluntarily reduce domestic greenhouse gas (GHG) emissions by 26 percent from the ‘Business As Usual’-level by the year 2020. The declaration included information on several focus areas (degraded and potentially degraded areas) and sectors (such as transportation, forest and land use change) that would be priorities in achieving Indonesia’s 26 percent emissions reduction target. Subject to adequate international support, this target could be raised to 41 percent (MoE 2010a). This pledge was made by the president at the summit held during the Conference of the Parties (COP-15) of the UNFCCC on 19th January 2010. This conference, which was attended by 115 world leaders from both developed and developing countries, was claimed to have obtained the highest ever political commitment to constrain carbon and respond to climate change, in both the short- and longterm. In response to this commitment, Indonesia has increased its efforts to reach its targets, both for climate change mitigation and adaptation. However many challenges remain, especially in disseminating information to all local governments, private institutions and communities. Disparities of knowledge and information have impeded the progress of central government in reaching the target of reduced GHG emissions. Zulkifli Hasan, a previous forestry minister, stated that ‘many of the regents (heads of districts) do not understand climate change’ (Jakarta Post 2011). The disparities of information and knowledge about climate change adaptation and mitigation policies in Indonesia may compound development problems and encourage corruption, due to unclear guidance of what outcomes are being sought. Furthermore, it is apparent from the policy responses listed, that climate change strategies in Indonesia have prioritised mitigation, even though several documents assert the importance of achieving a balance between adaptation and mitigation. The climate institutions and taskforces will face many challenges in program implementation. These challenges may be triggered by many factors, such as the low capacity of local government, knowledge disparities and high levels of political dependency. In fact, climate change actions may become marginalised given the gravity and number of other sectoral problems and the general underperformance of many sectoral and regional institutions.. 8.
(26) 1.2 Vulnerability, livelihood, adaptation and development: An overview 1.2.1 Contextualising vulnerability in times of rapid change Vulnerability is a complex and contested concept amongst different interest groups. This is especially true in the context of global environmental change, where definitions of vulnerability are often debated. Weichselgartner (2001) argued that different understandings of the concept of vulnerability derive from epistemological orientations and methodological practices. At a practical level, understanding of vulnerability is influenced by the types of hazard and their scale, context and location. Weichselgartner (2001) describes three different approaches to vulnerability studies. The first approach describes a pre-existing condition and emphasises the degree of vulnerability to biophysical and technological hazards. It is derived from hazards and disaster studies. In this field, concepts of vulnerability arise from different epistemological perspectives and practical methodologies. Two main factors to consider are: (i) the vulnerability of the system and its capacity to act, along with the extent of impact of the hazardous events (Timmerman 1981) and (ii) a human-centred approach, where the individual or group is the vulnerable object, which may also be applied to other entities such as community or place (Lewis 1999; Lewis & Kelman 2010; Wisner et al. 2004). From a public health perspective, vulnerability is characterised by ‘at risk’ and ‘risk factors’. For example, individuals or communities can become victims of certain diseases through exposure to infectious agents (Schwarzer 1994). The second approach to vulnerability studies considers the capacity to respond to particular hazards, especially in the context of the social construction of vulnerability derived from historical, socio-cultural and economic processes of societies. From humanitarian assistance fields, the ‘vulnerability concept’ focuses on the emergency and recovery response to any disaster or conflict which are regarded as potentially causing ‘immediate or imminent’ harm (Von Braun 1991; Watts & Bohle 1993; Wisner 2009). The third approach is a combination of the first two and is derived from biophysical conditions and social preparedness in specific locations. This last approach comes from development studies which have focused on the concept of ‘deprivation traps’ linked to livelihood (Chambers & Conway 1991; Scoones 1998). ‘Deprivation’ is defined as the poverty line, which is measured in terms of income. The effort to raise the line needs to understand other dimensions of poverty and well-being. Therefore, this concept embraces all elements that relate to a feature 9.
(27) of livelihood security and insecurity which also involve seasonality and health. More recently, the concept has included climate change as one component of analysis. In the context of this study, I perceived that vulnerability is largely conceived as the absence of capacity to deal with natural hazards, including hazards triggered by climate change, because it is constrained by economic power and authority. Therefore, I revisit the concept of vulnerability from Wisner et al. (2004, p. 11), who defined vulnerability as ‘the characteristics of a person or group and their situation that influence their capacity to anticipate, cope with, resist and recover from the impact of an extreme natural event or process’. This definition also incorporates sustainability and livelihood ‘capital or assets’, allowing the analysis of seasonality, health and natural resources as contributing factors to vulnerability (Scoones 1998, 2009).. 1.2.2 Vulnerability framework for analysis From conceptual understandings, vulnerability concepts then developed into practical frameworks for assessment and analysis. The multi-dimensionality of vulnerability assessment frameworks has been recognised in numerous studies at different scales (administrative, social ecological or economic), and various disciplines (Eriksen & Kelly 2007; Fussel 2007; Kelman 2011; OBrien et al. 2007; Wisner et al. 2004). Cutter (1996), among others, proposed a ‘hazard of place model’, which highlighted the importance of an integrated consideration of vulnerability assessment, including the integration of biophysical and social elements. Turner et al. (2003) developed a vulnerability framework by integrating several key components, including exposure, sensitivity, short-term and long-term responses to potential hazards. A framework for identifying factors or indicators of underlying vulnerability was also developed by Eriksen and Kelly (2007); they identified key requirements of vulnerability indicators to climate change in secondary data. Wisner et al. (2004) developed the Pressure and Release (PAR) model to examine the contextual processes underlying vulnerability. This model focuses on progression of vulnerability in creation of disasters through the ongoing connecting process of ‘root causes’, ‘dynamic pressures’, and ‘unsafe conditions’, which meet the potential natural hazards criteria (Wisner, Gaillard & Kelman 2011). The PAR framework helps to understand the complexity of social and environmental long-term consequences of disastrous events. In this model, root causes are a reflection of the real conditions (when a disaster happens) and distribution of power in a society. These can create unsafe conditions through dynamic processes. Different forms of unsafe condition (such as weak human capacity, degradation of natural resources, low income and unsafe living conditions) put people or a 10.
(28) society in a vulnerable condition and makes them susceptible to disasters when climate or other hazards occur. In this context, nature is perceived as providing an ‘opportunity’ by providing resources to improve livelihoods and meet direct human needs; but at the same time nature can be a ‘hazard’ as extreme natural events become more frequent and extreme, and impact more forcibly on human activities. Therefore in the PAR model, climate change is considered as a long-term process of natural changes that creates both opportunities and hazards at the same time (Kelman & Gaillard 2008; O'Brien et al. 2006; Wisner, Gaillard & Kelman 2011). In general, all frameworks are complementary and largely provide for the needs of policymakers. ‘Asset vulnerability’ frameworks (Moser 1998) and ‘asset-based’ approaches to social risk management (Siegel & Alwang 1999) provide slightly different concepts. In the first framework, Moser (1998) emphasised the asset management of urban poor populations in reducing their vulnerability by accumulating tangible and intangible assets. This framework moved from the static measurement of the poor, which only captured income-poverty assessment, to a more comprehensive approach to asset portfolio management. In line with this, the second framework is related to asset-based risk management strategies. According to this approach (Siegel & Alwang 1999), risk management strategies depend on: (i) household wealth, which is manifested in the quantity and quality of the asset portfolio perception of risky events and outcomes (ii) management objectives (iii) the availability of risk management instruments.. These two frameworks focus on assets as being central to increase the adaptive capacity and reduce the vulnerability of poor people. As Siegel and Alwang (1999, p. 10) stated, ‘Risk management strategies are household-specific and can change over time as conditions change’. In this study, I use ‘asset vulnerability’ frameworks and ‘asset-based’ approaches to social risk management, to address the specific and contextual aspects of the vulnerability of different assets using vulnerability components (Cannon (2008). I will explain these components further in Section 1.3.4, as part of the framework of this study.. 11.
(29) 1.2.3 Livelihoods and global change The ‘livelihood concept’ captures the capabilities and resources needed to sustain the basic needs of individuals, communities or societies. The concept of ‘sustainable livelihoods’ is based on the three fundamental principles of capability, equity and sustainability (Chambers & Conway 1991). According to Chambers & Conway (1991), a sustainable livelihood represents the capability of people to sustain their lives by maintaining, or gaining, basic needs. Furthermore, they argue that a livelihood is sustainable if it has the ability to cope with and recover from stresses and shocks; can maintain capabilities and assets; enhance well-being in terms of income; and provide equity and a livelihood for future generations at all scales and levels (Chambers & Conway 1991). ‘Stresses’ refers to the gradual process of disturbing forces such as long drought; population pressures on resources; effect of climate variability on agriculture productivity; and ecological change leading to bio-economic productivity. ‘Shocks’ refers to sudden disturbing forces such as floods, droughts, earthquake, storms, famines and landslips. The ‘sustainable livelihood concept (SL)’ has been incorporated into development programs and activities, especially as a framework for analysing poverty reduction and assessing development outcomes (Ashley, Carney & Britain 1999; Sayer et al. 2007; Scoones 1998). The concept has been the subject of continuous development in the last 15 years, and has been widely adopted by many international aid agencies and non-government organisations (NGOs), such as Care, Department for International Development (DFID), Oxfam and United Nations Development Programme (UNDP) (Dazé, Ambrose & Ehrhart 2009; Ellis 2000b; Sayer & Campbell 2004; Stanford et al. 2014; Tittonell 2014). Drawing from the definition of sustainable livelihoods above, Scoones (1998, pp. 5-7) recognised five indicators for assessing the sustainability of livelihoods, which have been adopted in policy discourse world-wide. They are: (i). labour opportunities for livelihood benefits. (ii). poverty reduction. (iii). well-being and capabilities. Indicators can be identified to assess material livelihoods (e.g. income and food), as well as factors such as self-esteem, security, happiness, stress, vulnerability, power and exclusion. (iv). livelihood adaptation, vulnerability and resilience, which refers to the ability of a livelihood to deal with stresses and shocks from external disturbances and changes; also known as coping and adapting capacity. 12.
(30) (v). natural resource basis of sustainability, which refers to the resilience of the environment and its ability to maintain productivity and provide livelihood services when shocks or stresses have occurred.. Agrawal and Perrin (2009) classified the basic coping and adaptation responses applied to livelihood risks into four categories: (i) mobility, (ii) storage, (iii) diversification and (iv) communal pooling. They argued that livelihoods and adaptation in rural households are highly influenced by the role of local institutions in distributing climate risk impacts, organising incentive structures for households and communities, and mediating external interventions to adapt them to the local setting. In pursuing sustainable livelihood strategies, people have different options, depending on their tangible and intangible assets. Much of the literature describes five categories of capital assets that are commonly used to assess or describe sustainable livelihoods world-wide (Bebbington 1999; Sayer et al. 2007; Scoones 1998) (Figure 1.4). They are (i) financial or economic capital, (ii) natural capital, (iii) human capital, (iv) social capital and (v) physical capital.. Levels of biodiversity. Figure 1.4 Indicators for the five capital assets (adapted from Sayer et al. 2007). 13.
(31) Scoones (1998) argues that the combination of these capital assets defines livelihoods based upon personal capabilities, tangible assets (e.g. stores and material resources) and intangible assets (e.g. claims to and access to resources). This is not to say that livelihood is not a matter of material well-being, but rather that it also includes non-material aspects of well-being. Livelihood should be seen as a dynamic and holistic concept. In the words of Bebbington (1999, p. 2022): A person’s assets, such as land, are not merely means with which he or she makes a living: they also give meaning to that person’s world. Assets are not simply resources that people use in building livelihoods: they are assets that give them the capability to be and to act. Assets should not be understood only as things that allow survival, adaptation and poverty alleviation: they are also the basis of agents’ power to act and to reproduce, challenge or change the rules that govern the control, use and transformation of resources.. The position of assets in the livelihood system, as stated by Bebbington (1999), is closely aligned to the focus of my study. Livelihood approaches should address the transforming structures and processes (DFID 1999), policies, institutions and mediating institutions and organisations (Ellis 2000b; Leach, Mearns & Scoones 1999; Scoones 1998). The transforming structures are related to institutional arrangements that operate in all levels from household to the international arena, including private and public entities. Morse (2013) listed six challenges of the livelihood approach, with regards to livelihood assets and policy implementation (Morse 2013, pp 43-46). Three of them were relevant to this thesis: (i). the paradox of a ‘people-centred’ approach. The existence of ‘people’ is questionable in livelihood analysis even though there is ‘Human capital’. It explains institutions, policies and influences but these aspects do not represent ‘people’ as a centre of analysis. Instead, the livelihood approach needs to focus on ‘culture’ as an important attribute to understand people. (ii). the complexity of measuring and analysing livelihood assets. (iii). the limitations of vulnerability analysis, especially for unpredictable shocks and risks caused by both natural and non-natural hazards, which affect the resilience of people in the face of those hazards (Kelman & Mather 2008).. 14.
(32) As Sayer (2009 p. 10) argues, the improvement of people’s livelihoods should not only focus on ‘what the people are doing now, but what they might do in future in facing economic challenges’. To address the three limitations of livelihood above, one suggestion is for livelihood approaches to be carried out or designed at the relevant scale (e.g. at the household-level).. 1.2.4 Adaptation and development Global climate change policy initially focused on collective negotiation of urgent action to reduce greenhouse gas emissions caused by human activities. The international community agreed to address mitigation and adaptation as climate change policy responses, which were ‘complementary’, ‘substitutable’, or ‘independent’ of each other (IPCC 2007). Climate change adaptation was to be addressed across global and local scales, through international, national, and local government actions, with the aim of reducing vulnerability to the expected impacts of climate change (United Nations Framework Convention on Climate Change 2007). Climate change adaptation is now perceived as being central to many development programs in both developed and developing countries. In fact, ‘adaptation’ has become a magic word for international donors supporting development assistance (Meadowcroft 2009; World Bank 2009). Literature on climate adaptation has expanded tremendously in the past few decades. Definitions of adaptation to climate change vary among scholars and context. However, adaptation cannot be separated from development. In this context, ‘development’ is related to the continuous process of improving human societies (Rist 2008). Therefore, this study takes a definition that encompasses sustainability in human dimension and livelihood activities. This study followed the definition from Rennie and Singh (1996, p. 18) who defined adaptation as ‘ways in which local individuals, households and communities have changed their mix of productive activities, and modified their community rules and institutions in response to vulnerabilities, in order to meet their livelihood needs and adapt to unpredictable changes including climate change’. In general, this definition addresses adjustment by humans in relation to improving their livelihood system, and at the same time reducing their vulnerability. Many scholars have identified the characteristics of adaptation based on purpose, occurrence, timeline and location (Ayers & Dodman 2010; Kates 1985; Klein, Schipper & Dessai 2005; Smit & Wandel 2006; Vogel et al. 2007). For instance, the definition of adaptation is similar to that of a coping mechanism (Huq & Reid 2004). The terms ‘anticipatory adaptation’ and 15.
(33) ‘reactive adaptation’ refer to the time of response to climate change impacts, where ‘anticipatory adaptation’ is taken before impacts occur; and ‘reactive adaptation’ is conducted after the impacts have taken place. Moreover, the terms ‘adaptation to climate variability’ versus ‘adaptation to climate change’ explain the difference in the root cause of climate change between human-induced and naturally occurring climate variability. In fact, both adaptation terms depend on the characteristics of climate stimuli such as temperature, precipitation, rainfall and salinisation. ‘Climate’ describes the interaction or dynamic changes in the atmosphere (weather) over a long period of time (e.g. years, decades, centuries) (Pittock, AB 2013). ‘Adaptation to climate variability’ is the response to variations in short-term climate conditions such as annual precipitation and any associated weather events. In contrast, ‘adaptation to climate change’ refers to adjustment in the face of new climate conditions, which may arise both naturally and through human activities over long periods of time (Pittock, A & Jones 2000; Smith et al. 2000). The literature distinguishes ‘planned adaptation’ from ‘autonomous adaptation’ to climate change (Nelson, Adger & Brown 2007; Pittock, A & Jones 2000). ‘Planned adaptation’ describes adaptation that takes climate change and variability specifically into consideration. In contrast, ‘autonomous adaptation’ refers to a spontaneous response that is not consciously triggered by climate stimuli, but is instead caused by ecological changes in natural systems and by market or welfare changes in human systems (IPCC 2007). In the context of long-term vulnerability, autonomous adaptation has limited application since it only considers ecological changes in natural systems and market and welfare changes in human systems. The definition disregards other spontaneous adaptation measures, such as changes from nature due to human efforts in conservation. The majority of the studies listed above also highlight the importance of human behaviour in climate change adaptation. This includes institutional dimensions and adaptation within social systems (Agrawal 2008; Christoplos et al. 2009; Fankhauser, Smith & Tol 1999; Smithers & Smit 1997). Putting emphasis on the human dimension has enriched the conceptual debate about climate adaptation. This notion is based on the fundamental concept that climate change adaptation cannot be separated from a long history of human development and risk management (Christoplos et al. 2009; Lewis 1999).. 16.
(34) The complexity of climate change impacts is inter-related with ongoing development practices. In this regard, many development agencies (e.g. the World Bank) have argued that adaptation should be integrated or mainstreamed into development agendas (Schipper 2007). This integration is supported by many scholars who provide frameworks and technical guidance (Huq, Reid & Murray 2006; Klein et al. 2007). In fact, mainstreaming adaptation has faced many challenges and barriers. Taking the example of international development assistance for weather extremes in Mozambique, Sietz et al. (2011) found that the barriers to integrating climate change adaptation exist at all institutional levels, from individuals to organisations. These barriers hinder both climate adaptation and ongoing development processes, such as institutional arrangements and availability of resources and information; and are made worse by unclear mandates and networks. Drawing this insight into the climate change adaptation-vulnerability and development nexus, adaptation can be divided into two different approaches: (i) an ‘adaptation approach’ to development and (ii) a ‘vulnerability reduction approach’ to development (Schipper 2007). Integrating or mainstreaming adaptation into development processes is the fundamental idea of the adaptation approach. This concept comes from multilateral and international agencies where the central point is that climate change adaptation processes should be embedded into the development agenda (e.g. World Bank and UNDP). As a consequence, many development projects should take into account, or mainstream, climate change considerations. The term ‘climate-sensitive project’ (Schipper 2007) has been used to describe these approaches. In contrast, some scholars have argued that vulnerability reduction should be considered first in the development agenda before specific adaptation strategies are conducted (Christoplos 2010; Kelman & West 2009; O'Brien et al. 2006; Schipper 2007). The basic reason for this approach is that the vulnerability of societies is usually caused not by climate stress, but rather by other pressures (Wisner et al. 2011). This situation can be seen in developing countries, which are also struggling with social, economic and other developmental problems. Different approaches to adaptation strategies can be seen in Figure 1.5.. Figure 1.5 Different approaches to linking adaptation and development (Schipper 2007). 17.
Figure
+7
Related documents
Northeast fi shing communities were classi fi ed into four cate- gories of climate change vulnerability (low, moderate, high and very high) based on the percent contribution of
Last, this study utilised two small focus groups to explore the impacts of environmental education on perceptions of climate change risks in rural and township communities in
