0022-538X/09/$08.00
⫹
0
doi:10.1128/JVI.01865-08
Copyright © 2009, American Society for Microbiology. All Rights Reserved.
Insertional Gene Activation by Lentiviral and Gammaretroviral Vectors
䌤
†
Marieke Bokhoven,
1Sam L. Stephen,
1Sean Knight,
1Evelien F. Gevers,
2Iain C. Robinson,
2Yasuhiro Takeuchi,
1and Mary K. Collins
1*
Infection and Immunity, University College London, Windeyer Building, 46 Cleveland Street, London W1T 2AH,
1and
Division of Molecular Neuroendocrinology, MRC National Institute for Medical Research, The Ridgeway,
Mill Hill, London NW7 1AA,
2United Kingdom
Received 4 September 2008/Accepted 15 October 2008
Gammaretroviral and lentiviral vectors are promising tools for gene therapy, but they can be oncogenic. The
development of safer vectors depends on a quantitative assay for insertional mutagenesis. Here we report a
rapid, inexpensive, and reproducible assay which uses a murine cell line to measure the frequency of
inter-leukin-3 (IL-3)-independent mutants. Lentiviral and gammaretroviral vectors cause insertional mutagenesis at
similar frequencies; however, they use different mechanisms. Human immunodeficiency virus (HIV)-based
vectors generate mutants by insertion only into the growth hormone receptor (
Ghr
) locus. The HIV enhancer/
promoter is active in the absence of the HIV Tat protein in this locus, and an HIV/
Ghr
spliced transcript
expresses GHR and cells respond to GH. Deletion of the enhancer/promoter in a self-inactivating HIV-based
vector prevents this mechanism of insertional mutagenesis. In contrast, gammaretroviral vectors insert into
other loci, including IL-3 and genes identified as common insertion sites in the Retroviral Tagged Cancer Gene
Database (RTCGD).
Gammaretroviral and lentiviral vectors are promising tools
for the correction of inherited genetic diseases. Because such
vectors integrate into cellular DNA, transduction of patients’
bone marrow stem cells has been used to modify progeny cells
of the hematopoietic system, leading to correction of inherited
immunodeficiencies (1, 6, 23). However, vector integration
may also cause tumors by upregulating cellular oncogenes
ad-jacent to the integration site. For example, patients with
com-mon gamma-chain deficiency treated with a gammaretroviral
vector have developed leukemia following vector insertion in
oncogenic loci (13). It remains unclear whether the common
gamma-chain itself or the rapid proliferation caused by its
restoration predisposes these particular patients to insertional
oncogenesis (25, 37). Vector integration can also cause clonal
expansion (16); in patients with chronic granulomatous
dis-ease, the expansion of vector-modified clones has improved
the rate of gene correction (23). However, this is probably not
a desirable outcome, as hyperproliferation may select for
pre-malignant or otherwise dysfunctional clones.
The successful clinical studies have all used retroviral vectors
based on murine leukemia virus (MLV); the vectors retain the
enhancer within the gammaretroviral long terminal repeat
(LTR). The most commonly described mechanism of cell
transformation by MLV is insertion of the provirus adjacent to
cellular protooncogenes, resulting in disregulation of their
ex-pression and tumor formation. The activity of the enhancer
within the U3 region of the viral LTR controls the rate and
type of tumor formation (9, 31, 34, 35). Insertional oncogenesis
by wild-type (WT) lentiviruses is not a common mechanism of
pathogenesis; a potentially oncogenic insertion of human
im-munodeficiency virus (HIV) has been reported in rare
HIV-associated T-cell lymphomas (28). However, most lentiviral
vectors lack viral genes that cause other disease pathologies
and also carry an envelope that extends cell tropism, so
inser-tional oncogenesis cannot be ruled out.
Clearly the development of safer vectors requires a
repro-ducible assay that quantitates insertional mutagenesis.
Chem-ical mutagenesis results in DNA damage which can lead to loss
of gene function; this can be scored by the selection of cells for
the loss of an activity, for example, that of the enzyme
thymi-dine kinase (7). An insertional mutagenesis assay needs to
measure gain of gene function; a general assay should screen as
many loci as possible, and a disease-specific model could be
used to screen cooperating loci. Retroviral-vector insertional
oncogenesis has been quantitated in mice either by using
vec-tors expressing an oncogene (11, 18) or mutant, tumor-prone
mice (22, 29). However, mouse oncogenesis experiments are
expensive and time consuming. One cell culture assay has been
developed that measures extended culture of mouse bone
mar-row primary cells; this selects for gammaretroviral-vector
in-sertion in and upregulation of the Evi1 gene (21).
Here we report a cell culture assay for insertional
mutagen-esis that uses an immortalized mouse cell line. This is based on
the observation that retrovirus insertion can render an
inter-leukin-3 (IL-3)-dependent cell line cytokine independent (32).
Most genes identified in such an assay are likely to be specific
gain-of-function genes (32), as are the common insertion sites
(CIS) in the Retroviral Tagged Cancer Gene Database
(RTCGD), although it may be possible that haploid gene
in-activation could render cells IL-3 independent. While
gamma-retroviral and lentiviral vectors generate insertional mutants in
this assay at similar frequencies, they do so by different
mech-anisms.
* Corresponding author. Mailing address: Infection and Immunity,
University College London, Windeyer Building, 46 Cleveland Street,
London W1T 2AH, United Kingdom. Phone and fax: 44-2076799301.
E-mail: mary.collins@ucl.ac.uk.
† Supplemental material for this article may be found at http://jvi
.asm.org/.
䌤
Published ahead of print on 22 October 2008.
283
on November 8, 2019 by guest
http://jvi.asm.org/
MATERIALS AND METHODS
Cell lines.The suspension cell lines BAF3 (24) and Bcl15 (8) were grown in Dulbecco’s modified Eagle’s medium (DMEM; Gibco) with 10% fetal calf serum (FCS), antibiotics, and 2 to 10% WEHI-3B-cell-conditioned medium.
Vectors. The HIV type 1 (HIV-1)-derived lentiviral vectors pHV and its self-inactivating (SIN) counterpart pHRSIN-CSGW (10) are described in refer-ence 14; SINLV SFFV IL2RG (SIN lentivirus spleen focus-forming virus IL-2 receptor, gamma chain) is described in reference 39. The gammaretroviral vec-tors used were pCNCG (30) and pMFG.S eGFP (expressing enhanced green fluorescent protein) (26) (the latter kindly provided by J. S. Lee, Harvard Gene Therapy Initiative). Vesicular stomatitis virus G glycoprotein-pseudotyped vec-tor stocks were produced by transient transfection of 293T cells. The lentiviral transfer vector plasmid were cotransfected with the HIV-1-packaging plasmid pCMV⌬R8.91 and vesicular stomatitis virus G glycoprotein plasmid pMDG. The gammaretroviral transfer vector plasmid was cotransfected with MLV packaging plasmid pCMVintron and pMDG. Viral supernatants were concentrated 100-fold by ultracentrifugation. The titers of vector preparations were determined on Bcl15 cells by quantitative PCR (qPCR) for integrated GFP or HIV-1 gag leader sequence (SINLV SFFV IL2RG only) copies. For each sample, TaqMan quan-tification of 18S rRNA copies was performed in parallel to control for input. (All primer and probe sequences can be found in Table S1 in the supplemental material). The lentiviral- and gammaretroviral-vector titers were in the range of 4⫻ 107
to 12⫻107
and 1 ⫻106
to 10⫻106
Bcl15 infectious units/ml, respectively.
Transduction and selection of IL-3-independent cells.On day 1, Bcl15 target cells were transduced for 4 h at a multiplicity of infection (MOI) of 4 to 12 (experiments LV2 to LV8 [using lentiviral vectors]) or 0.1 to 1.1 (experiments RV1 to RV3 [using gamma retroviral vectors]). Bcl15 cells were transduced at a cell density of 106
cells per ml in T75 flasks; the vector preparation made up 10% of the total volume at the time of transduction. After 4 h, the culture volume was expanded 12- to 15-fold, and Bcl15 target cells were grown in complete medium plus IL-3 for the next 72 h. On day 4 of the IL-3 selection protocol, cells were washed and plated in 24-well plates at 5⫻105
cells/well in 2 ml medium without IL-3. On day 11, the cells were “rescued” by the readdition of IL-3 and main-tained in IL-3; many wells reached confluence after 2 to 3 days. On days 14 and 15, the cells in each well were washed free of IL-3 once more and grown in 10 ml
complete medium without IL-3 in T25 tissue culture flasks. IL-3-independent clones appeared 7 to 10 days later in a small number of flasks. To select forGhr insertional mutants, cells were grown from day 4 onwards in 24-well plates in medium containing FCS and 1g/ml recombinant bovine growthhormone (bGH) (kind gift of Monsanto). The number of wells in which IL-3-independent clones grew out was scored after 4 to 6 weeks. For both gammaretroviral and lentiviral vectors, transduction at lower MOIs did not give IL-3-independent mutants.
Selection of IL-3-dependent single-cell clones by limiting dilution. IL-3-de-pendent single-cell clones were selected from cell populations transduced with gammaretroviral vectors. Cells were plated at 0.3 cells per well in 96-well plates in complete medium containing IL-3. The IL-3 dependence of the clones was confirmed by their inability to grow in the absence of IL-3. The presence of the vector in individual clones was verified by integration site analysis and measuring GFP expression by using flow cytometry.
Statistical analysis.Statistical analysis of the mutagenesis frequency data (Table 1 and see Fig. 3b) was performed on the number of wells with IL-3-independent clones or the number of IL-3-IL-3-independent mutants in the mock-and vector-transduced groups. For unpaired data analysis, the numbers of such wells or mutants from individual experiments using similar vectors were pooled, i.e., the numbers of observations in the mock, WT LTR, and SIN LTR groups as shown in Table 1 were 10, 6, and 5, respectively; the data for mock and RV experiment groups in Fig. 3b include the results from four observations each. Differences in the numbers of such wells or mutants for the three groups (mock, WT LTR, and SIN LTR) for which results are shown in Table 1 and the two groups (mock and RV experiment) for which results are shown in Fig. 3b were compared by using parametric (ttest) and nonparametric (Mann-Whitney U test) tests (Table 2 and legend to Fig. 3).
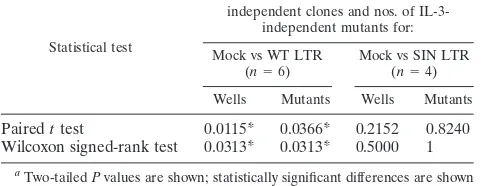
[image:2.585.42.547.81.259.2]In each experiment, a single population of Bcl15 target cells was subjected to either mock or vector transduction, which might affect the level of spontaneous transformation to IL-3 independence. Hence, we also carried out paired data analysis. Differences in the numbers of wells with IL-3-independent clones/IL-3-independent mutants obtained in each experiment following mock or vector transduction were analyzed by using parametric (pairedttests) and nonpara-metric (Wilcoxon signed-rank test) tests (Table 3). Two-tailedPvalues are shown; these were calculated by using Analyze-it and Microsoft Excel software.
TABLE 1. Lentiviral mutagenesis frequencies
aType of vector, expt Selection methodc No. of target cells
Mock transduction mutants
No. of integrants
Vector-transduced mutants
No. of wells or flasks with
clonesd
Mutant cell frequencye
No. of wells or flasks with clonesd No. of mutantsf Mutant cell frequencye Integrant frequencyg
WT HIV LTR
LV1
bIL-3
4.0
⫻
10
80
⬍
2.5
⫻
10
⫺91.0
⫻
10
98
1
2.5
⫻
10
⫺91.0
⫻
10
⫺9LV2
IL-3
1.0
⫻
10
70
⬍
1.0
⫻
10
⫺71.2
⫻
10
82
2
2.0
⫻
10
⫺71.7
⫻
10
⫺8LV3
IL-3
5.0
⫻
10
72
4.0
⫻
10
⫺81.9
⫻
10
813
13
2.6
⫻
10
⫺76.8
⫻
10
⫺8LV3
bGH
5.0
⫻
10
70
⬍
2.0
⫻
10
⫺81.9
⫻
10
823
18
3.6
⫻
10
⫺79.5
⫻
10
⫺8LV6
bGH
3.6
⫻
10
74
1.1
⫻
10
⫺71.9
⫻
10
813
9
2.5
⫻
10
⫺74.7
⫻
10
⫺8LV7
bGH
3.6
⫻
10
70
⬍
2.8
⫻
10
⫺82.9
⫻
10
814
7
1.9
⫻
10
⫺72.4
⫻
10
⫺8SIN HIV LTR
LV4
IL-3
5.0
⫻
10
71
2.0
⫻
10
⫺83.1
⫻
10
87
4
8.0
⫻
10
⫺81.3
⫻
10
⫺8LV5
IL-3
5.0
⫻
10
70
⬍
2.0
⫻
10
⫺85.4
⫻
10
80
0
⬍
2.0
⫻
10
⫺8⬍
1.9
⫻
10
⫺9LV4
bGH
5.0
⫻
10
73
6.0
⫻
10
⫺83.1
⫻
10
86
1
2.0
⫻
10
⫺83.3
⫻
10
⫺9LV5
bGH
5.0
⫻
10
70
⬍
2.0
⫻
10
⫺85.4
⫻
10
80
0
⬍
2.0
⫻
10
⫺8⬍
1.9
⫻
10
⫺9LV8
bGH
3.6
⫻
10
7ND
ND
2.1
⫻
10
80
0
2.7
⫻
10
⫺8⬍
4.8
⫻
10
⫺9a
The WT HIV-1 LTR lentiviral vector HV was used in experiments LV1, -2, -3, -6, and -7; the SIN lentiviral vector HR SIN CSGW (expressing GFP) was used in experiments LV4 and -5; and SINLV SFFV IL2RG (expressing IL2RG) was used in experiment LV8.
b
Pooled data from six independent mutagenesis experiments in BAF3 cells are shown for experiment LV1.
c
IL-3-independent mutants were either selected according to the IL-3 selection protocol (IL-3) or selected in serum supplemented with 1g/ml bGH (bGH).
d
The number of flasks (IL-3 selection) or wells (bGH selection) in which IL-3-independent clones grew out was scored after 7 to 10 days or 4 to 6 weeks, respectively. ND, not done.
e
The mutant cell frequency was calculated by dividing the number of independent mutants by the total number of target cells in each experiment. ND, not determined.
f
Replicate (“sibling”) clones were eliminated following Southern blot and/or vector integration site analysis, and the number of independent mutants obtained in each experiment is shown.
g
The integrant frequency was calculated by dividing the number of independent mutants by the total number of integrants in each experiment. In experiment LV1, the number of integrants was calculated by multiplying the total number of target cells by the MOI. The MOI was determined by GFP fluorescence-activated cell sorting at 72 h posttransduction. In all other experiments, the average number of vector copies per cell was determined by qPCR at 72 h posttransduction. This number was multiplied by the number of target cells to obtain the number of integrants.
284
BOKHOVEN ET AL.
J. V
IROL.
on November 8, 2019 by guest
http://jvi.asm.org/
Southern blot analysis.Genomic DNA was digested with BamHI for the HV, CSGW, and MFG.S eGFP vectors and HindIII for the CNCG vector. DNA fragments were blotted by neutral transfer onto a nylon membrane (Hybond-XL; Amersham Bioscience). The blot was hybridized overnight at 65°C with a 720-bp ␣32P-labeled GFP cDNA probe diluted in Rapid-Hyb buffer (GE Healthcare)
supplemented with 10g/ml salmon testis DNA (Sigma). After being washed, the blot was exposed to a phosphor screen and visualized by using a Storm PhosphorImager (GE Healthcare). The image was analyzed by using Image-Quant software (GE Healthcare). Some blots were also exposed to Kodak BioMax film.
Insertion site identification.For inverse PCR (5), genomic DNA was digested with NlaIII (HV vector) or MspI (HV/CNCG/MFG vectors) and then ligated. Nested PCR on circularized DNA was performed by using divergently oriented primers complementary to the HIV-1 or MLV LTR. The CSGW vector integra-tion sites were cloned by using ligaintegra-tion-mediated PCR (LM-PCR) (38); DNA was digested overnight with NlaIII, MspI, or TacI restriction enzyme. A second digest was carried out for 2 h with either EcoRI (for NlaIII or MspI initial digest) or SacI (for TacI initial digest). The inverse/LM-PCR products were size sepa-rated on an agarose gel, cloned into pGEM-T Easy vector (Promega), and sequenced (Lark Technologies). Vector-genome junction sequences were blasted against the mouse genome released in August 2007 (www.ensembl.org /Mus_musculus). Some integration sites were confirmed by site-specific PCR. In experiments LV3, -6, and -7, multiplex PCR was used to identify additional HV vector integration sites in theGhrlocus. Seven forward primers hybridizing every 2 kb in the 15-kb region immediately upstream ofGhrexon 2 and an HV vector-specific reverse primer were used.
RNA analysis.For reverse transcriptase PCR (RT-PCR), RNA was extracted by using an RNeasy kit (Qiagen). RNA was reverse transcribed by using a Protoscript first strand cDNA synthesis kit (New England Biolabs). Either a gene-specific reverse primer or random primers were used to prime the RT reaction. An RT-PCR for the presence ofGhrtranscript was then performed. For qRT-PCR, cDNA was generated from RNA by using a QuantiTect reverse transcription kit (Qiagen) and IL-3 transcript was quantified by TaqMan probe qRT-PCR. An IL-3 cDNA in the pGEM-T Easy vector was used for the quan-tification of IL-3 copies. For each sample, TaqMan quanquan-tification of 18S rRNA copies was performed in parallel. A 600-bp fragment of the 18S rRNA gene cloned into pCR-Blunt II-TOPO was used for the quantification of 18S rRNA copies. The ratio of IL-3 copies to 18S copies was calculated from duplicate samples.
For 5⬘rapid amplification of cDNA ends-PCR (5⬘RACE-PCR), total RNA was extracted from 1⫻107
cells by using RNA-Zol B (Biogenics). 5⬘RACE was carried out by using a 5⬘RACE system (Invitrogen), using aGhrexon 4 primer for the RT reaction. The products were separated on a 1% Tris-acetate-EDTA
agarose gel, cloned into TOPO TA cloning vector (Invitrogen), and sequenced. For Northern blotting, 20g of RNA was loaded onto a morpholinepropane-sulfonic acid (MOPS; Sigma) formaldehyde (BDH) RNA gel and blotted over-night by basic transfer on to a Hybond N⫹membrane (Amersham Biosciences). The blot was hybridized overnight at 68°C with an␣32P-labeledGhrexon 11-3⬘
untranslated region probe diluted in SSC (1⫻SSC is 0.15 M NaCl plus 0.015 M sodium citrate), milk powder mix (Oxoid), and 25% dextran sulfate supplemented with 10g/ml salmon testis DNA (Sigma). After being washed, the blot was exposed either to a storage phosphor screen (Kodak) or to a Kodak BioMax film (Kodak).
Protein analysis.For Western blotting, 1⫻107
cells were lysed with phosphate-buffered saline (PBS) containing 1% IGEPAL (Sigma) and 1⫻protease inhibitor cocktail (Roche) and then separated on a 10% polyacrylamide gel, blotted onto Hybond ECL nitrocellulose membrane (Amersham Biotech), and probed with bi-otinylated anti-mouse GHR antibody (BAF1360; R&D systems) and then strepta-vidin horseradish peroxidase complex (Amersham Biosciences) in Tris-buffered sa-line with 5% milk powder (Oxoid). Detection was carried out by using enhanced chemiluminescence Western blot detection reagents (Amersham Biosciences).
For GHR flow cytometry, cells were incubated with 5g/ml biotinylated goat anti-mouse GHR antibody (BAF1360; R&D systems) which was diluted in blocking buffer (1⫻PBS, 2% FCS, 0.01% Na azide). Biotinylated normal goat immunoglobulin G (BAF108; R&D systems) was used as a control. Cells were then incubated with allophycocyanin-conjugated streptavidin (17-4317; eBio-science). The samples were analyzed by flow cytometry using a BD LSR flow cytometer and CellQuest software. For STAT5 staining, cells were washed in serum-free medium and then cultured in serum-free medium plus 0.5% bovine serum albumin (BSA) for 6 h. Cells were then stimulated for 12 min with 400 ng/ml human GH (kind gift of Pharmacia-Upjohn), PBS–0.5% BSA as a negative control, or 100 ng/ml recombinant murine IL-3 (403-ML/CF; R&D systems) as a positive control. Following stimulation, cells were incubated for 3 min at room temperature with 100l reagent A fixation medium (Fix and Perm from Caltag or GAS 004 from Invitrogen) and then with 500l chilled flow buffer (PBS–0.5% BSA–0.1% Na azide) containing 1 mM pervanadate and 20 mM sodium fluoride and fixed in ice-cold methanol. Cells were then incubated with phycoerythrin-conjugated mouse anti-phospho-Stat5 antibody (612567; BD Phosflow) or phy-coerythrin-conjugated mouse immunoglobulin G1(555749; BD Pharmingen). Cells were analyzed by flow cytometry.
Proliferation assay.Cells were cultured in serum-free medium for 6 h and then plated in 96-well plates in medium with FCS or bGH (see Fig. 2f). On day 2, cells were pulsed with 1Ci [3H]thymidine per well (ICN Biomedical, High
Wy-combe, United Kingdom). On day 3, DNA from cells was harvested on a filter-mat using a Tomtec harvester model 96. Cell proliferation was measured by liquid scintillation counting (Microbeta Systems).
RESULTS
[image:3.585.43.543.82.157.2]Our aim was to develop a cell line assay for insertional
mutagenesis. This was based on the observation that retrovirus
insertion can be used to identify genes involved in growth
factor signaling by selection of growth factor-independent
mu-tants from growth factor-dependent hematopoietic cell lines
(32). This technique has also been performed using
gamma-retroviral-vector infection of the murine IL-3-dependent cell
line BAF3 (24) to identify bcl-X as a molecule that inhibits
apoptosis without stimulating proliferation (33). In our first
experiments, we transduced BAF3 cells with the lentiviral
vec-tor HV (Fig. 1a) in the presence of IL-3 and then removed IL-3
TABLE 2. Unpaired data analysis of lentiviral mutagenesis frequency results in Table 1
Statistical test
Pvaluesafor nos. of wells with IL-3-independent clones and nos. of IL-3-independent mutants for:
All mock (n⫽10) vs WT LTR (n⫽6)
All mock (n⫽10) vs SIN LTR (n⫽5)
WT LTR (n⫽6) vs SIN LTR (n⫽5)
Wells Mutants Wells Mutants Wells Mutants
Independent
t
test
0.0002***
0.0036**
0.2340
1
0.0220*
0.0379*
Mann-Whitney U test
0.0017**
0.0075**
0.6787
1
0.0173*
0.0303*
a*,P⬍0.05; **,P⬍0.01; ***,P⬍0.001.
TABLE 3. Paired data analysis of lentiviral mutagenesis frequency
results in Table 1
Statistical test
Pvaluesafor nos. of wells with
independent clones and nos. of IL-3-independent mutants for:
Mock vs WT LTR (n⫽6)
Mock vs SIN LTR (n⫽4)
Wells Mutants Wells Mutants
Paired
t
test
0.0115*
0.0366*
0.2152
0.8240
Wilcoxon signed-rank test
0.0313*
0.0313*
0.5000
1
aTwo-tailedPvalues are shown; statistically significant differences are shown
by asterisks.
on November 8, 2019 by guest
http://jvi.asm.org/
[image:3.585.42.285.615.708.2]FIG. 1. Characterization of lentiviral-vector insertional mutants. (a) HIV-1 derived lentiviral vectors used in insertional mutagenesis
experi-ments shown as proviral genomes. The HV vector has WT HIV-1 LTRs and an internal SFFV LTR promoter driving GFP expression. The SIN
lentiviral vectors HRSIN-CSGW and SINLV SFFV IL2RG (SINLV-SF-IL2RG) lack 400 bp of the U3 region of the HIV-1 LTRs; an internal
SFFV promoter drives GFP or IL2RG expression. The location of the unique BamHI restriction site used in Southern blotting is also shown. (b)
Southern blots (SB) of lentiviral insertional mutants from experiments LV1, LV2, LV3 (IL-3 selection), LV6, and LV4. Genomic DNA was
digested with BamHI, and blots were probed with GFP. Phosphorscreen images are shown of all blots except that of LV3 (IL-3 selection), which
was exposed to Kodak BioMax film. The first row of the table below each blot shows estimated vector copy numbers from the Southern blot. In
experiments LV1, LV2, and LV3 (IL-3 selection), mutants were independent, as defined by different (or additional) bands on Southern blots,
combined with integration site cloning. The number of integration sites cloned by inverse PCR from these mutants is shown in the table below the
blots. Replicate clones were obtained in experiments LV4 and LV6; the final number of mutants shown in Table 1 does not include replicate clones.
286
on November 8, 2019 by guest
http://jvi.asm.org/
The replicates are identified by common symbols. IPCR, number of insertion site loci identified in the mutant by integration site PCR; IS,
integration sites shared by these clones were verified by site-specific PCR; ?, vector copy number was not determined;
ⴱ
, mutant HV12-6 from LV6
was eliminated from further analysis: though it shows a faint band on Southern blot, no integrated vector copies were detected by qPCR. Ladder,
1-kbp DNA marker (Fermentas). (c) Locations of insertions into the
Ghr
allele on mouse chromosome 15. The 19 HV vector insertions that we
mapped occurred in the same transcriptional orientation as
Ghr
and were in the 125-kb region upstream of exon 2, the first coding exon of
Ghr
.
ⴱ
,
Ghr
insertion was recovered by multiplex PCR spanning the region between L1 exon 1 and L5 promoter; all other
Ghr
insertions were obtained
by inverse PCR. (d) RT-PCR for the
Ghr
transcript. A forward primer in exon 4 and a reverse primer in exon 8a were used to amplify a 552-bp
section of the
Ghr
transcript. Representative gels are shown for mutants from experiments LV1, LV2, and LV3 (IL-3 selection). qRT-PCR
to determine IL-3 transcript levels was also performed. A positive result (
⫹
) indicates
⬎
10
3IL-3 copies per 10
918S rRNA copies; a negative
result (
⫺
) indicates
⬍
10
1IL-3 copies per 10
918S rRNA copies. The table summarizes the expression of these two transcripts by the LV6
and LV4 experiment mutants. ND, not done. Ladder, 100-bp DNA marker (Fermentas).
on November 8, 2019 by guest
http://jvi.asm.org/
from the culture medium after 4 days and plated cells at 5
⫻
10
5cells/well in 24-well plates in medium with FCS. None of
the wells contained expanding clones of cells by visual
inspec-tion after 7 days, so we then readded IL-3 and maintained it in
the wells until cells grew in some. We then reselected these
growing clones in the absence of IL-3 and isolated a single
mutant from a large number of transduced cells (Table 1,
experiment LV1, and Fig. 1b, mutant HV A2). This selection
protocol, designated IL-3 selection, was used in further
exper-iments where indicated.
To improve the frequency of mutagenesis, we reasoned that
cells already overexpressing a bcl-2 transgene, the BAF3
de-rivative Bcl15 (8), might be more robust during selection,
al-lowing us to rescue more mutants. This proved to be the case,
and we isolated a further 15 mutants from two HV
vector-transduced populations at a cell frequency higher than the
background frequency of spontaneous IL-3-independent
mu-tants (Table 1, experiments LV2 and LV3 [IL-3 selection], and
Fig. 1b, mutants HV3, -10, -14, -24, -25, -32, -41, -42, -43, -48,
-49, -72, -77, and -82). We estimated the number of HV
inte-grants in these mutants by Southern blot analysis (Fig. 1b) and
cloned HV integration sites from many of them by inverse
PCR. Table 4 shows that 10 of these mutants contained an HV
insertion in the GH receptor (
Ghr
) locus. Mutants HV A2 and
HV49 apparently contain a single HV insertion in
Ghr
,
sug-gesting that this event is capable of making both BAF3 and
Bcl15 cells IL-3 independent.
Ghr
is also likely to participate in
primary cell transformation by retroviruses as it is defined as a
CIS, appearing six times in the RTCGD (2).
Figure 1c shows that all the HV vector integrants were
upstream of the first coding exon of
Ghr
(exon 2) and in the
same orientation as the
Ghr
transcript. The mouse L2
pro-moter is normally predominantly active in the liver, and the L1
and L5 promoters are more active in the placenta (12, 19). Fig.
1d shows that the 10 mutants from experiments LV2 and LV3
with HV inserted in the
Ghr
locus all expressed
Ghr
RNA,
detected by RT-PCR. In contrast, the parental cells, the two
spontaneous mutants, and HV48, which did not contain a
Ghr
insertion, did not express
Ghr
transcripts. However, we did
detect IL-3 mRNA by qRT-PCR in the two spontaneous
mu-tants and in HV48 (Fig. 1d). This suggests that the
upregula-tion of IL-3 gene expression is a common cause of
“back-ground” spontaneous mutants in this assay. It is possible that
HV48 is a spontaneous mutant; however, it also contains one
insertion site in common with HV3, in the Plekha5 gene, which
may contribute to the IL-3-independent phenotype.
To determine the mechanism of
Ghr
gene regulation by HV
insertion, we cloned the 5
⬘
end of the major
Ghr
transcripts in
the HV A2, HV3, and HV14 cells by using 5
⬘
RACE-PCR.
Each mutant yielded a single predominant PCR product; the
sequences are shown in Fig. 2a. The transcripts start at the 5
⬘
end of the R region of the HIV LTR and contain vector
sequences to the point of the HIV major splice donor; they
then splice to the
Ghr
splice acceptor at the start of exon 2.
This structure suggests that the HIV enhancer and promoter,
within the HIV U3 region, are active in the HV vectors
inte-grated at this locus and that this drives expression from the
HIV transcription start site at the start of the R region. In
agreement with this, we did not detect transcription of
Ghr
exon 1 or the HIV U3 region by RT-PCR (data not shown).
Also supporting this hypothesis, these three clones contain a
Ghr
transcript of approximately 5 kb, detected by Northern
blotting (Fig. 2b), consistent in size with a fused vector
Ghr
transcript. We can detect two proteins of sizes consistent with
GHR and the smaller, secreted GH binding protein, generated
by alternative splicing of the 3
⬘
end of the
Ghr
transcript, by
immunoblotting (15) (Fig. 2c), and we can detect surface GHR
expression by fluorescence-activated cell sorting (FACS) (Fig.
2d). IL-3 stimulated rapid STAT5 phosphorylation in the
pa-rental cells, and GH stimulated STAT5 phosphorylation to a
similar extent in the GHR-expressing HV mutants (Fig. 2e).
Hematopoietic cells engineered to express GHR proliferate
in GH. In BAF3 cells, this effect is due to a direct stimulation
by GH, not to induction of insulin-like growth factor secretion
(3). Figure 2f shows that the GHR-expressing HV mutants
proliferated in medium with FCS (which contains some bGH),
explaining their growth in the absence of IL-3. They also
pro-liferated in serum-free medium supplemented with
recombi-nant bGH, though FCS was more potent, suggesting that it
contains additional growth factors (Fig. 2f).
As the predominant HV mechanism of mutagenesis
in-volved GHR expression, we also selected three HV-transduced
populations of cells in medium supplemented with both FCS
and additional recombinant bGH. In this case, after cells were
plated in 24-well plates, wells contained expanding clones
with-out IL-3 readdition (Table 1, LV3, LV6, and LV7, selection in
GH). Southern blot analysis demonstrates that these included
a total of 34 independent insertional mutants (Fig. 1b; see Fig.
S1 in the supplemental material), and the results in Fig. 1d
(also see Fig. S1 in the supplemental material) show that they
all expressed
Ghr
mRNA. Analysis of the number of mutants
induced by the HV vector compared to the number of mock
mutants shows a significant difference considering either the
number of wells containing mutants or the number of
inde-pendent mutants (Tables 2 and 3).
This rapid selection of cells in GH allowed us to screen
variants of the HV vector to determine which components are
necessary for insertional mutagenesis in the
Ghr
locus. We
initially tested the vector HRSIN-CSGW or a derivative
ex-pressing IL2RG (Fig. 1a), both of which contain a deletion in
the HIV enhancer/promoter, as we thought that the HIV
en-hancer/promoter was important for the expression of the
Ghr
transcripts. Table 1 shows that these vectors did not generate
mutants compared to the background of spontaneous mutants
when cells were selected either under IL-3 selection
(experi-ments LV4 and LV5) or in the presence of GH (experi(experi-ments
LV4, LV5, and LV8). Analysis of the five CSGW
vector-trans-duced mutants that we isolated shows that four (CSGW12, -25,
-64, and -67) were potentially different (Fig. 1b). GH
CSGW2-4 is identical to CSGW25, and CSGW1-1 is a
sub-clone (Table 4). The CSGW mutants did not express
Ghr
mRNA (Fig. 1d); however, the spontaneous mutants and three
of the CSGW mutants (CSGW12, -64, and -67) expressed IL-3
mRNA. It remains possible that the CSGW vector causes a low
level of insertional mutagenesis, and we are continuing to
investigate these mutants.
Finally, we measured insertional mutagenesis by
gammaret-roviral vectors in the Bcl15 cell assay. We used two
gamma-retroviral vectors (Fig. 3a), one being MFG.S, the backbone
used in the common gamma-chain clinical trials (6). We
iso-288
BOKHOVEN ET AL.
J. V
IROL.
on November 8, 2019 by guest
http://jvi.asm.org/
lated seven mutants after IL-3 selection at integrant
frequen-cies similar to those observed with the HV vector (Fig. 3b).
Southern blot analysis (Fig. 3c) demonstrates that these were
independent clones, though C94 was apparently a spontaneous
[image:7.585.43.539.79.568.2]mutant having no vector insert (Fig. 3c) and yielding no
inte-gration sites by inverse PCR (data not shown). The inteinte-gration
sites in these gammaretroviral mutants were distinct from
those in the HV mutants. Mutant G18 had an insertion just
TABLE 4. Lentiviral vector integration sites in IL-3-independent mutants (experiments LV1 to LV4)
aExpt, clone
Copy no. in SBb
No. of ISc
In
gened Genee
Entrez Gene ID
Chromosome Distance to TSSf Orientationg Predicted gene functionh
No. of RTCGD
hit(s)i
LV1
HVA2 1 1 Y Ghr 14600 15 ⫹ Growth hormone receptor 6 CIS
LV2
HV3 12 6 Y Ghr 14600 15 ⫹ Growth hormone receptor 6 CIS
Y Dock2 94176 11 323 kb, intron 27-28 ⫹ Cytoskeletal organization
Y Stag1 20842 9 149 kb, intron 7-8 ⫹ Cell cycle, cell division 2 CIS Y Hcfc2 67933 10 5,867 bp, intron 3-4 ⫺
Y Plekha5 109135 6 103 kb, intron 5-6 ⫺ Y 2610020 H08
Rik
434234 7 48 kb, intron 1-13 ⫹
HV14 7 2 Y Ghr 14600 15 ⫹ Growth hormone receptor 6 CIS
Y Usp45 77593 4 34 kb, intron 9-10 ⫹ Ubiquitin cycle
LV3
HV24 3 2 Y Ghr 14600 15 ⫹ Growth hormone receptor 6 CIS
N 14
HV32 2 Y Ghr 14600 15 ⫹ Growth hormone receptor 6 CIS
N 7
HV41 4 2 Y Ghr 14600 15 ⫹ Growth hormone receptor 6 CIS
Y Suclg2 20917 6 26 kb, intron 1-2 ⫹ Metabolic process, GDP forming activity, tricarboxylic acid cycle
1
HV43 4 1 Y Ghr 14600 15 ⫹ Growth hormone receptor 6 CIS
HV48 2 Y Senp1 223870 15 7 kb, intron 2-3 ⫺ Multicellular organismal development, protein desumoylation Y Plekha5 109135 6 3 kb, intron 1-2 ⫹
HV49 1 1 Y Ghr 14600 15 ⫹ Growth hormone receptor 6 CIS
HV72 2 1 Y Ccdc111 408022 8 10 kb, intron 4-5 ⫺ DNA replication
HV77 4 4 Y Ghr 14600 15 Growth hormone receptor 6 CIS
Y Gmps 229363 3 1,217 bp, intron 1-2 ⫹ Purine nucleotide biosynthetic process, glutamine metabolic process
N 16
Y Hif1a 15251 12 15 kb, intron 8-9 ⫹ Angiogenesis, cartilage development
1
HV82 1 Y Ghr 14600 15 ⫹ Growth hormone receptor 6 CIS
LV4
GH CSGW 1-1 5 4 Y Zfp407 240476 18 23 kb, intron 1-2 ⫹
Y Cnot4 53621 6 32 kb, intron 1-2 ⫺ CCR4 NOT transcription complex, subunit 4 Y Gmeb2 229004 2 26 kb, intron 4-5 ⫺ Glucocorticoid
modulatory element binding protein 2 Y Wipi2 74781 5 12 kb, intron 2-3 ⫹ WD repeat domain, phosphoinositide interacting 2
GH CSGW 2-4 4 3 Y Cnot4 53621 6 32 kb, intron 1-2 ⫺ CCR4 NOT transcription
complex, subunit 4 Y Gmeb2 229004 2 26 kb, intron 4-5 ⫺ Glucocorticoid
modulatory element binding protein 2 Y Wipi2 74781 5 12 kb, intron 2-3 ⫹ WD repeat domain, phosphoinositide interacting 2
a
Integration sites were cloned by inverse PCR or LM-PCR from mutants obtained in experiments LV1, LV2, LV3 (IL-3).
b
SB, Southern blotting. Indicates estimated vector copy number determined by Southern blotting.
c
IS, insertion site(s). Data show the number of insertion site loci identified in the mutant by integration site PCR.
d
Y, yes; N, no.
e
If an insertion is not in a gene, the nearest gene(s) within 30 kb up- or downstream of the insertion site is listed. TheGhrinsertion sites in mutants HV24 and HV77 were cloned by multiplex PCR; all otherGhrinsertions sites were obtained by inverse PCR.
f
TSS, transcription start site. For insertion sites, the distance to the transcription start site of the nearest gene and the intron into which the vector is inserted, where applicable (between numbered exons), are shown, except in the case ofGhrinsertions.
g
Indicates whether the vector insertion occurred in the same (⫹) or in the opposite (⫺) orientation as the gene’s transcript.
h
Predicted gene function is shown where known.
i
The number of appearances in the RTCGD of each insertion site locus is shown where applicable, and loci defined as CIS (http://RTCGD.ncifcrf.gov) are indicated.
on November 8, 2019 by guest
http://jvi.asm.org/
FIG. 2. Structure of the
Ghr
transcript, GHR protein expression, and results of functional studies. (a) 5
⬘
RACE was performed on mutants HV
A2, HV3, and HV14. A 590-bp product was cloned and sequenced. An alignment of the first 414 bp of the 5
⬘
RACE product is shown here. The
RACE linker cassette is 46 bp; the
Ghr
transcript starts at the HIV-1 R region. It contains 289 bp of HV vector sequence from before it splices
from the HIV-1 major splice donor to the splice acceptor of
Ghr
exon 2. The ATG start codon for
Ghr
is shown in bold. (b) In mutants HV A2,
HV3, and HV14, a 5-kb transcript was detected by Northern blotting using a probe that detects the intracellular domain of
Ghr
. Also shown are
the sizes of mouse 28S (4.7 kb) and 18S (1.7 kb) rRNA. (c) A 103-kDa GHR protein was detected in mutant HV A2 and mouse liver, but not in
the parental BAF3 cell. A smaller,
⬃
70kDa protein, the secreted GH binding protein, is also seen. Immunoblot analysis of total cell lysate was
performed using an antibody that recognizes the mouse GHR extracellular domain, common to GHR and GH binding protein. Sizes in kDa are
shown on the left. (d) Mutants HV3 and HV14 (black peak) express GHR on the cell surface in FACS, unlike the parental Bcl15 cell (solid gray
peak), demonstrated by surface staining using an antibody that recognizes the mouse GHR (mGHR) extracellular domain. (e) Parental cells and
mutants were stimulated with PBS–0.2% BSA (solid gray peak) or 400 ng/ml human GH (black peak) for FACS. Intracellular staining for
phosphorylated STAT5 was performed. Stimulation with 100 ng/ml IL-3 (dashed black peak) also results in STAT5 phosphorylation and acted as
a positive control. Selection method (bGH or IL-3) is indicated. MFI, mean fluorescence intensity. (f) Parental cells and mutants were cultured
for 48 h in DMEM, 10% FCS, 10% WEHI-3B-cell-conditioned medium (hatched bars); DMEM, 10% FCS (solid black bars); serum-free medium
(solid dark-gray bars); or serum-free medium supplemented with 1
g/ml bGH (solid light-gray bars). Cell proliferation was measured by
[3H]thymidine uptake. Error bars indicate standard errors of the means calculated from the results of two independent experiments.
290
on November 8, 2019 by guest
http://jvi.asm.org/
downstream of the IL-3 gene, and three of the other clones
that we have analyzed, C40, C57, and C96, had insertions at
CIS listed in the RTCGD (Table 5); note that Osbpl3 is
adja-cent to the HoxA locus, which is Evi7, with 25 hits in the
RTCGD. The gammaretroviral insertions in Sema4b, Plekhg2,
and IL-3 were within or downstream of the coding sequences,
suggesting an enhancer insertion effect. Analysis of the 11
gammaretroviral-vector insertion sites from eight control cell
clones that remained IL-3 dependent detected some genes
listed in the RTCGD but none defined as CIS (Fig. 3d). No
gammaretroviral-vector insertions were detected in GHR (Fig.
3d); we also selected some gammaretroviral-vector-transduced
Bcl15 cells in GH and did not isolate mutants (Fig. 3b). This
suggests that the insertions in CIS may contribute to the
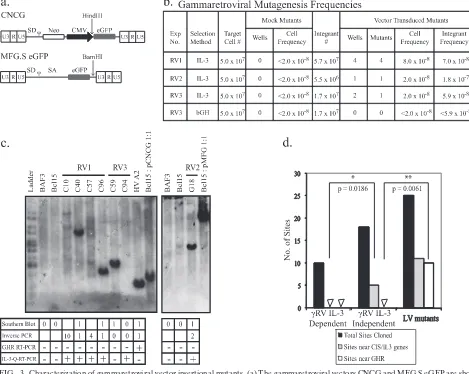
IL-FIG. 3. Characterization of gammaretroviral-vector insertional mutants. (a) The gammaretroviral vectors CNCG and MFG.S eGFP are shown.
The locations of the unique HindIII and BamHI restriction sites used in Southern blotting of CNCG and MFG.S eGFP insertional mutants,
respectively, are also shown. (b) Gammaretroviral-mutagenesis frequencies. The CNCG vector was used in experiments RV1 and RV3; MFG.S
eGFP was used in RV2. IL-3-independent mutants were selected either according to the IL-3 selection protocol (IL-3; RV1 to RV3) or in serum
supplemented with 1
g/ml bGH (bGH; RV3 only). The number of flasks (IL-3 selection) or wells (bGH selection) in which IL-3-independent
clones grew out was scored after 7 to 10 days and 4 to 6 weeks, respectively (fourth and seventh columns). Observations from these four
experiments using gammaretroviral vectors were pooled. Statistically significant differences between the numbers of wells (
P
⫽
0.0286) and mutants
(
P
⫽
0.0286) in the mock- and vector-transduced groups were seen with a Mann-Whitney U test. The cell frequency was calculated by dividing
the number of independent mutants by the total number of target cells in each experiment. The integrant frequency was calculated by dividing the
number of independent mutants by the total number of integrants in each experiment. (c) Southern blots of gammaretroviral insertional mutants
from experiments RV1 to RV3. Genomic DNA was digested with HindIII (RV1 and RV3) or BamHI (RV2). Blots were probed with the cDNA
for enhanced GFP (eGFP). The tables below the blots show estimated vector copy numbers and the number of integration sites in each mutant
that were cloned by inverse PCR. In addition, RT-PCR for the Ghr transcript and qRT-PCR for the IL-3 transcript were performed as described
in the legend for Fig. 1d. Mutant C94 was eliminated from the analysis as no integrated vector copies were demonstrated by qPCR. (d) Comparison
of genes targeted by vector integration in gammaretroviral-vector-transduced IL-3-independent mutants (
␥
RV IL-3 independent);
gammaretro-viral-vector-transduced IL-3-dependent clones, cloned by limiting dilution (
␥
RV IL-3 dependent); and WT LTR lentiviral-vector-transduced
IL-3-independent mutants (LV mutants). Sites near CIS genes or the IL-3 gene are significantly more frequent targets of gammaretroviral-vector
integration in RV experiment mutants than in RV experiment clones (two-tailed
P
value, 0.0186; Mann-Whitney U test). The
Ghr
gene is
preferentially targeted by WT LTR lentiviral-vector integration but not gammaretroviral-vector integration in IL-3-independent mutants
(two-tailed
P
value, 0.0061; Mann-Whitney U test).
on November 8, 2019 by guest
http://jvi.asm.org/
[image:9.585.51.520.73.447.2]3-independent phenotype (Table 5). None of the
gammaret-roviral-vector mutants expressed
Ghr
mRNA, although all
ex-pressed IL-3 mRNA. This suggests either that some or all of
the integrations have an effect on IL-3 gene expression or that
spontaneously upregulated IL-3 expression cooperates with
retroviral-vector insertion to generate robust
IL-3-indepen-dent cells. An interesting preceIL-3-indepen-dent which could be explained
by either of these mechanisms was described for the WEHI-3B
myeloid leukemia cell line, which has intracisternal A particle
insertions in both the HoxB locus and the IL-3 locus and
secretes IL-3 (4).
DISCUSSION
[image:10.585.44.540.78.529.2]This cell line assay has detected similar rates but different
mechanisms of mutagenesis by lentiviral and gammaretroviral
TABLE 5. Gammaretroviral vector integration sites in IL-3-independent mutants (experiments RV1 and RV2)
aExpt, clone No. of ISb
In
genec Gened
Entrez Gene
ID
Chromosome Distance to TSSe Orientationf Predicted gene functiong
No. of RTCGD
hit(s)h
RV1
C10 10 Y Slc36a3 215332 11 3,539 bp, intron 3-4 ⫹ Proton amino acid transporter 1 Y Mamdc2 71738 19 96 kb, intron 8-9 ⫺
N 16
N Srm 20810 4 1,003 bp upstream ⫺ Spermidine synthase
Y Psma6 26443 12 685 bp, intron 1-2 ⫹ Endopeptidase/hydrolase activity
1
N 13
N Zdhhc4 72881 5 165 bp upstream ⫺ Zinc ion binding, acetyltransferase activity
N 4
N Mvd 192156 8 1,030 bp upstream ⫺ Diphosphomevalo-nate
decarboxylase activity
N Dusp6 67603 10 4,740 bp downstream Dual specificity phosphatase 6 4 C40 1 N Osbpl3 71720 6 46 kb upstream ⫹ Lipid transport, steroid
metabolism
4 CIS
C57 4 Y Myl4 17896 11 802 bp, intron 1-2 ⫹ Motor activity 1
N Cdc27 217232 1,067 bp upstream ⫺ Cell division
Y Sema4b 20352 7 21 kb, intron 2-3 ⫹ Cell differentiation, nervous system development
5 CIS
N 9
Y Gata1 14460 X 4,241 bp, intron 1-2 ⫹ Transcription factor activity C96 1 Y Rps16 20055 7 779 bp, intron 2-3 ⫹ Structural constituent of
ribosome
N Zfp36/Plekhg2 101497 21 kb downstream ⫺ Guanyl nucleotide exchange factor activity
9 CIS
RV2
G18 2 N Il3 16187 11 2,607 bp downstream ⫹ Cytokine/growth factor activity
N Fbxo9 71538 9 3,183 bp upstream ⫹ Ubiquitin-protein ligase activity
N Ick 56542 5,744 bp upstream ⫺ Protein kinase activity, signal
transduction
Control
CNCG 2 1 Y Tpm3 59069 3 8,408 bp, intron 2-3 ⫹ Regulation of muscle
contraction
1
CNCG 6 1 N Mll2 381022 15 1,564 bp upstream ⫺ Mixed-lineage leukemia 2
Rhebl1 69159 8,515 bp downstream ⫺ Ras homolog enriched in brain like 1
Dhh 13363 26 kb downstream ⫺ 1
CNCG 14 1 N 8430427 H17Rik 329540 2 13.6 kb upstream ⫺ 2
CNCG 15 2 N 18
Sh3gl1 20405 17 653 bp upstream ⫺ SH3 domain-containing GRB2-like protein 1 Chaf1a 27221 3,186 bp upstream ⫹
Mpnd 68047 28 kb upstream ⫹
CNCG17 1 N Cnbp2 75064 X 12.8 kb downstream ⫺ 1
CNCG18 2 N 16
N TRAF3 22031 12 720 bp upstream ⫺ Tumor necrosis factor receptor-associated factor 3
2
MFG4 1 N 12
MFG26 1 N Dnmt3a 13435 12 17 kb upstream ⫹ DNA methyltransferase 1
a
Integration sites were cloned by inverse PCR or LM-PCR from mutants obtained in experiments RV1 and RV2. Mutants from experiments RV1 and RV2 were IL-3 independent. Clones from control experiments were IL-3 dependent.
b
IS, insertion site(s). Data show the number of insertion site loci identified in the mutant by integration site PCR.
c
Y, yes; N, no.
d
If an insertion is not in a gene, the nearest gene(s) within 30 kb up- or downstream of the insertion site is listed. TheGhrinsertion sites were obtained by inverse PCR.
e
TSS, transcription start site. For insertion sites, the distance to the transcription start site of the nearest gene and the intron into which the vector is inserted, where applicable (between numbered exons), are shown, except in the case ofGhrinsertions.
f
Indicates whether the vector insertion occurred in the same (⫹) or in the opposite (⫺) orientation as the gene’s transcript.
g
Predicted gene function is shown where known.
h
The number of appearances in the RTCGD of each insertion site locus is shown where applicable, and loci defined as CIS (http://RTCGD.ncifcrf.gov) are indicated.
292
BOKHOVEN ET AL.
J. V
IROL.
on November 8, 2019 by guest
http://jvi.asm.org/
vectors. The major mechanism used by the lentiviral vector
involves an HIV LTR-initiated transcript that expresses
Ghr
. A
similar insertional mutagenesis mechanism has been reported
for retroviruses, using, for example, a cryptic splice donor
within the virus to express a Myb protein (27). The activity of
the HIV LTR in the
Ghr
locus in the absence of the HIV Tat
protein is surprising, although LTR activity in the absence of
Tat is required to reactivate the virus from latency (36). Why
this particular locus favors lentiviral-vector mutagenesis in
BAF3 cells is unclear, and it is likely that this is a cell-specific
phenomenon. We do not know whether it is a preferred
inte-gration site, a preferred site for HIV LTR activity, a large
intronic region preceding the first coding exon, or a
combina-tion of all these factors. However, the fact that this mechanism
of mutagenesis can occur demonstrates that the HIV LTR
should be inactivated by enhancer/promoter deletion, which
we have shown reduces the rate of mutagenesis, to improve
safety. Deletion of the enhancer/promoter is readily achieved,
whereas deletion of the splice donor site is difficult as it is
required to inhibit vector polyadenylation at the 5
⬘
LTR. In a
recent AIDS gene therapy clinical trial, a WT HIV-1 LTR
lentiviral vector was used to drive antisense RNA against the
1 envelope, so that Tat would activate expression in
HIV-infected cells (17). In this type of vector, a splice acceptor is
also present, which may prevent lentiviral-vector activation of
downstream genes.
In comparison with the lentiviral vector, one mechanism of
mutagenesis by MLV retroviral vectors in these cells appears
to be that of enhancer insertion into the IL-3 gene or CIS.
These results suggest that this cell line is a reasonable
surro-gate assay for the transformation of primary hematopoietic
cells by MLV vectors. Why MLV vectors do not cause
inser-tional mutagenesis by
Ghr
upregulation, either by MLV
en-hancer activity on the
Ghr
promoter or by a mechanism similar
to that of the HIV vector, is also unclear. The MLV vectors do
contain a splice donor site, and the CNCG vector does not
contain a splice acceptor. The two types of vector show
differ-ent integration site preferences; both favor integration into
coding rather than noncoding regions. However, MLV tends to
integrate near the transcription start site, and HIV shows a
stronger preference for expressed genes (20, 38). These
gen-eral preferences do not explain why
Ghr
in mouse cells is not
a target for MLV.
This type of assay does not provide a clinically relevant
safety measure. An animal disease model, perhaps engineered
to accelerate tumor formation, might be more clinically
rele-vant. However, our assay does provide a general method to
quantitate insertional mutagenesis. It can be used to test a
number of other types of retroviral vectors, and it can also be
adapted for human cells by using a human cytokine-dependent
cell line.
ACKNOWLEDGMENTS
This work was funded by the United Kingdom Department of
Health, the United Kingdom Health and Safety Executive, and the
International Journal of Experimental Pathology.
We thank Mustafa Ceylan for IL-3 qRT-PCR analysis; Abhinav
Gupta for mutagenesis experiments; and Giada Mattiuzzo, Conrad
Vink and David Escors for help with experiments. We thank Gregg
Bogosian, Research Director in Agricultural Biotechnology,
Mon-santo, for bGH.
M.B. designed and performed most experiments; S.L.S. contributed
inverse PCR and Fig. 2a, b, and c; S.K. contributed to Table 5 and to
the HV mutagenesis experiments; E.F.G. contributed advice and Fig.
2f; I.C.R. contributed advice; Y.T. conceived and supervised the work;
M.K.C. conceived and supervised the work and wrote the paper.
REFERENCES
1.Aiuti, A., S. Slavin, M. Aker, F. Ficara, S. Deola, A. Mortellaro, S. Morecki, G. Andolfi, A. Tabucchi, F. Carlucci, E. Marinello, F. Cattaneo, S. Vai, P. Servida, R. Miniero, M. G. Roncarolo, and C. Bordignon.2002. Correction of ADA-SCID by stem cell gene therapy combined with nonmyeloablative conditioning. Science296:2410–2413.
2.Akagi, K., T. Suzuki, R. M. Stephens, N. A. Jenkins, and N. G. Copeland. 2004. RTCGD: retroviral tagged cancer gene database. Nucleic Acids Res. 32:D523–D527.
3.Baixeras, E., S. Jeay, P. A. Kelly, and M. C. Postel-Vinay.2001. The prolif-erative and antiapoptotic actions of growth hormone and insulin-like growth factor-1 are mediated through distinct signaling pathways in the Pro-B Ba/F3 cell line. Endocrinology142:2968–2977.
4.Blatt, C., D. Aberdam, R. Schwartz, and L. Sachs.1988. DNA rearrange-ment of a homeobox gene in myeloid leukaemic cells. EMBO J.7:4283–4290. 5.Carteau, S., C. Hoffmann, and F. Bushman.1998. Chromosome structure and human immunodeficiency virus type 1 cDNA integration: centromeric alphoid repeats are a disfavored target. J. Virol.72:4005–4014.
6.Cavazzana-Calvo, M., S. Hacein-Bey, G. de Saint Basile, F. Gross, E. Yvon, P. Nusbaum, F. Selz, C. Hue, S. Certain, J. L. Casanova, P. Bousso, F. L. Deist, and A. Fischer.2000. Gene therapy of human severe combined im-munodeficiency (SCID)-X1 disease. Science288:669–672.
7.Clive, D., W. G. Flamm, M. R. Machesko, and N. J. Bernheim.1972. A mutational assay system using the thymidine kinase locus in mouse lym-phoma cells. Mutat. Res.16:77–87.
8.Collins, M. K., J. Marvel, P. Malde, and A. Lopez-Rivas.1992. Interleukin 3 protects murine bone marrow cells from apoptosis induced by DNA dam-aging agents. J. Exp. Med.176:1043–1051.
9.Davis, B., E. Linney, and H. Fan.1985. Suppression of leukaemia virus pathogenicity by polyoma virus enhancers. Nature314:550–553.
10.Demaison, C., K. Parsley, G. Brouns, M. Scherr, K. Battmer, C. Kinnon, M. Grez, and A. J. Thrasher.2002. High-level transduction and gene expression in hematopoietic repopulating cells using a human immunodeficiency [cor-rection of imunodeficiency] virus type 1-based lentiviral vector containing an internal spleen focus forming virus promoter. Hum. Gene Ther.13:803–813. 11.Du, Y., S. E. Spence, N. A. Jenkins, and N. G. Copeland.2005. Cooperating cancer-gene identification through oncogenic-retrovirus-induced insertional mutagenesis. Blood106:2498–2505.
12.Edens, A., and F. Talamantes.1998. Alternative processing of growth hor-mone receptor transcripts. Endocr. Rev.19:559–582.
13.Hacein-Bey-Abina, S., C. Von Kalle, M. Schmidt, M. P. McCormack, N. Wulffraat, P. Leboulch, A. Lim, C. S. Osborne, R. Pawliuk, E. Morillon, R. Sorensen, A. Forster, P. Fraser, J. I. Cohen, G. de Saint Basile, I. Alexander, U. Wintergerst, T. Frebourg, A. Aurias, D. Stoppa-Lyonnet, S. Romana, I. Radford-Weiss, F. Gross, F. Valensi, E. Delabesse, E. Macintyre, F. Sigaux, J. Soulier, L. E. Leiva, M. Wissler, C. Prinz, T. H. Rabbitts, F. Le Deist, A. Fischer, and M. Cavazzana-Calvo. 2003. LMO2-associated clonal T cell proliferation in two patients after gene therapy for SCID-X1. Science302: 415–419.
14.Ikeda, Y., Y. Takeuchi, F. Martin, F. L. Cosset, K. Mitrophanous, and M. Collins.2003. Continuous high-titer HIV-1 vector production. Nat. Biotech-nol.21:569–572.
15.Kopchick, J. J., and J. M. Andry.2000. Growth hormone (GH), GH recep-tor, and signal transduction. Mol. Genet. Metab.71:293–314.
16.Kustikova, O., B. Fehse, U. Modlich, M. Yang, J. Dullmann, K. Kamino, N. von Neuhoff, B. Schlegelberger, Z. Li, and C. Baum.2005. Clonal dominance of hematopoietic stem cells triggered by retroviral gene marking. Science 308:1171–1174.
17.Levine, B. L., L. M. Humeau, J. Boyer, R. R. MacGregor, T. Rebello, X. Lu, G. K. Binder, V. Slepushkin, F. Lemiale, J. R. Mascola, F. D. Bushman, B. Dropulic, and C. H. June.2006. Gene transfer in humans using a condition-ally replicating lentiviral vector. Proc. Natl. Acad. Sci. USA 103:17372– 17377.
18.Li, Z., O. S. Kustikova, K. Kamino, T. Neumann, M. Rhein, E. Grassman, B. Fehse, and C. Baum.2007. Insertional mutagenesis by replication-deficient retroviral vectors encoding the large T oncogene. Ann. N. Y. Acad. Sci. 1106:95–113.
19.Menon, R. K., A. Shaufl, J. H. Yu, D. A. Stephan, and R. P. Friday.2001. Identification and characterization of a novel transcript of the murine growth hormone receptor gene exhibiting development- and tissue-specific expres-sion. Mol. Cell. Endocrinol.172:135–146.
20.Mitchell, R. S., B. F. Beitzel, A. R. Schroder, P. Shinn, H. Chen, C. C. Berry, J. R. Ecker, and F. D. Bushman.2004. Retroviral DNA integration: ASLV, HIV, and MLV show distinct target site preferences. PLoS Biol.2:E234. 21.Modlich, U., J. Bohne, M. Schmidt, C. von Kalle, S. Knoss, A. Schambach,
on November 8, 2019 by guest
http://jvi.asm.org/
and C. Baum.2006. Cell-culture assays reveal the importance of retroviral vector design for insertional genotoxicity. Blood108:2545–2553.
22.Montini, E., D. Cesana, M. Schmidt, F. Sanvito, M. Ponzoni, C. Bartholo-mae, L. Sergi Sergi, F. Benedicenti, A. Ambrosi, C. Di Serio, C. Doglioni, C. von Kalle, and L. Naldini.2006. Hematopoietic stem cell gene transfer in a tumor-prone mouse model uncovers low genotoxicity of lentiviral vector integration. Nat. Biotechnol.24:687–696.
23.Ott, M. G., M. Schmidt, K. Schwarzwaelder, S. Stein, U. Siler, U. Koehl, H. Glimm, K. Kuhlcke, A. Schilz, H. Kunkel, S. Naundorf, A. Brinkmann, A. Deichmann, M. Fischer, C. Ball, I. Pilz, C. Dunbar, Y. Du, N. A. Jenkins, N. G. Copeland, U. Luthi, M. Hassan, A. J. Thrasher, D. Hoelzer, C. von Kalle, R. Seger, and M. Grez.2006. Correction of X-linked chronic granu-lomatous disease by gene therapy, augmented by insertional activation of MDS1-EVI1, PRDM16 or SETBP1. Nat. Med.12:401–409.
24.Palacios, R., and M. Steinmetz.1985. Il-3-dependent mouse clones that express B-220 surface antigen, contain Ig genes in germ-line configuration, and generate B lymphocytes in vivo. Cell41:727–734.
25.Pike-Overzet, K., D. de Ridder, F. Weerkamp, M. R. Baert, M. M. Verstegen, M. H. Brugman, S. J. Howe, M. J. Reinders, A. J. Thrasher, G. Wagemaker, J. J. van Dongen, and F. J. Staal.2006. Gene therapy: is IL2RG oncogenic in T-cell development? Nature443:E5.
26.Riviere, I., K. Brose, and R. C. Mulligan.1995. Effects of retroviral vector design on expression of human adenosine deaminase in murine bone marrow transplant recipients engrafted with genetically modified cells. Proc. Natl. Acad. Sci. USA92:6733–6737.
27.Shen-Ong, G. L., H. C. Morse III, M. Potter, and J. F. Mushinski.1986. Two modes of c-myb activation in virus-induced mouse myeloid tumors. Mol. Cell. Biol.6:380–392.
28.Shiramizu, B., B. G. Herndier, and M. S. McGrath.1994. Identification of a common clonal human immunodeficiency virus integration site in human immunodeficiency virus-associated lymphomas. Cancer Res.54:2069–2072. 29.Shou, Y., Z. Ma, T. Lu, and B. P. Sorrentino.2006. Unique risk factors for
insertional mutagenesis in a mouse model of XSCID gene therapy. Proc. Natl. Acad. Sci. USA103:11730–11735.
30.Soneoka, Y., P. M. Cannon, E. E. Ramsdale, J. C. Griffiths, G. Romano, S. M. Kingsman, and A. J. Kingsman.1995. A transient three-plasmid expression system for the production of high titer retroviral vectors. Nucleic Acids Res.23:628–633.
31.Stocking, C., R. Kollek, U. Bergholz, and W. Ostertag.1985. Long terminal repeat sequences impart hematopoietic transformation properties to the myeloproliferative sarcoma virus. Proc. Natl. Acad. Sci. USA82:5746–5750. 32.Stocking, C., C. Loliger, M. Kawai, S. Suciu, N. Gough, and W. Ostertag. 1988. Identification of genes involved in growth autonomy of hematopoietic cells by analysis of factor-independent mutants. Cell53:869–879. 33.Thomas, J., Y. Leverrier, and J. Marvel.1998. Bcl-X is the major pleiotropic
anti-apoptotic gene activated by retroviral insertion mutagenesis in an IL-3 dependent bone marrow derived cell line. Oncogene16:1399–1408. 34.Vogt, M., C. Haggblom, S. Swift, and M. Haas.1985. Envelope gene and long
terminal repeat determine the different biological properties of Rauscher, Friend, and Moloney mink cell focus-inducing viruses. J. Virol.55:184–192. 35.Weber, F., and W. Schaffner.1985. Enhancer activity correlates with the
oncogenic potential of avian retroviruses. EMBO J.4:949–956.
36.Williams, S. A., H. Kwon, L. F. Chen, and W. C. Greene.2007. Sustained induction of NF-B is required for efficient expression of latent human immunodeficiency virus type 1. J. Virol.81:6043–6056.
37.Woods, N. B., V. Bottero, M. Schmidt, C. von Kalle, and I. M. Verma.2006. Gene therapy: therapeutic gene causing lymphoma. Nature440:1123. 38.Wu, X., Y. Li, B. Crise, and S. M. Burgess.2003. Transcription start regions
in the human genome are favored targets for MLV integration. Science 300:1749–1751.
39.Zhang, F., S. I. Thornhill, S. J. Howe, M. Ulaganathan, A. Schambach, J. Sinclair, C. Kinnon, H. B. Gaspar, M. Antoniou, and A. J. Thrasher.2007. Lentiviral vectors containing an enhancer-less ubiquitously acting chromatin opening element (UCOE) provide highly reproducible and stable transgene expression in hematopoietic cells. Blood110:1448–1457.
294
BOKHOVEN ET AL.
J. V
IROL.
on November 8, 2019 by guest
http://jvi.asm.org/