I
University of Southern Queensland
Faculty of Health, Engineering and Sciences
Improved Transfer Chute Design Using DEM
Software to Predict Material Flow Behaviour
A dissertation Submitted by
Alex Mason
in fulfilment of the requirements of
ENG4111 and 4112 Research Project
towards the degree of
Bachelor of Engineering (Honours) (Mechanical)
II
Abstract
Over the last decade the author has designed 20 or more chutes and been involved in the modification of 100's of others. However this work was all based on rules of thumb, with limited input from flow characteristics of the material being transferred. Although there are specific benefits to this rule of thumb based design, the end result is often a less then optimal chute design and the associated increase in operational costs.
The latest trend in chute design is to accurately model the granular flow through the chute using Discrete Element Method (DEM) software. The use of this software has been well documented in many research papers, particularly in the last 15 years. If used correctly DEM can serve as a valuable tool in predicting the behaviour of the granular material, highlighting the areas of impact and wear within the chute as well as the position, velocity and direction of the chute discharge, the latter of which is import in reducing belt wear of the conveyor.
III
Disclaimer
University of Southern Queensland
Faculty of Health, Engineering and Surveying
ENG4111 & ENG4112 Research Project
Limitation of Use
The Council of the University of Southern Queensland, its Faculty of Health, Engineering and Sciences, and the staff of the University of Southern Queensland, do not accept any responsibility for the truth, accuracy or completeness of material contained within or associated with this dissertation.
Persons using all or any part of this material do so at their own risk, and not at the risk of the Council of the University of Southern Queensland, its Faculty of Health, Engineering and Sciences or the staff of the University of Southern Queensland.
IV
Certification
University of Southern Queensland
Faculty of Health, Engineering and Surveying
ENG4111 & ENG4112 Research Project
I certify that the ideas, designs and experimental work, results, analyses and conclusions set out in this dissertation are entirely my own effort, except where otherwise indicated and acknowledged.
V
Acknowledgements
I would like to thank the project supervisor Dr Cahn-Dung Tran for his help and guidance on this research project.
I would like to thank Mark Rennie for his guidance, support and patience in helping complete this project. Mark assisted me in the choosing a suitable transfer chute for my project, facilitated the initial contact with Fremantle Ports and provided the resources required to carry the site visits and subsequent simulations. Mark also provided me a lot of invaluable information including the background of the port facility and suggestions in design improvements for this project, as well as financing a training course in the use of BFA software at Overland Conveyor office in Denver, Colorado.
I would also like to thank Fremantle Ports for allowing access to their facility in particular John Stewart for his interest and permission to conduct my project at Kwinana Bulk Terminal and Mufid Sain for his assistance with the site visits.
VI
Contents
Abstract ... ii
Disclaimer ... iii
Certification ... iv
Acknowledgements ... v
List of Figures ... ix
Appendices ... xvi
Glossary of Terms ... xvii
Chapter 1 Introduction ... 1
1.1 Introduction ... 1
1.2 Research Problem & Motivation ... 4
1.3 Research Objectives ... 5
1.4 Outline of research ... 5
Chapter 2 Background Research ... 7
2.1 Introduction ... 7
2.2 Literature review ... 9
2.3 Bulk Flow Analyst ... 26
VII
3.1 Introduction ... 30
3.2 Phase 1: Recording of transfer chute operation ... 31
3.3 Development of transfer chute design ... 34
3.4 Simulation of transfer chute using DEM ... 35
3.5 Resource requirements ... 44
3.6 Site Investigation ... 45
3.7 Site Visit 1 ... 45
3.8 Site Visit 2 ... 46
3.9 Site Visit 3 ... 47
3.10 Conclusion ... 50
Chapter 4 CAD Modelling of Transfer Station ... 51
4.1 Introduction ... 51
4.2 Model Requirements and Rationalisation... 51
4.3 Transfer Station Model ... 52
4.4 Conclusion ... 53
Chapter 5 Simulation of Existing Transfer Station ... 54
5.1 Introduction ... 54
5.2 Simulation Configuration ... 54
VIII
5.4 Results ... 63
5.5 Conclusion ... 65
Chapter 6 Improved Transfer Chute Design ... 67
6.1 Introduction ... 67
6.2 Chute Modification Option 1 ... 67
6.3 Chute Modification Option 2 ... 69
6.4 Chute Modification Option 3 ... 72
6.5 Conclusion ... 74
Chapter 7 Conclusion and Further Work ... 76
7.1 Achievement of Project Objectives ... 76
7.2 Conclusion ... 76
7.3 Further Work ... 78
References ... 80
Appendix A. ... 82
Project Specification ... 83
Appendix B. ... 84
Appendix C. ... 94
Appendix D. ... 97
IX
List of Figures
Figure 1-1 Shiploader dumping iron ore into the cargo hold of a bulk transport ship Source:
www.fremantleports.com.au ... 2
Figure 1-2 Front end loader transferring iron ore from the stockpile to the loadout conveyor. Source: www.fremantleports.com.au ... 2
Figure 1-3 Stackers stacking iron ore in operation Source: www.fremantleports.com.au ... 3
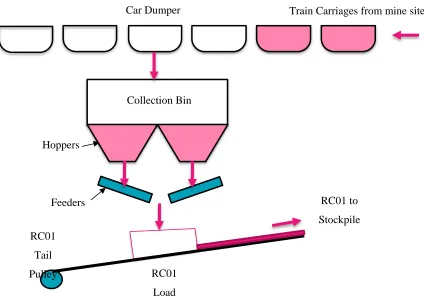
Figure 1-4 Process flow diagram of Car Dumper Transfer Station. ... 4
Figure 2-1 Valley Angle Source: www.bulksolidsflow.com.au ... 11
Figure 2-2 Impact plate Source: David, S., ‘Transfer Chute Design Fundamentals’ ... 12
Figure 2-3 Rock Box Source: David, S., ‘Transfer Chute Design Fundamentals’ ... 13
Figure 2-4 Surge charge angle of belt conveyor Source: unknown ... 14
Figure 2-5 Preferred Arrangement of Load-out Chute Source: Arnold, P.C. ‘Bulk Solids: Storage, Flow and Handling’ ... 14
Figure 2-6 DEM simulation showing flow issues and improvement Source: Khambekar et al, ‘Chutes and Suitability’ ... 16
Figure 2-7 Belt misalignment due to off centre loading Source: www.shippbelting.com ... 17
Figure 2-8 Belt edge damage from misalignment Source: www.esseng.com.au ... 17
X Figure 2-10 Angle of repose Source: Swinderman et al, ‘The Practical Resource for Cleaner,
Safer, More Productive Dust and Material Control’ ... 20
Figure 2-11 - Shear Cell Source: (Swinderman et al. 2009) ... 21
Figure 2-12 - Mohr's Circle Source: (Swinderman et al. 2009) ... 21
Figure 2-13 - Internal Friction Angle Source: (Swinderman et al. 2009) ... 21
Figure 2-14 - Interface Friction Source: (Swinderman et al. 2009) ... 22
Figure 2-15 Particle overlap Source: (Favier et al. 2009) ... 25
Figure 2-16 Damped harmonic motion model Source: (Bharadwaj 2012) ... 25
Figure 3-1 Material Properties User Interface... 36
Figure 3-2 Boundary User Interface ... 38
Figure 3-3 Boundary with Traction User Interface ... 39
Figure 3-4 Extruded Boundary with Traction ... 40
Figure 3-5 Injection Box User Interface ... 41
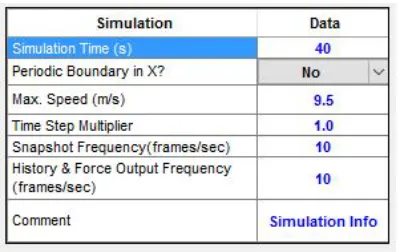
Figure 3-6 Simulation User Interface ... 42
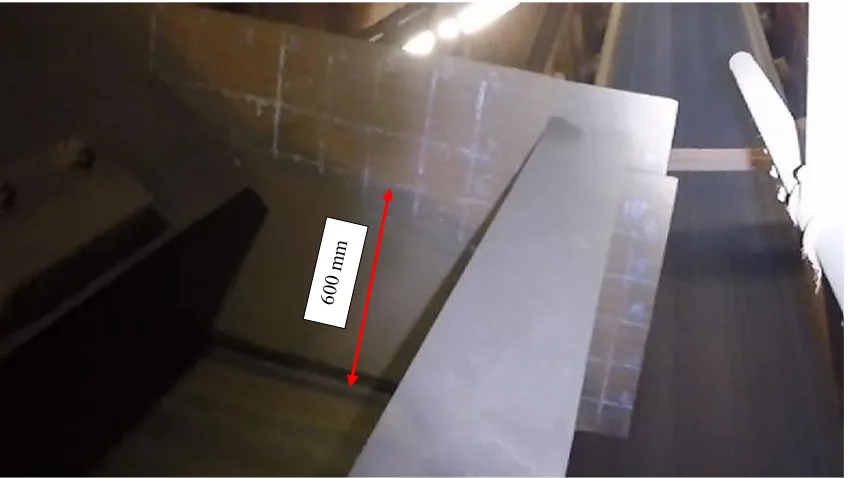
Figure 3-7 100 x 100 mm grid on feeder side plate. ... 46
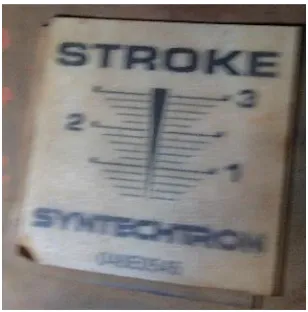
Figure 3-8 Vibration Stroke indicator on feeder ... 47
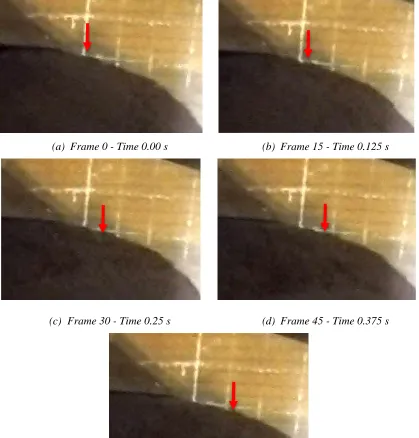
Figure 3-9 Time step sequence of particle past grid line. ... 48
Figure 3-10 Feeder bed depth ... 49
XI
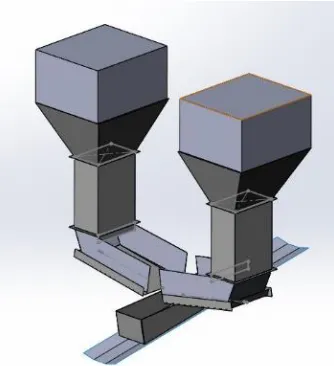
Figure 4-1 Model of transfer station ... 53
Figure 4-2 Image of transfer station ... 53
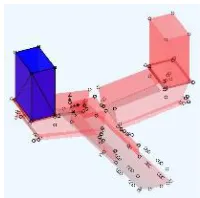
Figure 5-1 Initial model overview ... 55
Figure 5-2 Injection box near side ... 55
Figure 5-3 Injection Box far side ... 55
Figure 5-4 Feeder near side ... 56
Figure 5-5 Feeder far side ... 56
Figure 5-6 Belt ... 57
Figure 5-7 Skirts ... 58
Figure 5-8 Feeder ... 58
Figure 5-9 Hopper ... 58
Figure 5-10 Hopper Height ... 58
Figure 5-11 Material build up and particle explosion. ... 59
Figure 5-12 Belt Friction Analysis ... 61
Figure 5-13 Mass Balancing ... 61
Figure 5-14 Good Material Spread ... 62
Figure 5-15 Marginal Material Spread ... 62
Figure 5-16 Poor Material Spread ... 62
XII
Figure 5-18 Basic and Delayed Configurations Bed Depth ... 63
Figure 5-19 Comparison of non-central loading ... 65
Figure 6-1 Insert Created in SolidWorks ... 68
Figure 6-2 Insert Positioned in BFA Model ... 68
Figure 6-3 Simulation of Option 1 ... 69
Figure 6-4 Tapered Extension ... 70
Figure 6-5 Extension Positioned in BFA Model ... 70
Figure 6-6 Material Profile Comparison Showing Improved Load Centralization Profile View ... 71
Figure 6-7 Material Profile Comparison Showing Improved Load Centralization Top View 71 Figure 6-8 Insert Option 3, Vertical Sides with 80° Angled Back ... 72
Figure 6-9 Extension and Insert Positioned in BFA Model ... 72
Figure 6-10 Material Profile Comparison Showing Improved Material Profile ... 74
Figure B-1 Spillage adjacent to chute outlet. ... 85
Figure B-2 Longitudinal wear lines. ... 86
Figure B-3 Belt lift ... 87
Figure B-4 Flattening of belt at chute outlet. ... 87
Figure B-5 Tail pulley, left side. ... 88
XIII
Figure B-7 View from tail end showing non- central loading on belt. ... 88
Figure B-8 One feeder in operation. ... 89
Figure B-9 Lack of load profile ... 89
Figure B-10 No back flow ... 89
Figure B-11 Backflow ... 89
Figure B-12 Surging ... 90
Figure B-13 Material slumping action ... 93
Figure C-1 Taken from Drawing 600196043-0100-ME-DRG-0001 ... 95
Figure C-2 Taken from Drawing 600196043-0100-ME-DRG-0002 ... 95
XIV
List of Tables
Table 3-1 Resource Requirements ... 44
Table 5-1 Initial Injection Box parameters ... 55
Table 5-2 Initial feeder parameters ... 56
Table 5-3 Initial Conveyor parameters ... 57
Table 5-4 Initial Chute parameters ... 57
Table 5-5 Initial material parameters ... 58
Table 5-6 Initial simulation parameters ... 59
Table 5-7 Particle Size ... 60
Table E-1 Injection Boxes ... 100
Table E-2 Conveyor Belts ... 100
Table E-3 Feeders for Basic Configeration ... 101
Table E-4 Feeders for Delayed Configuration ... 101
Table E-5 Chutes ... 101
Table E-6 Material Radius 15 mm to 20 mm ... 102
Table E-7 Material radius 40 mm ... 102
Table E-8 Simulation Basic Configuration ... 103
Table E-9 Simulation Basic Results ... 103
XV
Table E-11 Simulation Delay Start Results ... 105
Table E-12 Feeder Extensions ... 105
Table E-13Inserts ... 106
Table E-14 Simulation Configuration & Results for Insert Only ... 106
Table E-15 Simulation Configuration & Results for Feeder Extension Only ... 107
XVI
Appendices
Appendix A – Project Specification
Appendix B – Record of Issues Found.
Appendix C – Drawings from FPA.
Appendix D – Equipment Measurements.
XVII
Glossary of Terms
The following abbreviations have been used:
3D Three Dimensional
BFA Bulk Flow Analyst
CAD Computer Aided Drafting
CEMA Conveyor Equipment Manufacturers Association.
CFD Computational Fluid Dynamics
DEM Discrete Element Modelling
FPA Fremantle Port Authority
KBT Kwinana Bulk Terminal
Adhesion When material sticks to a surface.
Angle of Repose The angle which the surface of a normal freely formed pile makes to the horizontal.
Angle of Surcharge The angle to the horizontal which the surface of the material forms while at rest on a moving conveyor belt.
Belt The rubber component that carries the material on a conveyor.
Belt Tracking Axial movement along the pulley the belt makes during conveyor operation.
Beltweigher An appliance that continuously weighs the conveyor belt to determine mass flow rates.
Bin A large container that provides storage capacity for product. Brownfield Project that upgrades an existing plant or facility.
Bulk Density It is the weight per unit volume of quantity of solid particles, expressed in kilograms per cubic meter.
XVIII Car Dumper A group of machines that systematically handles the removal of
product from rail cars.
Carry Top length of belt that carries the product from tail to head.
Carry-back Material that has adhered to the belt and is carried back to the tail pulley.
Cohesion When material particles stick to each other. Dump Discharge material from a height for storage.
Dust Extraction Removal of dust laden air by suction nozzles and ducts.
Feeder A machine the extracts a controlled flow of material from under a bin.
Fines Material / particles smaller than 9.5mm in diameter.
Greenfield Project that builds a brand new facility where no facility currently exists.
Head Pulley Pulley at the discharge end of the conveyor. Belt goes from carry to return.
Hood A product deflection plate that controls the trajectory of material as it discharges from the conveyor.
Hopper The shaped conical section under a bin.
Impact Angle Angle formed by flowing product and an internal surface of a chute.
Impact Plate Plate used as a sacrificial surface for directing material flow, also known as bash plate.
Impact Zone Area where the particles contact the receiving belt or equipment. Inloading Material coming into a facility.
Lining Hard replaceable surface used for protection of chute structure. Material Used as an abbreviated form for bulk material.
Name Plate Capacity The designed capacity of a processing facility. Usually in millions of tonestonnes per annum.
XIX Product Granular material mass transported through a conveyor system.
Also called bulk material or material.
Profile The desired shape product forms on a conveyor belt. Pulley Cylinders which allow the belt to change direction.
Return Bottom length of belt where the belt travels empty from head to tail.
Rock Box The use of ledges to retain ore which in turn protects the chute structure.
Rotable Spares Complete spare component designed for quick replacement. Shiploader Conveyor system designed for loading ships.
Spoon A feed end deflector plate that is design to direct material in direction of conveyor.
Stacker Conveyor system designed for dumping ore into stockpiles. Stickiness Slang - Cohesion.
Stockpiles Large piles of ore stored prior to being processed or transported.
Tail Pulley Pulley at the very back end of the conveyor. Belt goes from return to carry.
Transfer Chute Structure that controls the flow of material from one piece of equipment to another.
1
Chapter 1
Introduction
This chapter will outline the intent of this project and the reason why it was chosen as a subject for this dissertation. Additionally it will provide an overview of the load facility at the Kwinana Bulk Terminal operated by Fremantle Port Authority.
1.1 Introduction
Fremantle Ports currently owns and operates the bulk material handling facility at Kwinana Bulk Terminal (KBT). In 2015 a total of 6.1 million tonnes of bulk material was exported through KBT of which approximately 4.5 million tonnes of that was iron ore (Fremantle Ports Annual Report 2015).
The majority of the land area in this port facility is utilised for stockpiles which are integral in facilitating rapid loading and unloading of the ships. While some stockpiles are located in large sheds for protection from the elements, the rest are stored in open areas known as stockpile yards.
Material to be exported from the port can be either trucked in by road or rail transport and is typically discharged or dumped into a hopper. Continuous transfer of the material from the hopper to the stockpiles and then from the stockpiles to the ship for export is carried out by a network of conveyors.
2
1.1.1
Loading/Unloading Jetty
[image:21.612.215.398.203.326.2]KBT loads and unloads a large variety of materials via its 498m jetty Kwinana Bulk Berth 2. A conveyor based transfer system known as a shiploader seen in Figure 1-1, is used dump the bulk material into the cargo hold of the ship. This method allows the material to move from a storage stockpile on land to the cargo hold as a continual process.
Figure 1-1 Shiploader dumping iron ore into the cargo hold of a bulk transport ship Source: www.fremantleports.com.au
1.1.2
Storage Stockpile
There are a number storage stockpiles at KBT with iron ore, coal, mineral sands and bauxite bulk materials typically stored in the open air yards. Bulk materials are loaded from the stock piles onto the outloading conveyor via a number of front end loaders (Figure 1-2). This allows for a large amount of versatility in the selection of stockpile yard the bulk material is taken from, with a relatively low infrastructure investment.
[image:21.612.213.398.513.635.2]3 The large open air stockpiles for bulk material at KBT are typically created by stackers, which operate in a similar fashion to shiploaders in that they utilise conveyors for the continuous transfer material as seen in Figure 1-3.
Figure 1-3 Stackers stacking iron ore in operation Source: www.fremantleports.com.au
The benefit of having stockpiles in the facility is to allow better management of the ship loading operations. As the productivity of the Port is proportional by the number of ships it loads per year, there is a strong economic incentive in reducing the time it takes to load each ship. As such the stockpiles provide a buffer between the materials imported by rail and exported by ship. Additionally stockpiles allow the organisation of different materials produced from a variety of companies to be separately stockpiled.
1.1.3
Car Dumper
4
1.2 Research Problem & Motivation
An opportunity to improve the transfer chute at Fremantle Ports became available due to a proposed upgrade of the existing vibratory feeders under the car dumper bin. As there are some ongoing issues associated with this section of the material handling plant, an investigation into an improved design of RC01 Feed Chute and tail end of conveyor RC01 arrangement is proposed to try and address these issues. The benefit would be to use the major shut works required for the feeder change out to implement these solutions.
This project will use DEM modelling as well as conventional transfer chute design techniques to improve the transfer chute design such that significant benefit can be gained through reduce plant maintenance. The benefit of utilising DEM simulation in this situation is to adequately show
Feeders
Collection Bin
Hoppers
RC01 Tail
Pulley RC01
Load
RC01 to Stockpile
[image:23.612.93.517.81.381.2]Train Carriages from mine site Car Dumper
5 improvements of the new design in comparison to the existing chute and thus provide confidence of success for any changes to the chute and hence reduce the risk of the project.
1.3 Research Objectives
The aim of this project is to improve the design of feed chute for RC01 conveyor, and then prove the benefits of the new design by using DEM simulation. The techniques developed in this project will be utilised on future transfer chute improvement projects.
The following tasks should be met to ensure the successful completion of this project:
− Conduct a literature review of transfer chute design and DEM modelling software. − Define, record and model existing chute operation.
− Develop and use a systematic method used to adjust material properties in the model to accurately simulate real life chute operation.
− Optimise chute design to increase capacity and reduce spillage. − Evaluate ore flow control under differing biased feed scenarios.
1.4 Outline of research
The research will present the use of DEM software and methods in transfer chute design. This dissertation is organised as follows.
Chapter 1 outlines the intent of this project and the reason why it was chosen as a subject for this dissertation. Additionally it will provide an overview of the load facility at the Kwinana Bulk Terminal operated by Fremantle Port Authority (FPA).
6 Chapter 3 will outline the methodology and techniques that will be utilised in firstly setting up the simulations, calibrating the model to recorded chute operation and analysing the results. It will also outline the findings of the three site visits conducted, detailing the issues found and measurements taken that will be used in the subsequent DEM analysis.
Chapter 4 will outline the creation of the CAD 3D model and its rationalisation for the use in the DEM software.
Chapter 5 will provide the set up and results from simulating the material flow through the existing transfer station set up in an attempt to replicate the issues noted in Appendix B. The simulation that best replicates the recorded flow issues will then be used in Chapter 6.
Chapter 6 will review the results of the existing and improved chute simulations and report on the comparative differences between the two designs.
7
Chapter 2
Background Research
This chapter will provide the reader with a brief background of bulk material handling plants with a specific focus on transfer chute design methods, design decisions or design features which could result in poor performance of a chute. The chapter then finishes with a background in the development of DEM software and its use in bulk material handling industry. The use of this work will be the foundation of the improvements developed for the new chute design.
2.1 Introduction
Conveyors are the prime transport method in bulk materials handling operations. Generally speaking, conveyors can only travel in straight lines, so transfer chutes are an essential element of a conveyor transfer system and cannot operate without them. Because successful operation of a transfer chute is essential for a conveyor system and non-performance of a conveyor system is extremely costly for bulk material operations, a lot of research has been conducted in the field of transfer chute design.
David Bickley (2011) states the following objectives of the transfer chute:
− To effectively control the transfer of the material. − To minimise material degradation.
− To minimise dust generation and egress.
− To consider ease of maintenance e.g. rotatable spares. − To minimise belt wear.
8 Historically or commonly, a transfer chute is designed to ensure material transferred from one conveyor or equipment to the other. Negating the other objectives, simple transfer chutes are relatively easy to design, particularly when dealing with dry, uniformly sized material. However, with each inclusion of the stated objectives comes an increase in design complexity due to the difficulty in accurately predicting material behaviour through the chute.
An example of the importance of material prediction occurs when looking at the chute discharge onto conveyors. With the correct design the ore stream can be controlled such that it is presented to the conveyor with the same velocity, thus reducing belt wear. As replacement costs of the conveyor belts can run into the $100,000’s, not including the associated project and downtime costs that are inherent in a belt change out operation, accurately predicting the material behaviour at discharge becomes highly significant to the design process.
The reasons behind a simplified or poor transfer chute design developments are mainly economical, transfer chutes are generally designed to a level of accuracy that is implied in the engineering contract. This is particularly true in greenfield or new projects, where the focus of priorities are constructability, cost and safety. Colin Benjamin (2015) states in his book The Transfer Chute Design Manual;
“Time and money drives our industry so it is not surprising that something as banal as a transfer point in a conveyor system can be overlooked or poorly considered during any initial designing of a materials handling facility.”(Benjamin et al. 2015, p. 7)
9 Although, as stated earlier, there is significant benefits to investing in a good transfer chute design and this often does not occur for contractual / financial reasons, a macro-economic benefit can be seen for this situation. Process plants generally take time to reach name plate capacity and a poorly designed transfer chute may perform adequately at 50% -70% of name plate capacity. Here sound economic management is used to allow plant production to reach a point where a chute’s poor design becomes an issue, during which considerable income will have been made with minimal adverse impact to the plant overall. At this point the plant operator may choose to invest in a new design to upgrade the existing chute and optimise the plant operation.
An existing chute upgrade will be primarily focused on chute performance. Here scale and computer modelling, in combination with data collected from the existing chute, can be used to great effect to improve an existing design. Additionally a significant cost benefit can be achieved if the improved chute design reduces plant bottlenecking or the downtime required to repair damaged equipment.
2.2 Literature review
A literature review was undertaken to further develop the idea towards a research project. The purpose of the review was to gather relevant information about:
− Review of Currently Design Methodology − Issues from Poor Design
− What is Discrete Element Modelling − Limitations of Discrete Element Modelling − Calibrating Material Properties for Simulation − BFA (Bulk Flow Analyst) Automatic Calibration
2.2.1
Review of Current Design Methodology
10 considered. Finally installation support and maintenance considerations are included to complete a preliminary design.
A more detailed design will include some trajectory calculations based on projectile motion equations will give a rough estimate of material path through the transfer. Determining the trajectory allows the designer to implement some of the flow control methods such as; strategically positioned chute walls, rock boxes, bash plates and hood & spoon set ups. All of which have varying degrees of success at controlling the material flow according to the material properties.
This method is only successful when it is followed by a trial and error examination, either through physical modelling or onsite adjustments. Much research has gone into the accurate calculation of trajectory, particularly required when dealing with rock box based designs as well as hood and spoon type chutes. Here the accuracy of the materials trajectory path is needed to ensure it hits the right spot with the correct velocity vector.
Colin Benjamin (2015) wrote an excellent review on the main methods of current trajectory path calculations in chapter 3 of his book The Transfer Design Manual. He investigated the work by the following individuals and organisations:
− Method of Korzen − Method of Booth − Method of Golka − Method of Dunlop − Method of Goodyear
− Method of MHEA (Materials Handling Engineers Association) early and updated versions. − Method of CEMA (Conveyor Equipment Manufacturers Association)
11 The simplest method of controlling material flow through the transfer chute is by allowing the material to slide down the internal surfaces of the chute. Use of strategically placed angled walls can control the direction and velocity of the material through the chute. Industry practice is to set the minimum internal wall angles at 70° to horizontal which is substantially greater than angle of repose plus 5º. Additionally the shallowest angle is the internal valley angle between two surfaces (Andrew L. Mular et al. 2002) (Figure 2-1). As stated earlier chute wall angles will drive the height requirement between the discharging and receiving equipment.
Figure 2-1 Valley Angle Source: www.bulksolidsflow.com.au
12 A slightly more complicated method of material flow control is by using impact plates such as the one shown in Figure 2-2. This is a crude method of controlling the direction of the material through the chute and is typically made of out of a plate lined with a harder steel tiles for wear protection Davis (n.d.). The main benefit of the impact plate is that it is adjustable allowing fine tuning of the materials trajectory during commissioning to ensure it lands centrally onto the receiving belt.
Figure 2-2 Impact plate
Source: David, S., ‘Transfer Chute Design Fundamentals’
13
Figure 2-3 Rock Box
Source: David, S., ‘Transfer Chute Design Fundamentals’
There are, however, some associated issues with rock boxes that need to be carefully considered before employing them in a design (Benjamin et al. 2015):
− As their design inherently slows the material, a capacity restriction can develop in the chute.
− Additionally the reduction of the velocity normal to the conveyor direction is often associated in little or no outlet velocity in the belt direction. This will increase belt wear. − The continual impact of ore on ore will increase the degradation of the material as well as
dust and noise.
− They are prone to blocking when dealing with cohesive materials.
14
Figure 2-4 Surge charge angle of belt conveyor Source: unknown
As the can be seen the majority of the material concentrated in the middle or flat section of the belt. P. C. Arnold (1980) describes a chute outlet design that facilitates the formation of desired profile shown in Figure 2-5.
Figure 2-5 Preferred Arrangement of Load-out Chute Source: Arnold, P.C. ‘Bulk Solids: Storage, Flow and Handling’
15 There are many benefits to this type of chute design, including:
− Ability to handle cohesive and wet materials. − Reduced dust generation.
− High capacity flow. − Ease of maintenance. − Use of rotatable spares.
Hood and spoon chutes are difficult and expensive design correctly as the angle of incidence on the hood, or angle of between free flowing material trajectory and the initial impact plate, is critical to the success of the design and must be as low as possible (Hastie & Wypych 2010). Additionally they are not overly well suited to highly abrasive materials. This can somewhat be alleviated through the use of high wear resistant liners with low coefficients of friction such as ceramics. Costing well over a $1000 per 300mm x 300mm tile, ceramic lining becomes an expensive perpetual maintenance cost.
2.2.2
Common Issues with Transfer Chutes
The design techniques identified in Section 2.2.1 are used to mitigate at variety of common issues found in transfer chutes. These issues include structural wear, spillage, belt wear, fire, capacity constraint and dust. Unfortunately the solution to one issue might cause the development of another. This section will investigate some of these issues and the design techniques available to resolve them.
16 highly effective and cheaper alternative to wear resistant liners for dry materials as it both absorbs the impact energy and slows the material flow through the chute.
Flow restrictions often occur due to insufficient incline of the chute surfaces and areas of stagnant flow and this is particularly prevalent in cohesive materials. As the material is slowed through friction along the chute sliding surface it will allow material to build up until it connects with the opposite side known as bridging. Figure 2-6 shows the DEM model of a coal transfer chute. As can be seen on the left hand image, material is slowing and building on the inclined surfaces, effectively blocking the chute (Khambekar et al. 2015). The right hand image shows how increasing the chute surface slope a significant reduction in build-up can be achieved. This effect can also occur with the use of rock boxes or deflector plates where incorrect placement can slow the material too much leading the material bridging. This issue is commonly known as choking and can be prevented with careful design.
Figure 2-6a Poor design Figure 2-6b Improved design
Figure 2-6 DEM simulation showing flow issues and improvement Source: Khambekar et al, ‘Chutes and Suitability’
One of the fundamental requirements of the chute is that material must be loaded centrally on the belt (Benjamin et al. 2015; Davis n.d.). The use of inclined idlers on each side of the belt creates a
Chocking points
17 trough and a non-centrally loaded material typically sits high up on of the side idlers as shown in Figure 2-7a. The material will re-centralise itself on the idlers through gravity and will drag the belt across the idlers as seen in Figure 2-7b. In addition to the excessive spillage, the edge of the belt will be prone to damage from rubbing against structures as seen in Figure 2-8 (CEMA 1997).
Figure 2-6a Belt loaded off centre Figure 2-7b Material COG falling into trough
of idler and associated spillage off edge of belt
Figure 2-7 Belt misalignment due to off centre loading Source: www.shippbelting.com
Figure 2-8 Belt edge damage from misalignment Source: www.esseng.com.au
In addition to wear damage to the conveyor belt seen in in Figure 2-8, there is significant risk of fire as belts are manufactured from rubber. Fire can be initiated from the heat generated by friction between the conveyor belt and any stationary object such as the structure, a seized idler, perhaps build-up of spillage or carry back.
18 Another cause of spillage is through incorrect material profile development. If the material is not loaded with a suitable material profile as noted in Figure 2-4 and the belt is loaded to maximum capacity, then spillage is likely to occur at either the loading chute skirt outlet or at the next transfer - typically at the head end.
Poor flow control at the chute discharge will significantly increase the abrasive wear on the receiving conveyor belt. When material impacts the belt it causes abrasion, this abrasion is proportional to the impact pressure and the difference in velocity between the particle and the belt. If the material is not presented to the receiving belt correctly then an inclined angle of incidence will occur as seen in Figure 2-9. The resulting material inertia increases the friction between the material and belt causing belt wear. In severe cases the material may boil or roll on the belt becoming stationary reducing the flowrate out of the chute. As more material enters the chute, the mass builds up, proportionally increasing belt wear. By matching velocities significant improvements in belt life can be achieved.
Figure 2-9 Relative Velocities of Lump to Belt
Source: Arnold, P.C. ‘Bulk Solids: Storage, Flow and Handling’
19 There are several products available in the market for controlling dust that attempt to seal the chute station and use extraction fans to create a negative pressure inside. These methods are expensive and requires additional infrastructure removing the dust from the extracted air. Additionally there is complex software for predicting dust generation using a combination of CFD and DEM software such as the open source software LIGGGHTS (Derakhshani et al. 2013).
However the simplest method is to use material flow control to prevent separation of the material as it falls through the chute. As the material flows off the conveyor, gradient of particles velocities develops based on the distance from the pulley centreline. The variation in particle speeds creates separation in the flow of the material and this separation draws and traps air in the material flow until it impacts on the belt. On impact the air is expelled from the material carrying the smaller lighter particles with it in the form of dust. By controlling the flow so that the stream remains as compact as possible, with minimal separation of the particles, dust generation can be significantly reduced.
2.2.3
Identifying Material Properties
Prediction of materials flow behaviour can be developed by identification of the various properties of that material. As such identifying these properties is an important part in determining a successful chute design. There are many methods for testing the various properties of bulk materials. Swinderman et al. (2009, pp. 399-402) lists 4 main properties that can be quickly identified;
− Bulk Density, − Angle of Repose, − Surcharge Angle and − Material Size.
20 Bulk density differs from particle density as it includes the air gaps between particles and can be further broken down by two measurements:
− Loose Bulk Density for design of areas where the material will be controlled in free flowing areas.
− Consolidated bulk density for design areas where the material becomes compacted through vibration or other means.
Typically we are concerned with loose bulk density when dealing with material flows.
The angle of repose is the natural angle a pile bulk material makes to the horizontal, refer Figure 2-10. While the surcharge angle is measured after a period of settling through vibration has occurred and used in determining cross sectional shape the material forms on a conveyor as seen in Figure 2-4.
Figure 2-10 Angle of repose
Source: Swinderman et al, ‘The Practical Resource for Cleaner, Safer, More Productive Dust and Material Control’
The material size is usually described as the width and height of the largest lump. For finer materials, particle size is determined by screening.
21
Figure 2-11 - Shear Cell Source: (Swinderman et al. 2009)
Figure 2-12 - Mohr's Circle Source: (Swinderman et al. 2009)
As seen in Figure 2-12 a Mohr’s Circle is developed and by increasing the consolidating pressure and recording the associated shear stress the internal friction coefficient can be determined, as seen in Figure 2-13.
22 Similarly the interface friction (wall friction) is determined in a similar testing method, with the main difference being it is measuring the materials resistance to sliding over a surface rather than through internal shear as can be seen in Figure 2-14. Of note is the coefficient of friction (μ) is equal to the tangent of the interface friction angle (θ), and there is an inverse relationship between the consolidated pressure (V) and interface friction angle.
Figure 2-14 - Interface Friction Source: (Swinderman et al. 2009)
Finally adhesion and cohesion are determined from the shear cell tests. Adhesion (σ) is the materials ability to resist movement at zero normal stress. Cohesion (τ) is the materials ability to resist shear at zero normal stress as seen in Figure 2-13. Cohesion and Adhesion are related to the interface friction angle, shear stress and consolidated pressure by the formula:
tan𝜃𝜃=𝑉𝑉𝑆𝑆 =𝜎𝜎𝜏𝜏=𝜇𝜇
(2)
23 Moisture content is the total amount of water in a bulk solid and is related to the cohesiveness and adhesiveness of a material. The moisture is measured as a percentage of the total wet weight of material. This is typically determined by drying the test sample to determine its dry weight as a comparison. It can be split into two types;
− Surface water – which is water that is free on surface, between particles and in open pores. − Inherent water – which is water contained in closed pores, not including chemically bound
water within particles.
2.2.4
What is Discrete Element Modelling
Discrete Element Modelling or DEM has been available for several decades and is a method used look at the interactions of a finite number of moving particles. This is achieved by modelling the associated contact and non-contact forces of particles (Grima et al. 2011). Grima further notes in his article that DEM can generate detailed particle flow trajectories and forces acting on individual particles as well as surfaces. This data can help gain valuable insight into the behaviour of bulk material flow through transfer stations as noted by Laurance Nordell (1997). Both papers highlight the significant benefits of utilising DEM to accurately model granular flow over other methods, not only as an improved chute design technique but also as cheaper method of verification of the design as compared with physical scale modelling.
It should however be noted that Grima’s paper was sponsored by DEM Solutions Ltd, owner of proprietary software EDEM, and Nordell is the CEO of Conveyor Dynamics who specialise using Rocky DEM software to model bulk material transfer stations. Nordell’s comments on Colin Benjamin’s work The Transfer Chute Design in the Bulk-Online forum (Wöhlbier 2010) belay his preference to DEM software based solutions over traditional material trajectory and physical scale modelling based solutions.
24 method was based only on particles represented by two dimension disks in a plane. With the advent of improved computation power of the latest processors, this method has now been applied to not only three dimensional particles but also simulate particle material type and shape as with the EDEM software (DEM Solutions Limited 2016).
There are many papers and articles that outline how Newton’s laws of motion form the foundation of DEM work, much of this literature is not surprisingly associated with proprietary software. As such the following explanation on the fundamental mathematics behind DEM modelling will utilise the extensive data base of articles provided by Janike & Johanson.
Bharadwaj (2012) describes the mathematics behind DEM software in his article. He notes that DEM is a mesh-free method that models individual particle forces. The boundaries of motion and geometry of surfaces is initially assigned by the user along with the particles to be analysed including starting position and initial velocities. Each particle is assigned a grid coordinate with the total forces acting each particle calculated, for each iteration of time, as the simulation progresses.
Both Bharadwaj and Grima note the particle calculations are based on the sum of mechanical contact and body forces:
𝐹𝐹=𝐹𝐹𝑐𝑐𝑐𝑐𝑐𝑐𝑐𝑐𝑐𝑐𝑐𝑐𝑐𝑐+𝐹𝐹𝑏𝑏𝑐𝑐𝑏𝑏𝑏𝑏 =𝑚𝑚𝑚𝑚 (1)
Body forces are primarily gravity, however Bharadwaj notes cohesion, fluid drag and Van der Waals interactions can be included as body forces.
25
Figure 2-15 Particle overlap Source: (Favier et al. 2009)
By using δ as the amount of overlap, its derivative δ’ as impact velocity and combining in a damped harmonic motion model, natural phenomena such as material stickiness and Young’s modulus can be represented. Figure 2-16 shows how the model can be set using the following formula;
𝐹𝐹𝑐𝑐𝑐𝑐𝑐𝑐𝑐𝑐𝑐𝑐𝑐𝑐𝑐𝑐=−𝐾𝐾𝐾𝐾 − 𝐷𝐷𝐾𝐾′
Where K is a function of the material size and stiffness developed from the material properties such as Young’s modulus and D represent the coefficient of restitution or representing the material stickiness. This model also includes the friction coefficient μ representing surface roughness.
26
2.2.5
Limitations of Discrete Element Modelling
Bharadwaj (2012) notes that there are still some considerable challenges in the use of DEM software and nominates the limitation in computational capacity as the primary challenge. As the method is designed to track every individual particles position, forces and velocity for each time step, increasing the number of particles increases the length of time taken for the computer to run the simulation. Additional complexities in the calculations also increase computational time. For example if the material has a high coefficient of restitution and or friction. Finally the particle shape can also significantly increase computation time compared to simple spheres, essentially the more realistic the model becomes the more computation time is required to run the simulation.
Bharadwaj also notes that model validation is another major challenge in the use of DEM software. Slight variations in composition of the material such as moisture and clay content affect the level of adhesive stress in materials (Swinderman et al. 2009, p. 406). If the model is not calibrated effectively to the material properties then there is a very high risk the model will not reflect actual material flow (Grima et al. 2011).
2.3 Bulk Flow Analyst
27
2.3.1
Automatic Calibration
An outline for setting up a material characteristic testing laboratory developed by Applied DEM is provided in Appendix A. By testing the material, a set of key parameters can be determined and inputted into the material calibration program. This program automatically calibrates the simulated material properties by using a grid method to choose the best results. Initially it runs four simulations based on random selection of four sets of key parameters with the selection range based on a grid. It then compares the results against the physically tested parameters and selects the closest match. The entire process is then run again but on a smaller selection range or grid of random parameters based on the difference between physical parameters and the chosen best fit parameters. This process is repeated until a desired level of error is achieved.
After some research and basic calculations of the feasibility of producing a simple yet basic laboratory, the author found that it would exceed the allocated budget and will substantially detract from the desired direction and intent of this report. Therefore material properties such as particle-particle friction and cohesion will be determined by trial and error while an industry average value of 1900 kg/m3 and 2850 kg/m3 will be used for the loose bulk density and particle density respectively.
2.3.2
Material size
Material size in conjunction with the density are important characteristics to be identified when trying to simulate flow through a transfer chute. Obviously an overly large particle will not accurately represent blockages in tight locations while smaller particles increase computational time. Material size is then a compromise between actual particle size, particle numbers and computational time. Minor changes in particle size can have significant impact in the calculation time required to run the simulation.
The comparative number of particles is inversely proportional to the radius ratio cubed as seen in the following equation.
𝑁𝑁𝑆𝑆 ≈ 𝑁𝑁𝐿𝐿(𝑟𝑟𝑟𝑟𝑆𝑆𝐿𝐿)3
28 An estimate in potential increase or decrease in calculation time can be determined by ratio of radius to the fourth power as seen in the following equation.
𝜑𝜑 ≈ (𝑁𝑁𝑃𝑃
𝑁𝑁𝐼𝐼)
3
Where 𝜑𝜑 is the percentage change in calculation time, 𝑁𝑁𝐼𝐼 is the number of particles run in initial simulation required, 𝑁𝑁𝑃𝑃 is the number of proposed particles to be used in new simulation.
Adding variation in material size will prevent unrealistic behaviour in corners. This is due to a phenomenon where similar sized particles are more likely to stack up on themselves as they share similar centres of gravity. As such varying the size of particles induce instability in long stacks of particles. A variation in particle radius of 10% was advised as being sufficient compromise between inducing this instability and not significantly increasing simulation time.
2.3.3
Friction and Cohesion
The particles are spherical in shape to reduce calculation time, however real life particles are not uniformly round. This can be resolved by adjusting a combination of inter-particle friction and cohesion of the particle to particle contact. There set values available for initial simulations to provide a rough estimate for initial setups of material characteristics, such as the 5 options for Cohesive Condition; Dry , Slightly Sticky, Sticky and Very Sticky.
2.3.4
Surface entities
Surface entities are chosen from for specific reasons For instance, the outgoing conveyor will have a reduced coefficient of friction to highlight issues of poor chute design that could be hidden by the belt dragging the out the material rather than the chute shape controlling the flow in the correct direction. Additionally we are not concerned with issues with the feeder prior to entering the chute, so a high friction factor is required to ensure all material is transferred into the chute.
2.3.5
Time Step
29 Time steps have a significant impact on the outcome of the simulation. Too small a time step increases the number of calculations required and hence the amount of time it takes to run the simulation. Too great a time step and there is a potential for the overlap distance during particle collision (𝐾𝐾 distance in Figure 2-15) will be large enough that the resulting calculated rebound velocity is so high that the particles will behave in an explosive manner at the next time step.
30
Chapter 3
Simulation of the Chute Design
This chapter will outline the methodology and techniques that will be utilised in firstly setting up the simulations, calibrating the model to recorded chute operation and analysing the results. It will also outline the findings of the three site visits conducted, detailing the issues found and measurements taken that will be used in the subsequent DEM analysis.
3.1 Introduction
The project is to be broken up into 4 phases:
Phase 1: Recording of chute
− Identification of potential chute, gathering the necessary resources and equipment to allow recording of existing material flow.
Phase 2: Modelling of chute
− Modelling the existing chute.
− Setting up and the calibrating the flow through the existing chute using DEM software − Confirming the results of the calibrated flow against the recorded existing flow.
Phase 3: Analysis of data
− Analyse chute flow issues and determine appropriate solutions
− Design of modified chute to improve the material loading on outgoing belt. − Re-run DEM model on improved chute design.
Phase 4: Presentation
31
3.2 Phase 1: Recording of transfer chute operation
The purpose of recording the transfer chute during operation is to initially create a base line or reference of the defects associated with the chute. This reference is then used to help develop solutions to the identified issues. The recordings final use after the completion of the project to compare against the improved transfer chutes operation, primarily as visual evidence of the resolved defects for the client. For this project I propose to also use this base line recording to calibrate a DEM simulation of the original transfer chutes operation and determine material flow of the feeders.
Additionally an approximation of the material flow rates will be calculated from a method of visually tracking a particle in the overall material flow. This will be done at 3 locations; mid-point of feeder bed, discharge from feeder and outlet of receiving conveyor. As the conveyor speed is known, the conveyor speed calculated from particle tracking will prove if the method is successful and provide an expected margin of error for speeds calculated for midpoint of the feeder bed and discharge point.
Additionally as there are various recording options available in the camera regarding frame per second rate and definition, the recordings for particle speed calculation will be done via the following settings.
− 4k resolution (3840x2160 pixels) @ 15fps. − 1080p resolution (1920x1080) @ 60fps. − WVGA resolution (848x480) @ 240fps.
− 2 sets of 12MPa stills taken at a burst rate 15 shots per second.
32
3.2.1
Equipment
The recording equipment we used needed to be capable of operating in a harsh environment and have the capability of relatively high definition images as well as high frame per second (fps) rate of recording. Additionally the recording device needs to be place in restricted access areas, so a requirement of being small, lightweight with readily accessible mounting accessories is desirable. As such a Go Pro Hero 4 Silver edition action camera was selected for the following reasons:
− Variable resolution and frame rates from 848x480 pixels @ 240fps to 3840x2160 pixels @ 15fps recording.
− 12 mega pixel still image.
− Simultaneous recording of video and still image.
− Availability of a large assortment of mounting components. − Protective case for operating in harsh conditions.
− Light weight at 152g with protective case.
Finally the risk vs cost of the camera was the right balance. The next model up doubled the fps for high resolution recording, however was a 50% increase in cost, the significant increase in price made the risk of loss or damage too great to carry.
For access to restricted areas of the chute an extension pole was constructed with an attached lighting rig from an adjustable mop handle.
3.2.2
Method
The site visits will be split over three separate visits. The first for feasibility of access, investigation of issues associated with the transfer chute as well as identifying areas to place calibration markings for determining particle velocities. The second visit is to measure and draw calibration markings to determine particle movement and material bed depth. The third visit is to record particle movements relative to calibration markings on chute as well as any other recordings missed on first visit. Each visit will require a Pre-site and Post-work to ensure each visits success.
Pre-site
33 1. Obtain relevant permits and inductions to enter port operational facility.
2. Complete JHA for site inspection. 3. Check operability of equipment.
Post-Site
On return from site the recorded videos and stills will be catalogued. An estimate of the material flowrate will be calculated by tracking a particle across a number of frames in the recording.
1. Clean and return equipment.
2. Download data from SD card and catalogue.
Site Visit 1
Site visit will involve obtaining recordings of various positions on the transfer station. Each recording shall be of a minimum of 15 seconds in duration and the distance and position of the camera will be noted relative to a designated reference point.
1. Position camera such that it has view normal to the flow of material on the receiving conveyor, then record material flow on conveyor.
2. Position camera such that it has view normal to the flow of material on feeder bed, then record material flow on feeder bed.
3. Position camera such that it is normal to feeder discharge then record material discharge from feeder outlet.
4. Position camera such that it has a view of material entering chute looking from tail end of receiving conveyor. Record material entering the transfer chute.
5. Position camera such that it has a view of material discharging chute looking from tail end of receiving conveyor. Record material discharging from transfer chute.
6. Position camera such that it has a view of material entering chute looking from head end of receiving conveyor. Record material entering transfer chute.
7. Position camera such that it has a view of material discharging chute looking from head end of receiving conveyor. Record material discharging from transfer chute.
34
Site Visit 2
1. Prior to visit, review recordings of previous visit and identify suitable areas for recording. 2. Draw 100 x 100 mm grid lines, on feeder side plate, parallel to material flow in a suitable
pattern to identify material bed depth. Individually number each line. 3. Measure dimensions A to S outlined in Appendix D.
Site Visit 3
1. Prior to visit, review recordings of previous visit and identify missing recordings. 2. Record feeder vibration amplitude.
3. Position camera such that it has view normal to the grid on feeder side plate and record material flow on feeder bed.
4. Obtain conveyor flow rate recordings from operator. 5. Record belt feeder velocity from beltweigher.
3.3 Development of transfer chute design
Here the intent is to produce a suitable model that can be imported into the BFA software for simulation. As the BFA software only uses surface geometries, only the inside geometries of the components need to be accurately modelled and any 3D CAD modelling software that can produce STEP files can be used to create the geometric surfaces. However if the design is successful, then the model will be used as the basis for the detailed design of the chute and as such consideration must be given for:
− Lifting requirements for construction and maintenance. − Stiffening and support of the chute.
− Manufacturability of the component.
− Maximum component size for constructability and maintenance if area is restricted.
35
3.3.1
Software Selection
BFA is capable of importing a STEP file which is a common file format for sharing 3D models between different CAD software, as such there was a choice of three software available for producing the required models; AutoCAD, Microstation and Solidworks. Each software is suitably capable of producing a suitable model with the only significant difference being that AutoCAD and Solidworks can be integrated with the BFA software. Additionally Solidworks is the only parametric based modelling software. Although AutoCAD and Microstation do have parametric capability, it is still based on a Boolean prismatic or “dumb” solid modelling. For this reason Solidworks was chosen as the modelling software.
Unlike Microstation and AutoCAD, Solidworks has two different file types for producing a complex computer model; the part file and the assembly file. Essentially an assembly file is made up of a number of components created in part files. The major benefit of this method is the potential to create easily modifiable parts that intelligently integrate with each other in the assembly file, however this can also be its major drawback. Careful planning must be taken when creating each part file to ensure that future modifications do not require a major redesign or a requirement of a new part to be commissioned.
3.4 Simulation of transfer chute using DEM
36 The BFA software allows this control by building the model from a series of components. Each component is associated with a unique set of characteristics specific to that type of component. The following sections will identify each component type and give a brief explanation on the variable characteristics.
3.4.1
Material Properties
Material properties identify the specific characteristics of the material to be simulated. A table, shown in Figure 3-1 is used to specify density, size friction and stickiness properties.
Figure 3-1 Material Properties User Interface
The implication of varying these details is discussed in section 2.3. However the Bulk Density and Packing Ratio have been arbitrarily set at 1900 kg/m3 and 1.5 respectively for all materials.
3.4.2
Surface Entities
There are three surface components will be created to represent the chute, conveyors and feeder associated with the transfer; Boundary, Boundary with Traction and Extruded Boundary with Traction. There are some common variables listed for each component type listed as follows
− On Time and Off Time
Controls when the component is added and removed from the simulation.
37 Controls the surface friction coefficient between particles and the component surface.
− Particle-Surface Adhesion
Controls the amount of coefficient of adhesion between the particle and the component surface. This is typically used for wet or highly cohesive materials and will be ignored for this inspection.
− Stress Precision Index and Tessellation Tolerance
This is used for particle to surface impact investigations and will largely be ignored for this project.
The use of the following surface entities are detailed below.
Boundary is the simplest of the entities and is used to represent the non-moving surfaces such as chute walls and conveyor skirts. The variable to be modified in this instance will be the Wall Friction. Boundary Surfaces in this model will include the:
− Conveyor Skirts − Feeder side plates − Hopper
− Skirt Insert
Initially the coefficient of friction for the walls will be set at 0.5 to highlight accentuate areas of potential blockages. On subsequent simulations the friction will be reduced 0.3. These values where chosen arbitrarily to help identify the influence of wall friction has on the resulting material simulations. A rough guide to friction coefficients provided by the BFA (Bulk Flow Analyst 2016) software is as follows:
− Friction-less walls to smooth surfaces: 0 to 0.3 − Most dry materials: 0.3 to 0.6
38
Figure 3-2 Boundary User Interface
The variable ‘Moving Boundary?’ seen in Figure 3-3 can be used to simulate the action of a vibratory feeder by inducing a surface vibration. Components created in this project using Boundary entities will be labelled with the prefix ‘Chute’, while those with a vibration element to them will be labelled with the prefix ‘Feedervib’.
This entity is similar to Boundary but has the added variable of a velocity vector used to simulate the surface motion parallel to the surface plan. Only the feeder components will be created using this entity and a coefficient of friction of 0.5 will be used for Wall Friction to reduce material flow issues prior to the discharge point of the feeder.
The surface velocity will be varied to maintain the mass balance flow rate between the material entering the feeder and discharging. An initial velocity will be determined using the following formula:
𝑄𝑄 𝐴𝐴 =𝑣𝑣
Where:
− 𝑄𝑄= the volume flow rate.
− 𝐴𝐴= is the cross sectional area of the feeder (Bed width x Bed depth) − 𝑣𝑣= is the resulting material velocity on the feeder.
39 𝑀𝑀̇
𝜌𝜌𝑏𝑏 =𝑄𝑄
The bulk density has been set in section 3.4.1 as 1900 kg/m3 and the mass flow rate is recorded from the site visits as outlined in section 0.
Figure 3-3 Boundary with Traction User Interface
Components created in this project using Boundary with Traction entities will be labelled in the following form:
Feeder_XX_SYY
Where XX identifies which feeder it is NS for near side and FS for Far side based on standard conveyor profile convention. YY is the velocity Multiplied by 10. For example the near side component shown in Figure 3-4 will be:
Feeder_NS_S27
40
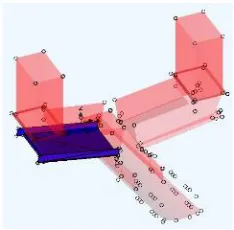
Figure 3-4 Extruded Boundary with Traction
Components created in this project using Extruded Boundary with Traction entities will be labelled in the following form:
RC01_FrXX_SYY
Where XX is the friction coefficient multiplied by 100 and YY is the velocity Multiplied by 10. For example the component shown in Figure 3-4 will be:
RC01_Fr32_S30
3.4.3
Injection box
Injection boxes control the generation of the bulk material particles to be used in the simulation. Typically they are of a square shaped box with four sides and an opening at the bottom to allow the generated particles to fall through. Similar to Surface Entities detailed in the previous section, their existence in the simulation is controlled by On/Off Time variables
41
Figure 3-5 Injection Box User Interface
Components created in this project using Injection Box entities will be labelled in the following form:
Inj_XX_YYYY
Where XX identifies which Injection box it is NS for near side and FS for Far side based on standard conveyor profile convention. YYYY is the mass flow rate. For example the far side component shown in Figure 3-4 will be:
Inj_FS_1300
3.4.4
Simulation set up
Once all the necessary components have been created a simulation can now be set up. This is achieved by setting the frequency of each iterative step and how often data is recorded during the simulation and then identifying all of the components that will be present in the simulation. There is no limit to the number of components that can be selected however each component can only be selected once. When an Injection box is selected a material must also be selected.
42
Figure 3-6 Simulation User Interface
Simulations created in this project will be labelled according to the following model set ups:
− FP_Original_XX
Simulation based on existing transfer design.
− FP_Original_Surge_XX
Simulations to replicate of surging.
− FP_Orig_Insert_XX
Simulations of insert only.
− FP_Orig_Ext_XX
Simulations of insert and feeder extension.
43
3.4.5
Simulation Procedure
The following procedure was developed to simulate material flow through the transfer station:
1. Identification of issues.
Not all issues can be replicated by the software, such as belt lift. 2. Initial Model Build.
Identify the minimum values for each component 3. Determine maximum velocity.
Section 2.3.5 details the method to set the time step and max velocity. 4. Determine minimum particle size.
Minimum particle size is set by the 250,000 limit for total number of particles in simulation balanced against simulation run time.
5. Test friction of belt.
Adjust belt friction so simulation matches real flow through impact zone. 6. Run model for mass balance.
Adjust feeder speed to ensure full flow from injection boxes is transferred to RC01. 7. Run first comparison simulation.
Run two simulations, first at larger particle size then at minimum particle size. 8. Review identified issues against simulation results.
Compare model against recorded chute operation on the identified issues noted in step 1. Review feasibility of identified issues to be simulated and adjust as necessary.
9. Adjust model parameters and Run comparison simulation.
Adjust model parameters as required to improve simulation comparison against actual transfer operation.
10. Repeat steps 7 to 9 until suitable simulation of material flow is developed.
44
3.5 Resource requirements
A resource analysis outlining equipment and software requirements for the project is provided in Table 3-1. CABS has agreed to provide in-kind access equipment, consumables and historical bulk material flow data. Phase 1 will require support from Fremantle Port Authority to provide the access to site for the chute inspection. Computer used for modelling and simulation work is supplied by the author and is not included in resource requirements.
Table 3-1 Resource Requirements
Item Amount Source Cost
Measuring Equipment One (1) CABS $10
Safety Equipment One (1) CABS $200
Digital Camera One (1) CABS $150
Digital Video
Recorder One (1) CABS $450
SD Card One (1) CABS $25
Camera support
brackets and light Assorted CABS $80
Solidworks Design
Package One (1) CABS $4,000
Bulk Flow Analyst
DEM software One (1) CABS $15,000
45
3.6 Site Investigation
Site visits were conducted for this project to identify the specific issues of the transfer station and record the data necessary to simulate the behaviour using DEM. The site visits were split into three individual visits with the methodology and requirements detailed in section 3.2 on page 31.
3.7 Site Visit 1
From the first site visit a number of issues were identified and a photo graphic record and