Household saving behaviour in developing
countries: the case of Vietnam
By
Tuan Quang Bui
A dissertation submitted for the degree of Doctor of Philosophy
of the Australian National University
Declaration
This thesis contains my own work except
where otherwise indicated.
Tuan Quang Bui
Acknowledgments
The completion of this research would not have been possible without the generous
assistance o f several parties and individuals.
I would like to thank my supervisors, Dr Neil Vousden and Professor Bob Gregory, for
invaluable advice and stimulating discussions throughout the duration of my research. My
great debt goes to my adviser, Dr Ross McLeod, for careful reading and helpful
suggestions to enrich the content of the dissertation. I also would like to thank Professor
Ron Duncan for very beneficial comments on the outline o f the dissertation and certain
chapters. I am indebted to Professor Luoc Dai Vo for his suggestions at the initial stages of
my study. My thanks also go to Dr Suiwah Leung for her support and for giving me the
opportunity to be involved in the AusAID-NCDS Vietnam Economic Research Project.
I am obliged to the staff o f the National Centre for Development Studies, the Economics
Program in the Research School of Social Sciences and the Faculty of Economics at the
Australian National University for their encouragement and support throughout my study.
My special thanks go to Dr Yuk Chu Liu for very supportive discussions and reading
certain chapters. I am grateful to Dr Chris Skeels for his advice and suggestions for the
econometric work. I am also thankful to Dr Bruce Chapman and Dr Deborah Cobb-Clark
for their willingness to discuss issues and to give comments. I own a great debt to Mrs
Billie Headon for her assistance both with English and other issues throughout the period
complete the dissertation. I also would like to thank Mr Harry Samios for his helpful
assistance in editing English o f the drafts of my thesis.
This research would not have been completed without the financial support of Winrock
International Organisation. Sincere thanks go to Mrs Rose Bautista and the staff of
Winrock International for their helpful and continuous assistance during the time of my
study. I am also grateful to all my friends and colleagues for their help in obtaining much
needed data and information as well as in discussions. My special thanks go to Huong Lan
Pham, The Dinh Phan and Dr Due Huy Ngo. Appreciation also goes to Hung Viet Dao,
Viet Tuan Dinh, Dr Huy Quoc Vu, Dr Thanh Tri Vo and Hong Xuan Nguyet Vu.
I would like to dedicate this dissertation to my parents, my wife and my daughter for their
Abstract
Understanding the driving forces behind household saving helps shed light on the problem
o f mobilising capital for domestic investment. This dissertation examines the determinants
o f saving, wealth and the structure of asset holdings of households in Vietnam.
The dissertation offers a simple model o f the Life Cycle Hypothesis and Becker-style
home production function for analysing saving behaviour of an extended household in a
developing country like Vietnam. Econometric models are used to test the hypotheses of
the theoretical model and to establish empirically the relationships between the saving
determinants and the levels of saving and wealth of households. The estimations of saving
models are conducted for different groups o f households. The structure o f asset holdings of
households is considered. A multinomial logit model is used to test some hypotheses
regarding the types of asset holdings of households.
The results suggest that a wide range of factors have an impact on saving and wealth of
households. It is found that the marginal propensity to save out of income o f households in
Vietnam is relatively high compared with the typical level o f developing countries. Groups
o f households in urban areas and in the south, that have a higher per capita income level,
are found to have a higher marginal propensity to save than those in rural areas and in the
north, respectively. Households in Vietnam hold assets most in gold and dollars, not in
banking and financial institutions. The asset and income levels of households as well as
different types o f assets. While raising the income level plays a crucial role in raising
household saving in both flow and stock terms, higher income seems not always to lead to
higher financial saving o f households in the banking and financial institutions. The
findings o f the dissertation have a number of implications for short and long-term saving
Table of contents
Page
Declaration ii
Acknowledgments iii
Abstract v
Table o f contents vii
List o f Tables xi
List o f Figures xiii
Acronyms xiv
Glossary xv
Chapter 1: Introduction
1
LI Introduction 1
1.2 Objectives and approach of the Dissertation 6
1.3 Structure o f the Dissertation 8
Chapter 2: Household economy, household saving and national saving
during the period of transition
10
2.1 The economy before and after the renovation at a glance 11
2.2.1 Development of the collective organisations 21
2.2.2 The private sector and the household economy 23
2.3 National saving and household saving 29
2.3.1 Government saving 29
2.3.2 Household saving 32
2.3.3 National domestic saving 39
2.4 Concluding remarks 43
Appendix 2.1 45
Chapter 3: Literature review of household saving
463.1 The literature on the theory of saving 46
3.2 Empirical studies on saving in developing countries 51
3.3 Concluding remarks 60
Chapter 4: Theoretical framework and the model
624.1 The model 63
4.2 Some results o f comparative static analysis 73
4.3 Conclusions 80
Chapter 5: Econometric model and estimations
825.2 Econometric specification and econometric models 84
5.2.1 The hypotheses 84
5.2.2 The econometric models 84
5.3 Estimation results and interpretation 92
5.4 Conclusions 99
Appendix 5.1 101
Appendix 5.2 102
Appendix 5.3 103
Appendix 5.4 105
Chapter 6: An analysis of household saving in geographic regions and
urban and rural areas
1066.1 Background issues 107
6.1.1 Land allocation and land reforms in northern and southern Vietnam 107
6.1.2 Some characteristics o f household activities in rural and urban areas 111
6.1.3 Issues for study on saving of different household groups 116
6.2 Household saving by rural and urban areas 117
6.3 Household saving by geographic regions 122
6.4 Conclusions 126
Appendix 6.1 128
Appendix 6.2 129
7.1 Introduction 130
7.2 Background issues 131
7.3 An econometric study on the level of wealth 134
7.4 The structure o f asset holdings of households 140
7.5 An econometric study on the structure of asset holdings 148
7.5.1 Multinomial logit model 149
7.5.2 Estimation results and interpretation 152
7.6 Conclusions 160
Appendix 7.1 162
Appendix 7.2 163
Appendix 7.3 164
Chapter 8: Conclusions and policy implications
1658.1 Summary of findings 165
8.2 Policy implications 169
8.2.1 The effect of short term policies 169
8.2.2 The effect of medium and long term policies 171
8.3 Research extension 173
List of tables
Page
Table 1.1 Saving and investment in developing countries (per cent of GDP) 2
Table 1.2 Gross domestic saving and investment in the Asian-Pacific region 3
Table 2.1 Annual growth rates of the five-year plan 1975-80 (per cent) 13
Table 2.2 Annual GDP growth in the period 1988-96 (per cent) 19
Table 2.3 Number of cooperatives and private business units in the
manufacturing industry in Hanoi, 1988 - 91 22
Table 2.4 Shares of gross industrial product by economic sectors 23
Table 2.5 Share o f industrial production, by types of enterprise (per cent) 24
Table 2.6 Growth of foodstuff production in different periods 27
Table 2.7 National budget (per cent o f GDP) 30
Table 2.8 Money deposits in four state commercial banks (billion dong) 33
Table 2.9 Balance of bonds and credit notes in four state commercial banks 34
Table 2.10 Forms of household saving 35
Table 2.11 Aggregate saving and investment ratio (per cent o f GDP) 40
Table 5.1 Saving of extended households 94
Table 5.2 Saving o f the households without old people 95
Table 6.1 Types of activities of households in rural areas 112
Table 6.2 Ratios of rural to urban per capita GDP (per cent) 115
Table 6.3 Per capita income and saving of households in rural and urban areas 118
Table 6.4 Saving o f household in rural and urban areas 119
Table 6.5 Per capita income and saving of households in the north and in the
Table 6.6 Saving of households by geographic region 124
Table 7.1 Estimation results for household wealth 137
Table 7.2 Asset diversification level of households 141
Table 7.3 Maximum likelihood estimates of the preferred asset types of
households 154
List of figures
Page
Figure 2.1 Structure of financial system in Vietnam 37
Figure 2.2 Saving and investment ratios in Vietnam in period 1991-97 41
Figure 2.3 Gross domestic saving rates and investment rates in the Asian-Pacific
region (period 1981-90) 43
Figure 4.1 Structure of an extended household with three generations 64
Figure 7.1 Asset holdings of households in value 144
Figure 7.2 Asset holdings of households in urban and rural areas 144
Figure 7.3 Asset holdings of households in northern and southern regions 145
Figure 7.4 Asset holdings of three groups o f households: poor, middle and rich 146
Figure 7.5 Predicted probability o f households choosing different types o f asset
Acronyms
2 S L S T w o - s ta g e le a s t s q u a re s
A IH K e y n e s ia n A b s o lu te In c o m e H y p o th e s is
A S E A N A s s o c ia tio n o f S o u th E a st A s ia n N a tio n s
A u s A I D A u s tr a lia n A g e n c y fo r In te rn a tio n a l D e v e lo p m e n t
B ID V B a n k fo r I n v e s tm e n t a n d D e v e lo p m e n t o f V ie tn a m
C M E A C o m m itte e o f M u tu a l E c o n o m ic A s s is ta n c e
F D I F o re ig n d ire c t in v e s tm e n t
G D P G r o s s d o m e s tic p r o d u c t
G S O G e n e ra l S ta tis tic s O ff ic e o f V ie tn a m
IIA I n d e p e n d e n t fro m irre le v a n t a lte r n a tiv e s
IM F I n te r n a tio n a l M o n e ta r y F u n d
L C H L ife C y c le In c o m e H y p o th e s is
L D C s L e s s - d e v e lo p e d c o u n tr ie s
M N L M u ltin o m ia l lo g it m o d e l
m p s M a rg in a l p ro p e n s ity to sa v e
N IE s N e w ly in d u s tr ia lis in g e c o n o m ie s
N C D S N a tio n a l C e n tre fo r D e v e lo p m e n t S tu d ie s
O E C D O r g a n is a tio n fo r E c o n o m ic C o -o p e r a tio n a n d D e v e lo p m e n t
O L S O rd in a r y le a s t s q u a r e s
P IH P e r m a n e n t In c o m e H y p o th e s is
S O E S ta te -o w n e d e n te r p ris e
Glossary
For Tables
p.a Per year (annual)
Not available
Zero
Currency Equivalents
Currency Unit Vietnamese dong
US$ 1.00 = VD 11,018 (as of March 23, 1996)
Fiscal year
Chapter 1
Introduction
1.1 Introduction
The linkages between saving, investment and development of a country have long been
recognised. Domestic saving is generally assumed to be one o f the key sources of
investment. The well-known Feldstein and Horioka puzzle o f the saving-investment
relationship was discovered in the early 1980s. Feldstein and Horioka (1980) reasoned that,
in a world of perfectly mobile capital, domestic saving would seek out the highest return in
the world capital market independent of local investment demand, and thus it is expected
that the correlations between domestic saving and investment rates among developed
countries should be low. However their study revealed a surprising result: there was a high
and significant investment-saving correlation. That means changes in domestic saving
passed through almost completely into domestic investment suggesting imperfect
international capital mobility. If such a result remains true with new data and with longer
historical periods, this would imply that the nexus o f saving and investment in developing
countries, where the level of mobility of capital is lower, should be more important.
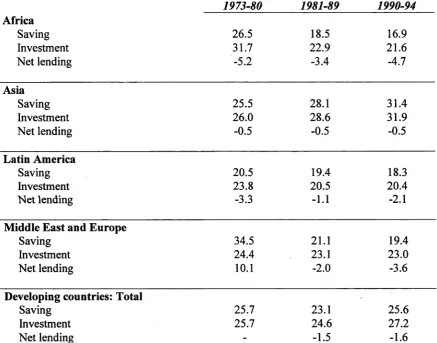
Table 1.1 confirms the close relationship between saving and investment in developing
countries in the last two decades. Their match is most obvious for countries in Asia and
Latin America. The developing world as a whole has relied on foreign saving at a very
investment of developing countries has been financed by the rich countries. Although the
Asian developing countries have constantly relied on foreign saving during the last two
decades, the amount of 0.5 per cent o f GDP o f net lending has been quite modest,
compared to the corresponding figure of 4-5 per cent for the countries in Africa.
Table 1.1 Saving and investment in developing countries (per cent of GDP)
1973-80 1981-89 1990-94
Africa
Saving 26.5 18.5 16.9
Investment 31.7 22.9 21.6
Net lending -5.2 -3.4 -4.7
Asia
Saving 25.5 28.1 31.4
Investment 26.0 28.6 31.9
Net lending -0.5 -0.5 -0.5
Latin America
Saving 20.5 19.4 18.3
Investment 23.8 20.5 20.4
Net lending -3.3 -1.1 -2.1
Middle East and Europe
Saving 34.5 21.1 19.4
Investment 24.4 23.1 23.0
Net lending 10.1 -2.0 -3.6
Developing countries: Total
Saving 25.7 23.1 25.6
Investment 25.7 24.6 27.2
Net lending - -1.5 -1.6
Source: International Monetary Fund (1995)
The economic successes o f the East Asian countries which have both high domestic saving
and high economic growth rates, provide good examples o f the linkages between saving,
[image:17.506.28.466.242.585.2]declined in most of the rest of the world since 1980, they remained relatively high in the
countries o f the Asia-Pacific region throughout the 1970s and 1980s. The East Asian newly
industrialising economies (NIEs) attain some of the highest saving rates in the world that
have been signified more by significant current account surpluses as a result of increasing
exports. The other developing countries o f ASEAN, such as Malaysia, Thailand,
Philippines and Indonesia having more moderate domestic saving rates, are still well above
20 per cent (Table 1.2). While external debt has partially lowered national saving rates in
Malaysia, Indonesia and Philippines, it is clear that domestic saving has played an
important role in attaining high investment rates.
Table 1.2 Gross domestic saving and investment in the Asian-Pacific Region.
P er cent o f G D P
S avin g average In vestm en t average
1971-80 1981-90 1971-80 1981-90
NIEs:
Hong Kong 28.4 30.7 27.8 27.9
Republic of Korea 22.3 31.9 28.6 30.5
Singapore 30.0 42.5 41.2 42.0
Taiwan 32.2 32.9 30.5 22.6
Southeast Asia:
Indonesia 21.6 32.0 19.3 30.4
Malaysia 29.1 33.0 24.9 30.8
Philippines 26.5 22.3 27.8 21.7
Thailand 22.2 24.4 25.3 26.7
People’s Republic of China 35.8 33.5 33.9 34.3
Compared to the industrial countries, the saving rate o f developing countries in East Asia
as a whole is very high. In aggregate, with a combined GDP o f about 6 to 7 per cent of
world GDP, developing East Asia including NIEs, ASEAN and China, saved an average 33
per cent of their national income in 1993, compared to 19 per cent in the industrial
countries (Ling and Peng 1996). The high saving rate is closely associated with rapid
economic growth. Developing countries in East Asia grew nearly three times as fast as
OECD countries over the last 15 years.
Vietnam found a good opportunity for rapid development, being located in the active
Southeast Asian economic region, thus enjoying the positive effects o f good economic
relations with the countries in the region. Having suffered setbacks in its development from
wars and economic crises in post war periods, Vietnam has aimed to achieve high
economic growth and implement industrialisation to follow the path of rapid development
o f the countries in the region. In order to achieve these goals, since 1986 Vietnam has
carried out a series of economic reforms, driving the economy to become more open and
market-oriented. The economic reforms also include the formation and implementation of
policies attracting foreign direct investment. However, to raise the needed investment and
capital, attracting foreign investment alone is not enough. Domestic saving is also crucial.
Because of the important role o f domestic saving in investment and economic growth, this
dissertation will focus on one component o f domestic saving: household saving.
The household sector plays a very important role in Vietnam’s economy. The other major
sector is the government. There are few private companies because of residual attitudes and
of this sector. The private sector consists mainly of family businesses. The household
sector and private companies are normally referred to as the non-government sector. The
contribution o f households and private companies (non-government sector) to GDP was
55.2 per cent in 1993, while the contribution of the government sector was only 39.2 per
cent, and the remaining 5.6 per cent was from the foreign sector. For the GDP created in
the agriculture, fishery and forestry industries, the contribution o f the non-government
sector was 97 per cent. In terms of capital accumulation, the non-government sector
contributed 53 per cent o f total national capital accumulation (Vu Quang Viet 1996: 5).
Since the renovation (Doi moi) was undertaken, households have been encouraged to
participate more actively in varied economic activities. As a result, the income and saving
o f households have increased markedly. The saving rate (ratio o f saving to GDP) o f rural
areas, where 95 per cent of GDP comes from the household sector and in which around 80
per cent of the population o f Vietnam live, increased from 5.2 per cent in 1990 to 10.6 per
cent in 1995. The saving rate of urban areas was 24 per cent in 1992 and increased to 27.6
per cent in 1994 (Nguyen et al. 1996).
Domestic saving needs to be increased for investment, industrialisation and economic
development. However, a sensible policy for boosting saving requires a clear
understanding o f its determinants and of the capacity o f the economy, especially
households, to save. So far, little knowledge regarding household saving has been attained
in Vietnam. In contrast to the rather extensive literature on household saving in industrial
and developing countries, there is not yet a quantitative analysis of household saving at the
micro-level for Vietnam. With more than 12 million households located mainly in rural
of households and the private sector in production, raising living conditions and the saving
of households. Thus, Vietnam can expect a significant contribution from the household
sector in terms of this mobilised saving. The important role of household saving for
domestic investment and industrialisation, and the present lack of knowledge about
household saving in Vietnam have provided the motivation for this dissertation.
1.2 Objectives and approach of the dissertation
The main objective o f the dissertation is to analyse the role of the factors which influence
the household saving and wealth levels in Vietnam and the structure of household asset
holding. The dissertation will focus on investigating the impact of household income and
the number o f dependent people in a household, and the impact of urban/rural areas and
geographical regions on saving and wealth of households. In analysing the relationship
between household saving and demographic factors, the dissertation will differentiate the
effect o f the number of young dependent people from the number o f aged dependent people
on household saving since their contributions to household income and their saving
behaviour may be different. To ascertain the distinct effect of these factors, the dissertation
will develop a simple theoretical model to provide a more rigorous rationale for the
analysis. The effects of household income, assets and demographic factors on household
saving will be examined for different types of households: young households and
households with old people. The dissertation will test hypotheses relating to the significant
Since there are different economic and natural conditions across different geographic
regions and between rural and urban areas, the dissertation will also try to analyse the
factors that have a significant impact on household saving in these different regions and
areas and compare these effects to each other. The dissertation will test the hypothesis that
household groups that have a higher/lower per capita income level will have a higher/lower
marginal propensity to save out o f income.
The dissertation will show that while households in Vietnam may have a strong motive to
save, they do not place this saving in the banks and financial institutions. Households in
Vietnam prefer to save more in other forms such as gold and dollars. Other findings
associated with studies on saving forms also will be presented to show that there are a
number of factors that could affect the forms in which households hold their wealth.
The dissertation will use a simple theoretical model of the saving behaviour of an extended
household, which is quite typical of an Asian developing country such as Vietnam, in order
to analyse the factors influencing household saving. Econometric techniques will be used
to test empirically the hypotheses drawn from the theoretical model and to quantify the
effects of the factors on household saving. The empirical results obtained will be compared
to the findings o f the related studies. The dissertation will also quantify the effects of the
factors on the level of wealth and probabilities o f holding different types of assets of
households.
The data for the empirical studies in this dissertation are taken from the Vietnam Living
Planning Committee o f Vietnam between 1992 and 1993. It is a survey at the household
and individual level with a sample of 4800 households located in all regions o f Vietnam.
1.3 Structure of the dissertation
The Dissertation consists of eight chapters and is organised into four main parts -
background (Chapters Two and Three), modelling (Chapter Four), empirical studies
(Chapters Five, Six and Seven) and conclusions and policy implications (Chapter Eight).
Chapter Two presents the historical background o f the renovation in Vietnam in the 1980s
and the most important changes associated with the economic reforms in the second half of
the 1980s and the early 1990s. The chapter will draw attention to the development of the
household economy, household saving and national saving during the period o f the
transition to a market-oriented economy. Chapter Three reviews the literature on the theory
of household saving and studies on household saving in developing countries.
Chapter Four presents a theoretical model for an extended household based on the Life
Cycle Hypothesis and Becker-style time allocation model for a household (Becker, 1965).
This chapter formulates the hypotheses for testing the role o f the factors influencing
household saving.
Chapter Five discusses the econometric models used to test the hypotheses and analyses the
results o f empirical studies. The chapter also compares our results with the findings of
the different geographic regions and urban and rural areas and conducts empirical studies
on household saving in these different regions and areas. Chapter Seven explores the effect
of the factors that influence the level of wealth of household asset holding and analyses the
effects o f the factors on probabilities of holding different types of assets o f households. The
chapter also provides results to assess the capacity o f household saving in contribution to
domestic investment in Vietnam.
Chapter Eight summarises the findings of the dissertation. The chapter also discusses the
relationship between policy and future saving outcomes and suggests further directions of
Chapter 2
Household economy, household saving and national saving
during the period of transition
Vietnam began economic reform in 1986. The reform (renovation or Doimoi) was the
result of two main factors, namely, the threat of an economic crisis in the early 1980s, and
the influence o f an economic reform movement originating in neighbouring China and the
former Soviet Union. O f these two factors, one o f an economic character and the other of a
political character, the economic one seems to be more crucial. During the period of
renovation, some significant steps toward the establishment of a free market have been
undertaken that have helped the economy overcome its difficulties. The country has
experienced some substantial structural changes and the economy has achieved some
impressive growth rates. Some other macroeconomic indicators have also improved.
Vietnam has become an exporter o f a number o f products which it previously had to
import. The living standard of the population has been raised significantly.
This chapter will highlight some of the important changes implemented under the
renovation, discuss the development of the household economy and the situation of saving
2.1 The economy before and after the renovation at a glance
Historically, the planned economy in the north o f Vietnam began in the 1950s following
the model of the Soviet-style planned economy. Although this model was adapted to fit the
conditions of Vietnam, its main features were ostensibly the same as other planned
economies. These features may be characterised as follows:
Firstly, the government controlled directly almost all important economic activities through
a system o f planned production and allocation o f economic resources and products. The
price system for products, exchange rates and interest rates were fixed with strict
regulations.
Secondly, with the goal of socialism that the economy should be led by the government and
cooperative sectors, the government implemented policies to subsidise these sectors by
providing capital investment and cheap credit. Means of production were owned by the
government and cooperatives and the government held a monopoly in trade. The private
sector was not encouraged to develop.
Thirdly, the market economy existed only at a very restricted level o f small business and
household economy. The products sold and purchased in the market were restricted to
goods and services of the household economy while the production means for economic
entities were not tradeable and were state-owned. The resources were allocated strictly
distribution system of consumption products were managed by the government to meet the
demands o f life of the labour force in the government and the cooperative sectors.
Fourthly, state-owned enterprises were entirely government financed. Therefore, the
government subsidised the enterprises that made losses in business while taking almost all
the profits o f the profitable ones. The government also subsidised the activities of the
enterprises by selling low-price materials and equipment that were financed by government
borrowing and various kinds of economic aid. As a result, economic growth, if there was
any, was accompanied by government deficits and huge government debts.
Although these policies had an advantage in helping the government to centralise resources
to deal with the war and post-war conditions in the sixties and seventies, they quickly
became inadequate as the country proceeded to a reconstruction phase in peace time. The
centralised and planned distribution system, the system of subsidising capital and credit,
the way of separating profit and loss of production entities from salary and payments of
workers, did not create the motivation for people to devote much effort to work. In such a
system, the creativity and dynamism o f workers was stifled.
Stagnation and worsening economic conditions became more obvious not long after the
reunification in 1975. Over-optimistic subjectivism prevailed among the politicians who
considered that management of the economy was not as difficult as fighting a war. The aid
flows from the former socialist countries, which had played a very important role in
government budgets, fell significantly in the period 1979-80. As a result, almost all o f the
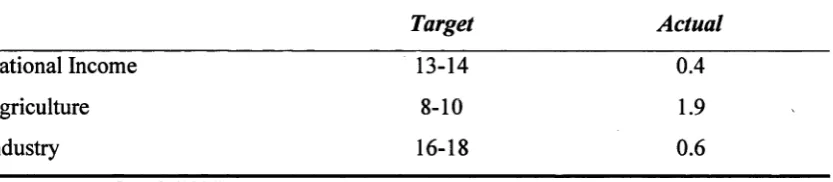
half of the plans could be met. Table 2.1 shows the contrasts between the planned and the
actual growth rates during the five-year plan 1975-1980. The actual growth rates were very
far below the high rates that were planned, especially for the industry sector. The target
growth rate was 16-18 per cent while the actual was only 0.6 per cent. These figures
highlight the predicament of Vietnam at that time.
Table 2.1 Annual growth rates of the five-year plan 1975-80 (per cent)
Target Actual
National Income 13-14 0.4
Agriculture 8-10 1.9
Industry 16-18 0.6
S o u r c e: L e D a n g D oan h (1 9 9 4 )
The apparent crisis in the economy brought pressure to change economic policies.
Although the goal of socialist transformation was retained, for the first time the concept of
efficiency of doing business and management was mentioned. This led to some market-
oriented changes in the industrial and the agricultural sectors, thus reducing the extent of
planning in the economy.
In manufacturing industries, some “off plan” economic activities of enterprises were
allowed to exist for the first time since collectivisation, implying a loosening of
administrative management from the central government. Those activities were possible
[image:28.506.44.461.296.387.2]subsidised price, were required in return to supply products to the government. Plan Two
allowed the enterprises to produce an excess amount to that specified in Plan One and to
use revenue to buy additional inputs. Plan Three allowed the enterprises to operate on a
free market basis. This system gave some freedom and flexibility for enterprises to operate
and at the same time was able to link the final products with profits and payments to their
workers. Enterprises were able to have a horizontal business relationship with other entities
instead of having only a vertical relationship as before. This change encouraged enterprises
to work more efficiently.
The agricultural sector also experienced some decentralisation. One step was the
introduction of the “contract system”. Before, when compulsory collectivisation was
implemented, peasants worked in organised production cooperatives and were paid
according to the amount o f work they contributed. That system was called the “work-
points” system: working days and jobs done by cooperative members were marked by
points and, at the end o f crop harvests, distribution of products was implemented in
accordance with the accumulated points. Under the slogan of collective ownership,
members o f cooperatives did not own any land and were just permitted to farm up to 5 per
cent of the total land o f the cooperatives for their own private purposes. Under this system,
there was no motive for cooperative members to contribute much. They put all their effort
into the five-per cent “private” land that often brought them a significant source of income.
The “products-based contract” system, often called “Contract 100”, which existed from
1981, still had large elements o f planning. According to “Contract 100”, among eight
-planting, tending and harvesting - and cooperatives were in charge of the remaining phases,
among which were allocation of land, supplying inputs and providing technical assistance.
Under the “contract system”, a certain quantity o f output - quota - was placed under
contract between household units and cooperatives. After supplying the quota to
cooperatives, households were allowed to keep or trade any output in excess o f their quota.
Along with the changes in industry and agriculture, in the domestic market, there appeared
a “two-price system” for trading goods: one was the “subsidised system” and the other was
the “free market”. The free market in factors o f production and industrial and agricultural
products flourished and expanded. To some extent, the monopoly role of the government in
trade was reduced in this period.
Although the changes which took place in various sectors were very important in terms of
beginning a new way of thinking and practice, it appeared that these changes were only half
way measures or “piecemeal economic reform” (Riedel and Comer 1996). The economy
still mainly ran under a system of administrative management and subsidisation.
Macroeconomic policies (such as price, tax and credit policies) were inadequate. Economic
efficiency had not been the primary objective, and as a result, after a short period o f a
modest increase o f output and growth, Vietnam began to experience another crisis. The
inflation rate rose to nearly 100 per cent in the period 1982-83 and became hyperinflation
of 500 per cent by 1986 (Le and McCarty 1995). The government faced high budget
deficits and balance of payment problems. The contradictions between the demand for
having more freedom to do business and the inadequate macroeconomic and institutional
The renovation policies started taking shape at the Sixth Congress of the Communist Party
o f Vietnam in 1986 and continued to be supplemented by subsequent conferences and a
macroeconomic stabilisation program implemented later in 1989-92. These policies have
helped to drive the economy in a positive direction and have yielded significant
achievements. The policy changes and the economic achievements in the period of
renovation can be classified as follows:
First, a move to a mixed economy, in which the government, cooperative and private
sectors coexisted with equal rights1 was adopted. In effect, discrimination against the
private sector, at least ideologically, was removed. The government sector was also put
into equal competition with other sectors.
Second, the existence and the role of markets was accepted. Under a new economic
viewpoint, accepting the role of the market in resource allocation appeared to be very
important in terms of ideology. There emerged the concept o f a “market economy with
socialist orientation” in this period.
Third, a restructuring of the economy took place to mobilise resources to pursue the major
goals: agricultural development, consumption goods expansion, export improvement and
foreign trade expansion. The state monopoly of foreign trade was eliminated and many
entities were allowed to undertake direct international trade. A legal framework was also
provided to assist the restructuring process with new laws such as the Law on Export and
Import Duties on Commercial Goods in 1987, the Foreign Investment Law in 1988. In the
financial and banking system, besides the State Bank, the system of commercial banks
replaced the monobank system in 19882. Macroeconomic policies have been introduced
using “shock therapy” to stabilise the economic and social environment such as
liberalisation of prices, reduction o f macroeconomic imbalance, raising interest rates,
devaluing and unifying the exchange rate, tightening money policy leading to a significant
decline in inflation and accelerating the transition process toward a market economy.
Fourth, further steps toward the abolition of central planning were taken in industry and
agriculture. The plan targets for state owned enterprises were reduced significantly. The
centralised control of output and prices was dismantled. Enterprises were given full rights
and responsibility for their own production, sale of products and financial decisions.
Restructuring, mergers and privatisation (sometimes called equitisation) have been largely
accepted by the state-owned enterprises.
Under renovation, there was a substantial change in terms o f ownership in agriculture:
household farms were allowed to lease land from the State for long periods. In fact, the
transfer of farm land management was a rather long process. After several years of
implementation, the “Contract 100” system was already seen to be flawed: there were
unstable contractual levels and the management mechanism o f cooperatives basically
remained centrally administered and had many irrational functions. As a result, economic
resources were still subject to constraints and not fully liberalised.
In April 1988 this system was replaced by the new system of contracts - the “Contract 10”
system- named after the resolution number of the party conference dealing with agricultural
issues. This was a first step towards inducing farmers to invest in land under their own
management. According to this new contract system, farmland was contracted for a long
and stable term to households and could be exchanged. The rental period o f land ranged
from 5 to 15 years. Factor inputs and cattle of the cooperatives were sold to farmers.
The Land Law in 1993 was a further step toward the liberalisation of land. According to
the Land Law, land and certificates for land use rights were given to households on long
term and permanent bases. This law allowed farmers to exchange, mortgage, inherit, lease
and transfer land on long-term leases o f up to 75 years. The new land system was
welcomed by households, especially the farm households. With this new system o f land,
farm households were recognised as fully independent economic units that operated their
own land and resources. The implementation o f the Land Law not only actively affected
production development but also helped to solve the problem of inefficient use of land in
the rural areas. The Land Law also meant the end o f the old style cooperatives. Thus,
exclusive land user rights were established giving farmers the incentive to make production
After the economic reform was instituted, the economy experienced significant changes
and prospered. Table 2.2 shows some achievements o f the whole economy and by sectors
in the period 1988-96.
Table 2.2: Annual GDP growth in the period 1988-96 (per cent)
1987 88 89 90 91 92 93 94 95 96
Real GDP 3.7 5.9 7.8 4.9 6.0 8.6 8.1 8.8 9.5 9.3
Industry and
Construction 8.8 5.3 -4.0 2.9 9.0 14.0 13.1 14.0 13.9 13.5
Agriculture
and Forestry -0.6 3.9 6.9 1.5 2.2 7.2 3.8 3.9 4.6 4.8
Service 5.5 9.2 17.6 10.4 8.3 7.0 10.2 10.9 10.9 8.9
Inflation rate 231.8 393.8 34.7 67.5 68.1 17.5 5.2 14.4 12.7 ••
Sources: General Statistical Office (1996) and World Bank (1997)
Except for the period 1987-89, when the struggling economy still suffered the
consequences of the pre-reform period, the trend o f real GDP growth in the period up to
1996 was very strong. The outputs of both industry and agriculture had each been
increasing at a high and stable rate. According to Tran Hoang Kim (1996), food production
rose from 21.5 million tonnes in 1989 to nearly 27.5 million ton in 1995 and transformed
Vietnam to a large rice exporter selling about 1.5 to 2 million tonnes yearly on world
markets. Inflation fell substantially from three figures to 10 per cent annually. These
o f the 1990s, Vietnam received no external economic aid from the former Soviet Union or
other former socialist countries.
This brief outline of the period 1980-1985 and the reforms in policies showed that the
achievements during the period 1986-1996 were very encouraging. These changes were
primarily the result of the process of decentralisation and decollectivisation, which has
given individuals more freedom to make economic decisions. As a consequence,
individuals are motivated to work harder and manage production more efficiently. The
achievements of the economy also showed that a more radical economic reform package
could be successful and provide the basis for a significant improvement in economic
performance.
2.2 The household economy and the private sector in the period of
transition
With a population of around 80 million people, 80 per cent o f whom live in the rural area,
and with about 73 per cent of the labour force engaged in the agro-forestry sector, Vietnam
is an agricultural economy. Rice farming is the primary activity of the majority o f the
population. Agriculture therefore is the main sector o f the economy. Because the
development of the household sector is very much related to the development of
cooperatives in agriculture, it is useful to assess the transformation of the cooperatives in
2.2.1 Development of the collective organisations
In the past, the process of collectivisation occurred earlier and more extensively in the
north and with much less success in the south of Vietnam. Up until the middle of the
1980s, there were about 17000 cooperatives in the north and only 1518 cooperatives and
9350 production groups in the south (Vu Tuan Anh 1994: 26). The difference between the
level of collectivisation in the north and south may have influenced the speed of the reverse
process - decollectivisation. As one would expect, the dismantling o f cooperatives in the
south was to happen more quickly than in the north. On the whole, the decollectivisation
process during the renovation has had a considerable influence on the life o f households in
both the north and the south of the country.
The cooperative system suffered from several inherent weaknesses. The most serious of
these was the absence of incentive for the individual to work hard under a common
ownership regime. In addition, in agriculture, the management o f the cooperatives was
often cumbersome and very poor, often resulting in inefficient use o f land. This poor
management and the system of valuing the contribution and work o f cooperative members
by points were found to be inappropriate and separated their interests from the final
products.
Under the new contract system, the role of cooperatives was reduced substantially,
allowing an increased role for households. Besides the dismantling of some cooperatives,
there was some transformation of others. In agriculture, for example, a new type of
other cooperatives became a type of shared company working on the basis of contributed
capital. Shared companies also began operating in the sectors of manufacturing industry
[image:37.506.38.453.258.418.2]and services.
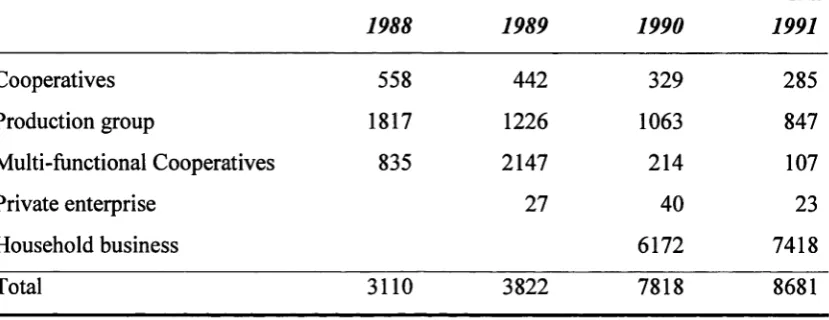
Table 2.3: Number of cooperatives and private business units in the
manufacturing industry in Hanoi, 1988 - 91.
1988 1989 1990 1991
Cooperatives 558 442 329 285
Production group 1817 1226 1063 847
Multi-functional Cooperatives 835 2147 214 107
Private enterprise 27 40 23
Household business 6172 7418
Total 3110 3822 7818 8681
Source: Hoang Kim Giao (1993: 31)
The general decline of the cooperatives sector has been widespread. To illustrate, the
number of cooperatives in industry alone fell by 70.7 per cent with the labour force reduced
by 72.3 per cent from 1981 to 1991. Similarly, during 1986-91 the share of value of the
cooperatives in the total value o f goods and services shrank from 14.6 per cent to 1.8 per
cent (Vu Tuan Anh 1994: 29). In some industrial locations, the number of cooperatives
declined in absolute terms despite obvious growth in the value of industrial products. Table
2.3 shows the process of development of cooperatives and private businesses (including
household businesses) in industry in Hanoi, one o f the industrial centres of the country.
operating in industry was increasing, the number of industrial and production cooperatives
[image:38.506.30.449.215.381.2]fell significantly.
Table 2.4: Shares of gross industrial product by economic sectors
Economic sectors 1986 1987 1988 1989 1990
State 56.3 56.0 56.5 57.0 59.8
Cooperatives and
Production Groups 28.1 27.1 23.9 15.8 13.7
Private and households 15.6 16.9 19.6 27.2 26.5
Total 100 100 100 100 100
Sources: Nguyen Quy Luyen (1993: 63).
Other cities such as Ho Chi Minh City and Haiphong also experienced the same trend with
the number o f cooperatives substantially reduced. Table 2.4 again shows the declining
trend of the industrial production share o f cooperatives and production groups (a form of
cooperative on a smaller scale) for the whole economy. This trend suggests a gloomy future
for such socialist-style common-ownership forms of production.
2.2.2 The private sector and the household economy
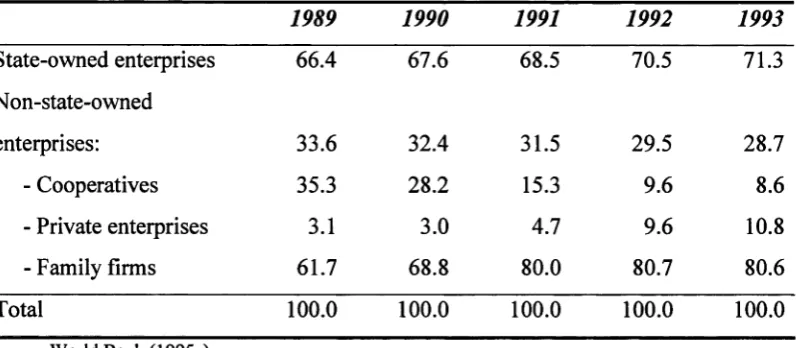
In contrast to the shrinking cooperatives, private and household business has seen a visible
and the household sector. In a period o f just five years from 1986 to 1990, the share of the
private and the household sector nearly doubled compared to a modest increase in the share
[image:39.506.39.438.242.416.2]of the state and a falling share o f the cooperatives and the production groups.
Table 2.5: Share of industrial production, by types of enterprise (per cent)
1989 1990 1991 1992 1993
State-owned enterprises 66.4 67.6 68.5 70.5 71.3
Non-state-owned
enterprises: 33.6 32.4 31.5 29.5 28.7
- Cooperatives 35.3 28.2 15.3 9.6 8.6
- Private enterprises 3.1 3.0 4.7 9.6 10.8
- Family firms 61.7 68.8 80.0 80.7 80.6
Total 100.0 100.0 100.0 100.0 100.0
Source: World Bank (1995a)
Since the reforms, the private sector has become more dynamic and has flourished,
especially in services and retail. The proportion o f revenue of the private sector to the total
revenue in services and retail substantially increased from 41.2 per cent in 1985 to 73.1 per
cent in 1991 (Vu Tuan Anh 1994: 31). As this sector emerged, businesses took various
forms, from shared holding companies, joint stock companies, limited liability companies,
sole proprietorships down to household businesses. Table 2.5 shows the shares of industrial
production, by type of production entity. While the share of state-owned enterprises has not
increased significantly, the share of the non-state-owned enterprises has fallen
not from any fall in the share of the private enterprises and the family firms, which actually
expanded by approximately 200 per cent and 25 per cent respectively.
By 1993, there were already 984212 private business entities in operation. These entities
were usually very small in terms o f capital. On average, a private business had 98 million
dong worth of investment and 526 million dong of capital compared to the corresponding
figures of 7021 and 8652 million dong for a government enterprise. On average, the total
assets of a government enterprise were 23.4 times of the total assets of a private business
(Vu Tuan Anh 1994: 30).
The policies encouraging an independent role for households have also positively affected
the production activities of the household sector, a component o f the private sector. The
number o f newly established household businesses increased significantly along with the
increasing number of private businesses. According to a survey conducted by the Ministry
of Labour, Invalids and Social Welfare in 1991, of 1008 business units in five provinces,
up to 80 per cent of them were private and household businesses and were newly
established after 1987 (Vu Tuan Anh 1994: 33). The share of the total value of goods and
services provided by the household sector in services increased from 41.4 per cent in 1986
to 66.9 per cent in 1990 (GSO 1996).
Besides the change of ownership of land use rights and factors of production, which tie the
interests o f households more closely to the final products of their land, there were other
reasons for the household sector to expand. These reasons rest in the characteristics of the
household.
Unlike other economic units, economic household units are established along family lines.
Thus all members o f a household business are likely to be closely involved in the family
business and to have a conscientious attitude towards the common work and family
welfare. The problem with labour discipline that used to be a primary concern o f the old-
style cooperatives is no longer present. Children and old people, especially in families
involved with agricultural production, are often found to be very useful in doing simple and
relatively undemanding jobs, for example, in cattle husbandry and vegetable planting.
Production skills and experience are learned and transferred from generation to generation
in these small business units. Not surprisingly, in the cooperative regime pre-1980,
productivity in the “five per cent land”, which households could use as they wished, was
often twice and sometime three times the productivity of the land in the cooperatives (Tran
Hoang Kim 1996).
Another reason for the proliferation of the household economy stems from the small size of
household units. A small size business usually does not require much startup capital and
can be very flexible. Despite their limited capability for applying new technology, often
leading to low productivity, small-scale units are capable of changing the type, the pattern
and the quantity o f products very quickly in accordance with the changes in demand and
price in the local market. They also can be highly flexible in making decisions regarding
finance, production and consumption. If their products are not sold in the market,
confine themselves to production for their own uses. This form o f business, therefore, is
very suitable even for groups of poor households in developing countries.
Traditional professions, such as traditional medicine, handicraft, pottery etc. have been
associated quite closely with family businesses and villages. For example, in a village of
this type in Thai Binh province, up to 700 of the total of 800 households of the village
follow traditional professions (weaving) and the remaining inhabitants are involved in
agricultural production (Hoang Kim Giao 1993: 44). These professions require quite
complicated skills and know-how which are taught and passed down from generation to
generation only in families. For such professions, cooperatives inhibited the transfer of
[image:42.506.31.459.460.651.2]“know-how” and skills from generation to generation.
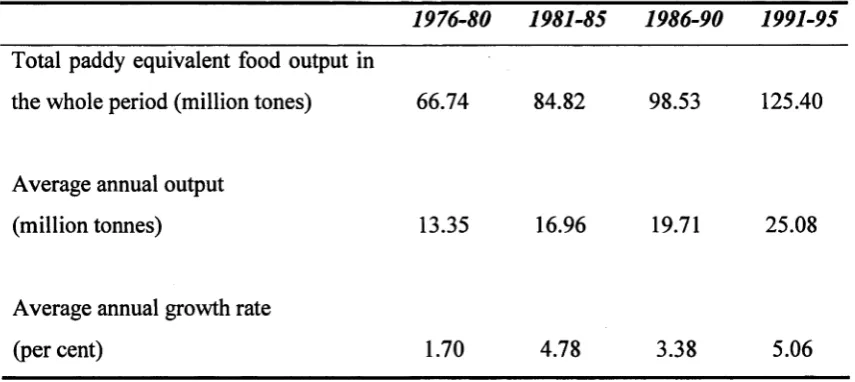
Table 2.6: Growth of foodstuff production in different periods
1976-80 1981-85 1986-90 1991-95 Total paddy equivalent food output in
the whole period (million tones) 66.74 84.82 98.53 125.40
Average annual output
(million tonnes) 13.35 16.96 19.71 25.08
Average annual growth rate
(per cent) 1.70 4.78 3.38 5.06
The above developments in the household sector contributed substantially to the increasing
production of rice and the rice exports of the country. From 1991 to 1995, the average
annual growth rate o f gross agricultural output value was 5.4 per cent which was high
relative to agricultural growth rates for previous years. Table 2.6 gives us a close look at
the achievements in the foodstuff industry. The increasing trend o f foodstuff production is
very clear and reaches the highest level in the period 1991-95. It is worth noting that during
the period 1991-95 Vietnam suffered a series o f unfavourable natural disasters including
floods and insect plagues that resulted in the loss o f 3 million tonnes o f paddy, averaging
750,000 tonnes per year. This proves that sustainable growth o f food production is
attributed to something other than favourable weather conditions. With the high growth of
rice production throughout the 1990s, Vietnam has already become the second largest
exporter o f rice in the world. Undoubtedly, the household sector has played an important
role in contributing to these figures.
The radical changes that began in 1986 have influenced the life o f households a great deal.
As households began to make their own economic decisions, their production increased
considerably. While there were only about one million households with an income level
above 5 million dong in 1991, the number of households with an income above 10 million
dong had increased to 3 million in 1995 and the number with income more than 15 million
dong had increased to 6 million in 1997 (Nhan Dan Newspaper 23 May, 1999). The
average income o f households in 1993 was 2.1 times that of 1991 and 3.3 times that of the
level of 1991 (Hoang Thi Thanh 1995); the monthly average income o f 1995 reached a
higher saving of households as well as o f the nation. The following section will look at the
changes in both national saving and household saving over the period 1986-95.
2.3 National saving and household saving
Domestic saving o f a country consists o f three components: government saving, corporate
saving and household saving. Due to lack of statistical data, this subsection will look only
at two saving components, government saving and household saving.
2.3.1 Government saving
The macroeconomic policies under the renovation package of the late 1980s achieved their
initial objectives: the economy was stabilised; the role of the government changed
gradually from centrally administered control to indirect regulations; managerial and
financial autonomy was introduced for the state-owned enterprises; and direct subsidies
were abolished. These changes led to a decreased burden on the government budget.
Financial measures restraining inflation and the government deficit, such as the policy of
money tightening, the introduction o f government bonds, and the enforcement o f the tax
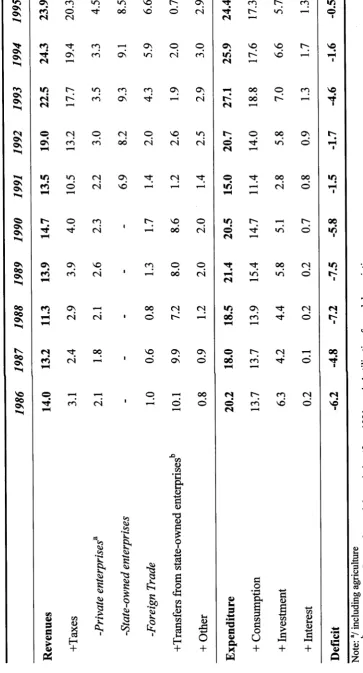
As a result, there was a significant reduction in the budget deficit. The improvement o f the
national budget during the period 1986 - 95 can be seen in Table 2.7. While the share of
the tax revenue from the state sector is the largest, it seems to fluctuate considerably. In
contrast, the share of tax revenue from the non-state sector increased steadily from 1.8 per
cent in 1987 to 4.5 per cent in 1995. Before 1991, the deficits were quite high, but after
1991, the deficit of the national budget (the residual after subtracting expenditure from
revenue) fell quite significantly to 0.5 per cent of GDP in 1995.
One of the driving forces behind the improvement is the growth of government saving
which is defined as the government revenue remaining after expenditure and interest rates
have been subtracted. The period after the renovation has seen a substantial change in the
financial situation o f the government.
Despite the big cut in aid flows from the former Soviet Union and the former socialist
countries at the end of the 1980s and the beginning o f the 1990s, government saving has
increased considerably. According to a report o f the Ministry o f Finance - “National
financial policies for the strategy of socio-economic development 1996-2000”, government
saving turned from being negative to positive. It was 1.094 billion dong or 1.4 per cent of
GDP in 1991, and it increased to 10.650 billion dong or around 5.1 per cent o f GDP in
1995. The year 1991 was considered as the turning point for government saving after a
long period of being negative. For the whole period 1991-95, the average saving o f the
In fact, government saving needs to increase further. Its potential relies upon a further
improvement of the tax system. In spite of some recent changes, the current tax system,
according to the Ministry of Planning and Investment, has suffered a loss of about 30 per
cent of total tax revenue (Ministry o f Planning and Investment 1996). The major reasons
include the inefficiency and weakness of the tax-collecting organisations and the
incompleteness of the tax system. A tax system reform could improve the flow of tax
revenue and, consequently, could improve the potential for government saving.
2.3.2 Household saving
Saving of households is often very difficult to assess due to lack of statistical data and
reliable surveys. However, to an extent, we could possibly gain some insight into
household saving by looking at the financial saving o f households in the financial
institutions or, in particular, saving deposits in the banking system. This is because
financial saving is one of the important sources of saving o f households. For example,
Table 2.8 shows the money deposits of enterprises and households in the four state
commercial banks4 during the first half of the 1990s.
The saving deposits of the private and the household sector have been growing quickly
from 2,799 billion dong in 1991 to 11,523 billion dong in 1996. While in 1991, the
deposits of households were much smaller than those of the state-owned enterprises, they
became much larger than those of state-owned entities in 1996. The share of private saving
[image:48.506.40.446.199.347.2]in total saving deposits also became the largest among all sectors in the period 1994-96.
Table 2.8: Money deposits in four state commercial banks
(billion dong)
1991 92 93 94 95 96°
State-owned entities 6,840 7,922 4,633 5,159 7,286 8,604
Private entities 73 132 - - -
-Households 2,799 3,838 3,930 5,546 8,867 11,523
Other 2,861 2,564 5,787 6,417 7,636 9,059
Total 12,573 14,456 14,350 17,123 23,789 29,186
Note: a/is expected value
Source: Ministry o f Planning and Investment (1996)
Apart from deposits in the banking system, households also save by buying government
bonds and credit notes. Table 2.9 shows the development of this kind of saving by entities
and the household sector in the financial balance o f four state commercial banks.
As can be seen in Table 2.9, the two major parties involved in buying government bonds
and credit notes have been state-owned enterprises (SOEs) and households. However, the
amount o f money the SOEs used for buying bonds and the like fell substantially from 68
per cent of the total in 1991 to 13.3 per cent in 1996. In contrast, the amount of money that
households used to buy bonds and credit notes increased sharply from 32 per cent in 1991
to around 86.7 per cent in 1996. In addition, according to an estimation of the Ministry of
cent o f GDP (Le Quoc Ly 1995). Compared to 14.2 per cent o f GDP for domestic saving in
the period 1991-95 (calculated from Table 2.11 in the next subsection), this figure shows
[image:49.506.29.461.256.431.2]that household saving has played an important role in domestic saving.
Table 2.9: Balance of bonds and credit notes in four state commercial banks
(billion dong)
1991 92 93 94 95 96*
State-own entities: 5,350 5,230 770 1,266 1,648 1,964
-in percentage o f the total : 68 60 14.2 15.1 13.4 13.3
Private entities 3 5 - - -
-Households: 2,514 3,512 4,643 7,079 10,647 12,831
-in percentage o f the total: 32 40 85.8 84.9 86.6 86.7
Total 7,867 8,771 5,413 8,336 12,295 14,795
Note: a/is expected value
Source: Ministry o f Planning and Investment (1996)
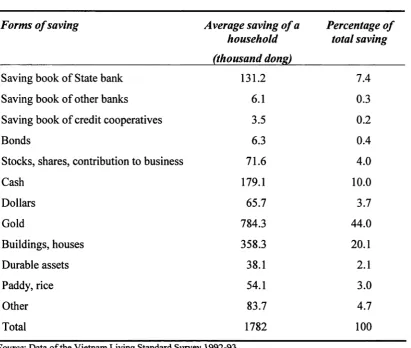
It is worth noting that the data of the Vietnam Living Standards Survey, which was
conducted in 1993, revealed that the financial saving o f households is not the largest part of
household saving. As shown in Table 2.10, the most popular forms of household saving are
Table 2.10: Forms of household saving
F orm s o f savin g A vera g e savin g o f a h ou seh o ld
P ercentage o f tota l savin g (th ou san d dong)
Saving book o f State bank 131.2 1 A
Saving book of other banks 6.1 0.3
Saving book of credit cooperatives 3.5 0.2
Bonds 6.3 0.4
Stocks, shares, contribution to business 71.6 4.0
Cash 179.1 10.0
Dollars 65.7 3.7
Gold 784.3 44.0
Buildings, houses 358.3 20.1
Durable assets 38.1 2.1
Paddy, rice 54.1 3.0
Other 83.7 4.7
Total 1782 100
Source\ Data o f the Vietnam Living Standard Survey 1992-93.
This pattern o f household saving may be explained by the instability o f prices and hyper
inflation that occurred during the period of the late 1980s. The shock of loss of value of
money deposited in banks and in the system o f credit cooperatives as a result of high
inflation and the collapse of the system of credit cooperatives in the second half of the
1980s may have had a considerable influence on the lack o f trust placed by households in