CONTENTS
Introduction
CHAPTER 1 -Investment 3
1.1. Investment and the Economic Setting 3
1.2. Investment in the Community countries by sector: business capital expenditures, housing construction, and public authorities' investment 9
CHAPTER 2 - Financing of Investment 17
2.1. The financial setting 17
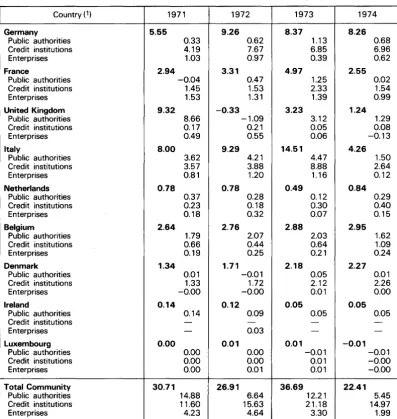
2.2. Financing in the Community countries by sector: personal and corporate savings, new capital issues on domestic markets, bank and other credits
to the economy 22
2.3. Debt issues by Community borrowers on the Swiss and U.S. markets 36
CHAPTER 3 -International Capital Markets 38
3. 1. The contrast between the long-term bond market and the market in
medium-term international credits 38
3.2. Public bond issues on the European international market and issues by
non-residents on national markets 39
3.3. International medium-term credits 41
CONVERSION OF NATIONAL CURRENCIES
All statistical data published in this Report are provisional for 197 4 and often for 1973 as well. Throughout this Report data for the Community as a whole refer to the present nine member countries; statistics for years prior to 1973 have been adjusted to add data for the three new member countries to those of the original "Six".
The equivalent in units of account of amounts in national currencies has been calculated at exchange parities or central exchange rates as appropriate. For cur-rencies which began floating in 1972 exchange parities declared to the Interna-tional Monetary Fund were replaced as from mid-1972, initially by the middle closing rate on 29th December 1972. For the currencies which began floating in early 1973, exchange parities were replaced, initially by the middle closing rate on the 19th or 20th of March, as appropriate. The conversion rates for curren-cies with floating exchange rates were subsequently altered whenever the monthly average of market rates varied by more than 5 % from the conversion rate in use. These conversion rates were applied to the available statistical ma-terial in the following manner:
- for individual operations and for amounts outstanding at any particular time, the conversion rate appropriate to the period was used
- for annual totals (such as for Gross National Product or Gross Fixed Invest-ment), a weighted average of conversion rates in force during the year was used.
The conversion rate for the EURCO which consists of the sum of fixed amounts of the currencies of all the member countries of the European Community was taken to be that in force when the first EURCO issue was made in September
1973.
INTRODUCTION
The year 197 4 was one of transition for the European Community as a whole from boom conditions at its beginning to the onset of recession at its end. In the process economic activity and capital markets were subjected to exception-ally strong and varied influences which had a marked impact on investment and its financing.
The momentum of the expansion of activity in 1973 continued in most countries into 19 7 4, bringing in its train high and rising rates of inflation to which was ad-ded the effect of a five-fold increase in the price of petroleum imposed by the oil-exporting countries. In order to counter these threats to the financial stability and balances of payments of Member Countries, there was a general move by national authorities to reinforce policies for the containment of inflation and, where necessary, to strengthen their international reserve positions by external borrowing.
Essential as it was to tackle these serious problems without delay, it is possible that the measures adopted in the first half of 197 4 accentuated the cyclical downturn in economic activity which began during the summer months. It is at least clear that the measures led to a sharp and widespread increase in short-term interest rates which drained funds from long-short-term capital markets at a time when the confidence of investors who normally purchased long-term securities was already shaken by exceptionally high rates of inflation. Another feature oper-ating in the same direction was the preference shown by oil exporting countries for placing their surplus revenue in short-term markets.
Long-term capital markets accordingly suffered serious difficulties around the middle of the year; yields rose sharply and the terms to maturity of new issues, where these were still feasible, had to be drastically curtailed. Undoubtedly these difficulties and the high cost of finance were discouraging to prospective borrow-ers, but they seem not in themselves to have been mainly responsible for the falling away of fixed investment activity.
2
from restraint to ease and investors had begun to return to long-term capital markets.
It is worth noting that while the profit margins of enterprises suffered in many instances from official restraints on prices as well as from the rising cost of in-puts, thus reducing the amount of finance available from internal resources for new investment, the reduction in the volume of fixed capital formation which oc-curred in several countries nevertheless helped to preserve self-financing ratios. Another apparently paradoxical development in the difficult financial climate of 197 4 was the maintenance of a high volume of personal saving, even at negative real rates of interest, which was probably influenced from mid-year onwards by perspectives of rising unemployment.
~IIIII
Chart I - Growth in Gross Community Product, 1970-1974 (percentage change from previous year)
1970
Growth in volume
1971 1972
Growth in value
1973
•
1974
'Implied
price index
%
14
12
10
8
6
4
2
CHAPTER 1
INVESTMENT
1.1. INVESTMENT AND THE ECONOMIC SETTING
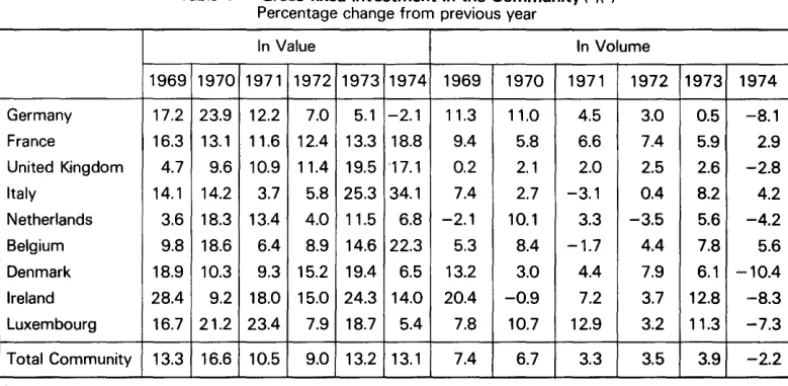
After the boom in 1973 and the shock of a five-fold increase in petroleum prices towards the end of that year, industrialised countries experienced a slowing of economic growth which from mid-197 4 onwards developed into a slide into recession. The persistence of high and rising rates of inflation during 197 4 which had been generated during the preceding boom had adverse repercussions on capital markets and hence on prospects for raising long-term finance. In consequence, the outlook for fixed investment activity was generally un-favourable. Total investment expenditures in the European Community declined last year by 2.2 per cent in volume terms. As can be seen from Table 1 the value of Gross Fixed Invest-ment Formation rose by 13. 1 per cent in 19 7 4 which was a slightly lower figure than in the previous year.
There was nevertheless a marked disparity in the investment performance
ot'
Member Sta-tes. In thr~e countries, France, Belgium and Italy, the volume of fix~d investment in fact increased. This reflected the prolongation of the strong expansion of activity in 1973 into 1974 and resulted in an impressive out-turn for the year as a whole, even though by the last quarter conditions were deteriorating, par·-ticularly in Italy. In three countries, Germany, Luxembourg ~nd the Netherlands, investment volu!lle fell in 197 4 largely because of the ear-lier onset of business stagnation. In the last group of countries, comprising the United Kingdom, Ireland and Denmark, where the volume of· fixed investment also fell last year, business confidence was affected by a wider range of factors including higher than average rates of inflation and serious current account deficits in their balances of external payments.In France, among the first group of countries,
the prolongation into 1974 of the economic
growth which was re-stimulated in 1973 ex-tended into the holiday period in August. Sub-sequently, there was a clear change of direc-tion as recessionary tendencies, accentuated by official anti-inflationary policies, became ap-parent and led to an increase in unemploy-ment.
4
Table 1 - Gross fixed investment in the Community (1)(2)
Percentage change from previous year
In Value In Volume
1969 1970 1971 1972 1973 1974 1969 1970 1971 1972 1973 1974
Germany 17.2 23.9 12.2 7.0 5.1 -2.1 11.3 11.0 4.5 3.0 0.5 -8.1
France 16.3 13.1 11.6 12.4 13.3 18.8 9.4 5.8 6.6 7.4 5.9 2.9
United Kingdom 4.7 9.6 10.9 11.4 19.5 '17.1 0.2 2.1 2.0 2.5 2.6 -2.8
Italy 14.1 14.2 3.7 5.8 25.3 34.1 7.4 2.7 -3.1 0.4 8.2 4.2
Netherlands 3.6 18.3 13.4 4.0 11.5 6.8 -2.1 10.1 3.3 -3.5 5.6 -4.2
Belgium 9.8 18.6 6.4 8.9 14.6 22.3 5.3 8.4 -1.7 4.4 7.8 5.6
Denmark 18.9 10.3 9.3 15.2 19.4 6.5 13.2 3.0 4.4 7.9 6.1 -10.4
Ireland 28.4 9.2 18.0 15.0 24.3 14.0 20.4 -0.9 7.2 3.7 12.8 -8.3
Luxembourg 16.7 21.2 23.4 7.9 18.7 5.4 7.8 10.7 12.9 3.2 11.3 -7.3
Total Community 13.3 16.6 10.5 9.0 13.2 13.1 7.4 6.7 3.3 3.5 3.9 -2.2
( 1) The percentages for 197 4 are approximations based on orders of magnitude.
(2) For individual countries, percentages are based on amounts in national currencies. For the Community total, currencies are converted into units of account at 1970 rates.
in June, by increases in reserve requirements and reductions in credit ceilings. The counter-part in fiscal policy, announced at the start of tt:le new Presidency, included increases in taxes on income, a reduction in the rate of deprecia-tion allowances, the freezing of profits result-ing from inflation, and a cut in government ex-penditure in 197 4. It should be added, howev-er, that because of the deterioration in econ-omic conditions towards the end of 1974, the orientation of monetary and fiscal policy was changed in early 1975.
The response of gross fixed investment to the introduction or reinforcement of restrictive measures normally tends to be delayed and its performance in 1974 proved to be no excep-tion in that it continued to grow (2.9 %) in volume, if at a slower rate than in recent years. Owing to a much higher degree Qf price infla-tion, however, the increase in the value of capital investment of 18.8 per cent in 197 4 was greater than the 13.3 per cent recorded in
1973.
France was not alone in experiencing a carry-over of the momentum of expansion into
1974 as the Belgian economy continued in the first half of that year to be strongly influenced by the expansionary forces evident in the pre-vious two years. Many of the indicators of
economic activity showed a more pronounced upward movement for the year as a whole than in most other countries of the Commun-ity. The volume of Gross National Product in-creased by 4.3 per cent, one of the highest rates of growth in the EEC last year. Industrial output by the third quarter was about six per cent above a year earlier, while unemployment was only slightly higher than in 1973. In short, the downturn of the economic cycle was de-layed in Belgium until the late summer which happened to coincide with a marked stiffening in official policies, and particularly in the mon-etary sphere. This policy reinforcement was prompted by an acceleration in the rate of price inflation. The retail price index which had risen 7.3 per cent in the 12 months to Decem-ber 1973, rose more rapidly during 1974 and in December was 15.7 per cent above a year earlier. The potential loss of competitiveness vis-a-vis Belgium's trading partners, particularly in the Community, caused concern.
[image:7.486.61.455.78.271.2]however, the peak growth in investment activ-ity took place before August. In that month a number of measures were introduced by the public authorities, including a halt to permits on very large buildings and restrictions on mortgage credit, designed to restrain inflation-ary demand pressures, and these began to make themselves felt before the end of the year. Total capital expenditures rose in volume by about 6 per cent in 197 4, and by about 22 per cent in value terms. Belgium was one of the relatively few countries of the Community in which real investment growth last year ex-ceeded that of the economy as a whole. This was not the case in Luxembourg although the overall economy experienced a very satis-factory expansion in 197 4 despite some weak-ening towards the end of the year. Gross Na-tional Product at current prices was estimated to have increased by about 16 per cent last year, of which real growth formed about 4.5 per cent. The basis for this relatively strong performance, as in 1973, was the continuation of good markets for crude steel (steel being Luxembourg's main industry) stimulating an 8.8 per cent rise in output to which was added a 26 per cent increase in prices. As a result of higher volume and prices for steel, total ex-ports of goods and services rose by some 28 per cent in value last year-not far short of the 31 per cent increase in 1973. The agricultural sector registered a modest 3.3 per cent in-crease in the value of output, as lower produce prices tended to offset a rise in production. In October, however, there was a sharp deterio-ration in the markets for steel products, ad-versely affected by stagnation in the econom-ies of other Community countreconom-ies and by par-ticular problems in certain industries such as automobiles.
Investment activity in housing and on the part of public authorities was quite substantial but that of businesses was markedly weak. In total the value of fixed investment in Luxembourg is estimated to have risen by 5.4 per cent last year, but of this amount about 11 per cent was attributable to higher prices, volume having de-clined by around 7 per cent.
To some extent the experience of Italy in 1974 resembled that of the three Member Countries examined above in detail in that the momen-tum of the 1973 expansion carried over into the following year. Until June-July there was a moderate, though, waning degree of underly-ing strength in the economy derivunderly-ing from a rapid increase in industrial expansion and from capital investment expenditures. The downturn is clearly illustrated by the industrial production index which during the second quarter of 1974 averaged 9.6 per cent more than in the comparable period of 1973, but which fell in the fourth quarter to 8.2 per cent below its level a year earlier. Nevertheless, in 1974 as a whole, Gross Domestic Product increased by 3.4 per cent in volume terms while the value of GDP including an appreciable element of price inflation rose by 20.6 per cent.
The downturn in activity in the second half of the year was brought about partly by official action to tackle the acute problems that ex-pansion brought in its train and partly by a general decline in confidence. One of the more serious problems was that of price inflation which accelerated from an annual rate of 12.5 per cent in December 1973 to 24.5 per cent a year later. The increase in price inflation had a sharply adverse effect upon the external pay-ments deficit already suffering under the im-pact of the oil crisis and wide, if unjustified, concern was felt that control over economic forces might slip from the grasp of the national authorities.
6
As part of this arrangement, the Italian govern-ment agreed to pursue stiffer monetary and fiscal policies than hitherto. A limit of Lit. 22 400 milliard on the overall expansion of domestic credit originating from all sources was agreed as well as a limit on the size of the central government's financial deficit. In a se-parate move, the Italian authorities made the ceilings on bank credit, which had been in force since mid-1973, more effective from end-March 1974 onwards. Later in the year other credit and swap facilities were obtained, including a loan from the Deutsche Bundes-bank and the conversion of short-term assis-tance granted by the Community in 1973 into a medium-term credit.
As these necessary remedial measures were taken in the attempt to contain the external deficit and to bring inflation under control, the second half of the year proved to be one of re-trenchment. By end-year these efforts were coming closer to success, and while the non-oil external trade balance achieved a surplus in the month of December, it was not until the first half of 1975 that there was any significant re-duction in the annual rate of price inflation.
In the second half of 1973 a resurgence of ca-pital investment went hand in hand with the strong growth of industrial output at that time. This continued into the first half of 19 7 4 but fixed investment suffered thereafter from the effect of a decline in confidence as a result of the loss of equilibrium both domestically and in the external payments position. Total capital investment rose by 4.2 per cent in volume in 1974 and by about 34 per cent in value terms. In the second group of countries in which the onset of a recession depressed investment ac-tivity, Germany experienced its lowest rate of growth since 1967. The implementation of policies designed to curb inflation and to meet the challenge presented by the greatly increas-ed cost of oil imports coincidincreas-ed with a cyclical slowing of the economy. Although the worst of the current recession was yet to come, the German economy was in a better position by end-197 4 than some other member countries
of the Community. The efforts of the authori-ties were successful in that they prevented any further rise in the rate of inflation, as measured by the cost of living index, and even conduced to a lower monthly rate of increase in prices than in the previous year. Meanwhile, a strong tendency towards surplus in Germany's exter-nal payments had shrugged off the negative impact of higher oil prices.
However, success in overcoming the economic problems prevalent in 197 4 was only made possible at the cost of higher unemployment and a reduction in capacity utilisation. The vol-ume of Gross National Product increased by only 0.4 per cent last year, compared with a gain of 5.1 per cent in 1973. At current prices, GNP increased by 7.0 per cent last year with the major impetus being provided by govern-ment expenditures.
It was against this background of weak domestic demand, a diminution in confidence as to future business prospects and a squeeze on profit margins, that capital investment ex-penditures tended to be reduced in 1974, both in volume and value terms. The volume of ca-pital investment in Germany declined by 8. 1 per cent last year and this decline was shared almost equally by the new construction sector and the machinery and equipment sector. In value terms the decline was not so severe and total capital investment was only 2. 1 per cent lower than in the previous year.
The downturn in capital expenditures may have been moderated by the attempt of the German authorities, who were particularly con-cerned over the serious effects being felt by the construction and equipment manufacturing industries, to boost fixed investment by fiscal measures, including repeal of the investment tax in December 1973.
Somewhat similar trends prevailed in the
Ne-therlands and the development of the economy
decline in the volume of private consumption and a reduction of investment activity. To a minor extent the slackening of economic activ-ity in neighbouring countries also exercised a slowing influence on the growth of the Nether-lands' economy. It was not in fact until the fourth quarter that industrial production, in-cluding the output of mining and public utili-ties, fell below the level reached a year earlier. Gross National Product in volume terms rose by 3.3 per cent in 1974 which represented a slowing in the growth rate from the 4. 7 per cent achieved in the previous year. At current prices GNP increased by 12.3 per cent as the value of government and consumer expendi-tures increased sharply under the influence of rising prices.
Some encouragement for investment in the important sector of industries producing for external markets may have been derived from an increase in the value of exports of the order of 36 per cent in 1974, with a large part of this being attributable to price inflation. But generally, in an. era when price inflation over-shadowed economic growth and the recuper-ation of increased costs proved both difficult and slow, the private sector was reluctant to expand capital investment. Public sector in-vestment had been declining for some years because requirements had already been met in many important aspects. Last year, the value of total capital investment rose by 6.8 per cent, but in volume terms declined by 4.2 per cent. This weakness of capital expenditures in 197 4 was shared by the public and private sectors alike.
Among the countries experiencing the complex problems of low growth, high rates of inflation, rising unemployment, and serious external de-ficits, the United Kingdom was again in difficulty last year. Not only were its problems among the worst in the Community countries, but ev-ents were proving stronger, by the end of last year and in early 1975, than the countervailing government policies to stem these adverse trends. The pattern of industrial activity for the year was shaped at the outset by the three day working week in January and February,
declared as a result of the miners' industrial dispute and the consequent energy shortage. This event curtailed industrial production by 5.5 per cent compared with output in the pre:: vious quarter (seasonally adjusted). Thereafter, in succeeding quarters, industrial output and the economy as a whole worked towards making up the ground lost. By the fourth quarter, however, increasing slackness in de-mand was becoming evident both domestically and externally. For the year as a whole, indus-trial production fell by 3.4 per cent. Gross Domestic Product was a little less affected and increased in volume by 0.6 per cent in 1974, but was nevertheless one of the lowest growth rates in the Community.
The deterioration in the visible trade deficit from £ 2.3 milliard in 1973 to £ 5.3 milliard last year was mostly attributable to the in-creased deficit on oil transactions and only partly to the weakening of export performance. The U.K. authorities accordingly took the view that these oil-inspired trade deficits should be financed by capital inflows and a large-scale programme of public sector borrowing was embarked upon. The floating exchange rate for the pound hence scarcely deteriorated though the build-up of inflationary pressures suggest-ed that there would probably be trouble later from the fact that earnings were rising faster than prices. The Government wage policy, founded on voluntary restraint, met with little response in that average earnings throughout industry had increased by 25.4 per cent in the year to the fourth quarter of 1974 compared with an annual growth of 12.7 per cent a year earlier. Over the span of twelve months to De-cember 1974 the retail price index which rose by 19.1 per cent was signficantly accelerating in contrast to most uther countries of the Community.
cer-8
tain sectors, particularly manufacturing, contin-ued to expand even in volume terms. Invest-ment projects, being of a long-term nature, cannot always be immediately adapted to changed economic circumstances and the ca-pital expenditure cycle tends to lag behind that of the economy as a whole. Moreover, the ex-istence of potential capacity shortages in the United Kingdom has long been recognised with the result that work on long-term projects con-tinues despite shorter-term difficulties.
In Ireland there was also a marked slackening in
the growth of economic activity last year fol-lowing the rapid expansion of 1973. The vol-ume of Gross National Product rose only mar-ginally, by 0.2 per cent in 197 4, compared with an increase of over 5 per cent in the pre-vious year. However, these bald figures, while indicating the difficulties faced last year, hide a number of disparate trends. The upsurge of import prices led to a sharp .. increase in the current account deficit of the balance of pay-ments to almost four times that of the pre-vious year, or the equivalent of more than 1 0 per cent of GNP. However, this potential drain on the external reserves was offset by the sharply increased capital inflows, not only through government borrowing abroad but also by inflows to the private sector which made a valuable contribution to financing in-vestment in 197 4.
Problems were encountered last year by the farming community as lower prices for cattle and higher feed costs resulted in a reduction of farm incomes of about 12 per cent in terms of current prices in 197 4. Since agriculture con-tributed almost 20 per cent of national income in Ireland in 1973 (by far the highest propor-tion in the Community) the set-back of this sector had a serious effect on the economy as a whole. Manufacturing output fared some-what better in that an increase 01 about 2.5 per cent was registered for 197 4, although there was a declining trend in activity from the first quarter onwards, with output in the final quarters being lower than in corresponding quarters of the previous year.
Capital investment conformed closely to the
general pattern of high inflation and low real growth that characterised the Irish economy last year. Total capital expenditures are esti-mated to have risen about 14 per cent in value terms, but because prices rose strongly, such as the more than 25 per cent increase in the capital goods sector, there was a decline in volume of about 8.3 per cent.
The Danish economy entered 197 4 in a rather
firmer state than the United Kingdom or Iland in that it was still benefitting from the re-sidual of the relatively strong growth exper-ienced in the previous year. Thus, for part of last year, until early summer, a number of economic aggregates reflecting consumer de-mand, production and capital investment con-tinued to advance appreciably, despite warning signs that the economy was not in balance. Concern over the heavy external payments de-ficit inherited from the previous year was rein-forced by the substantially higher cost of oil imports during 1974. In addition, wage and price inflation were eroding the competitive-ness of Danish products in international mar-kets at a time when those marmar-kets were be-ginning to experience the onset of a recession-ary phase. Faced with the threat of these ad-verse factors the authorities felt it necessary to introduce more restrictive fiscal policies in the first half of the year and to tighten even fur-ther the already fairly stringent monetary pol-icy. Over the year as a whole the volume of Gross Domestic Product increased by only 0.8 per cent in 197 4, compared with an expansion of 3.4 per cent in the previous year.
1.2. INVESTMENT IN THE
COMMUNITY COUNTRIES BY SECTOR: BUSINESS INVESTMENT,
HOUSING CONSTRUCTION, AND PUBLIC AUTHORITIES INVESTMENT
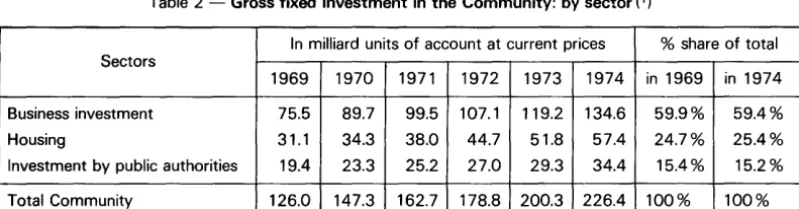
The value of business investment in the Com-munity as a whole increased by 12.9 per cent ·in 1974 to 134.6 milliard units of account. This figure represented 59.4 per cent of the total of Community gross fixed investment of all kinds, as can be seen from Table 2. The larger increase in the value of business invest-ment last year than in 1973 owes much to faster rates of inflation. In volume terms, the pattern of the year was one of slower growth or decline of business investment in the var-ious Community countries as anti-inflationary policies were reinforced and later as recession-ary tendencies took a firmer hold of their econ-omies.
In order to limit the growth of government ex-penditures during an inflationary period there ·was often pressure to cut back on public
au-thorities' investment as being one of the few areas of discretionary spending. However, ac-celerating increases in prices tended to frus-trate this aim of policy and the current cost of total investment by public authorities in the Community rose by 17.4 per cent to 34.4 mil-liard units of account last year.
Throughout the Community dwelling construc-tion came under pressure from the aftermath of the boom conditions experienced in most countries in the early 1970's. Often there was a surplus of unsold new houses at high prices overhanging the market and depressing
pros-pects for a recovery. Total Community invest-ment in new dwellings thus showed the lowest growth of the three sectors, rising in value by only 10.8 per cent in 1974. This compares with an expansion averaging 16.7 per cent in the 19 71-7 3 period, a time when price infla-tion was less significant.
The performance at current prices of individual sectors can best be seen in Chart II on page 11. In Belgium and Italy which led the way with substantial increases in the overall volume of fixed investment in 1974, there were very large rises in the amounts spent on business and housing investment with relative-ly little change in those spent by public author-ities. The volume of fixed investment also rose, if by rather less, in France but here the increase in investment expenditure was much more balanced. Similarly in the United King-dom and Ireland the growth of capital expen-ditures in terms of current prices was fairly evenly balanced as between sectors though, in contrast to France, the total volume of invest-ment had begun to fall.
In the Netherlands, Germany and Denmark the volume of fixed investment fell even more sharply in total. These three countries shared the experience of seeing amounts spent on housing fall in 1974. In Germany investment expenditures by enterprises also fell but this was counterbalanced by higher capital spend-ing on the part of public authorities.
For example in Belgium, investment by busi-ness enterprises was encouraged last year by the good profit position, the capacity
shor-Table 2 - Gross fixed investment in the Community: by sector (1)
In milliard units of account at current prices % share of total
Sectors
1969 1970 1971 1972 1973 1974 in 1969 in 1974
Business investment 75.5 89.7 99.5 107.1 119.2 134.6 59.9% 59.4%
Housing 31.1 34.3 38.0 44.7 51.8 57.4 24.7% 25.4%
Investment by public authorities 19.4 23.3 25.2 27.0 29.3 34.4 15.4% 15.2%
Total Community 126.0 147.3 162.7 178.8 200.3 226.4 100% 100%
[image:12.489.31.431.535.639.2]tages, the need to develop alternative energy sources and the desire to forestall higher prices for investment goods in the future. Thus the value of capital expenditures by the manufac-turing industries rose by about 34 per cent in
197 4 compared with 14.6 per cent in the pre-vious year. In the finance and distribution sec-tors fixed capital investment gained about 13 per cent last year in contrast to a decline in 1973. However, the development of non-resi-dential construction appears to have been con-strained by the controls on large buildings in-stituted in the third quarter of the year. As regards new housing construction, howev-er, the speculative influences backed by the rise in money incomes in 1973 and 1974 en-couraged an increase in volume of about 14 per cent last year with most of this gain oc-curring before the late summer. Again owing to speculative influences residential investment experienced a relatively high rate of price infla-tion of about 20 per cent in 197 4 which led to its increasing in value by 34 per cent. The trend was reversed from September onwards, when the number of starts on new housing units dipped below year earlier figures largely as a result of the restrictions placed by the au-thorities at mid-year on the availability of mortgage funds and of the steep rise in inter-est rates at that time.
Public authority capital expenditures in 1974 were restrained, as in the previous year, by an anti-inflationary budgetary policy and the vol-ume of expenditures declined for the second year in succession. More particularly, capital expenditures by the Belgian public authorities were limited to about 80 per cent of those ori-ginally planned for 197 4. At the end of the year, however, the rising trend of unemploy-ment and the prospect of further weakness in certain key industries and in international trade, led the public authorities to introduce meas-ures designed to increase public sector invest-ment in 1975.
In Italy, business investment in early 1974 was influenced in much the same manner as in Bel-gium by the carry-over effect from the boom conditions prevailing in the previous year.
However, after the first few months of 197 4 industrial production turned downwards as confidence was undermined. The volume of domestic sales was even more sharply curtail-ed, in part the result of the rise in indirect taxes, higher petrol prices and other fiscal measures introduced in July, and a substantial build-up of finished product stocks resulted in the period from August onwards. This process effectively discouraged plant expansion and hence led to a reassessment of business in-vestment plans but mostly too late to affect the year's statistics.
Thus for 1974 as a whole there was an in-crease in the volume of business investment of about 6 per cent, Italy being one of the few Community countries in which the growth of business investment in volume terms exceeded that of the economy as a whole. The value of business capital expenditures, boosted by price inflation, rose by 34 per cent. The very large rise in prices created some problems for the fi-nancing of investment at a time when a 15 per cent limit was placed on the annual growth of credit. These problems were however taken into account in the renewal of the obligation on banks to hold a certain proportion of their portfolios in bonds issued by specialised finan-cial institutions.
discouragement, particularly towards the end of 1974.
The commitment of the government to res-train public expenditures and to limit the bud-getary deficit to less than Lit. 9 200 milliard seems to have contributed to the decline in public sector investment last year. The volume of public sector capital investment in Italy in 1974 accordingly continued its downward ten-dency of recent years. But as evidence accu-mulated in late 1974 and early 1975 on the growing recession of the economy, and partic-ularly in the investment sector, it became evi-dent that some selective relaxation of the tight monetary and fiscal policies might be appro-priate in view of the weaker state of the econ-omy. Thus in early 1975 a package of fiscal measures was introduced, including some in-tended to directly stimulate public investment expenditures.
Expenditure on fixed investment in 197 4 was more balanced in France than in Belgium and Italy, though the influences operating in each sector were different. During the first half of the year there was a lively demand by the bu-siness sector for machinery and equipment in response to the economic conditions prevailing at that time. As this Jed to a more rapid in-crease than usual in imports of capital goods, it was necessary to redeploy the economic ef-fort of the country in such a way as to mod-erate demand for such imports and at the same time to allow capital goods producing in-dustries to channel more of their output into exports and to cater for the needs of invest-ment in new sources of energy. The reduction at mid-year in the availability of credit was di-rected towards this end. Subsequently, the de-teriorating economic outlook also served to discourage investment. By the fourth quarter of last year sales and output were falling in a
Chart II - Elements of gross fixed investment (1)
%
-10
Percentage Change 1974/1973 at current prices, based on amounts in national currencies
France United Kingdom Italy Holland
Investment ' by Enterprises
· Housing investment
(1) Estimates based on orders of magnitude.
,I
Belgium Denmark Ireland Luxembourg
•
Investment of public authorities
%
30
number of key industries such as those for au-tomotive, steel, textile, chemical and rubber products. Not only were plans for future in-vestment affected but existing projects, such as in the property sector, suffered from the cost of finance and speculative expectations of a high net return on leasing building space were undermined.
The volume of investment by public sector en-terprises was, however, more affected than that of the private sector, partly because of governmental policies of direct restraint and partly because of the impact of the overall lim-itation of budgetary expenditure on purchases of capital equipment during a period of rapidly rising prices. The out-turn for 197 4 as a whole was not unimpressive in these circumstances. Expenditure on fixed investment by non-finan-cial enterprises, including those of the public sector, rose by 2.8 per cent in volume and by
18.6 per cent in value.
A broadly similar pattern occurred in residential investment in France which rose by 0.4 per cent in volume last year and by 20.5 per cent at current prices. In the first half of 1974 spe-culative influences associated with a desire to acquire physical assets in a time of uncertainty contributed to the fairly large number of hous-ing starts durhous-ing this period which in turn as-sured a modest growth in the residential con-struction industry. The housing market was, however, affected by the high cost of mort-gages and the number of dwellings commenc-ed fell sharply in the fourth quarter.
The increased emphasis on social programmes in France last year probably had a minor in-fluence on public sector investment. Capital ex-penditures by central and local governments seem to have been less affected by the cut-back in budget expenditure at mid-year than public sector enterprises and they conse-quently rose by 2. 7 per cent in volume and by
18.2 per cent in value or by only slightly less than the whole business sector.
However, in Luxembourg not all the sectors participated equally in the modest increase in the value of capital investment in 1974.
Busi-ness investment suffered a check in the face of lowered expectations of future economic activ-ity, declining by about 8 per cent in value terms. A principal factor in this decline was the reduction in investment by the steel industry of about 12 per cent compared with 1973. Ca-pital expenditures by the new non-steel indus-tries declined as a result of the termination of many of recent plant expansion programmes. New residential construction was adversely af-fected by the restrictions on mortgage credit imposed in mid-1973. Speculative demand in-fluences took some while to diminish but the number of new permits for residential con-struction declined on a year-on-year basis from the second quarter onwards, and for 197 4 as a whole they were 7 per cent lower. The index of construction activity, comprising both resi-dential and non-resiresi-dential sectors, was 7 per cent higher on average in 1974 than in 1973. Investment by the Luxembourg public sector was appreciably higher last year in value terms, mainly as a result of the expanded road-build-ing programme and other infrastructural ex-penditures.
Table 3 -The share of capital investment in the economies of the Community countries (1)
Gross fixed investment Gross
national Sector shares in %
Countries product As% of
at current gross
Invest-market national Investments Housing ments
prices product by construe- by public Total
enterprises tion authorities
Germany, DM milliards 1973 916.9 25 60 26 14 100
1974 980.9 23 59 24 17 100
France, FF milliards 1973 1 108.1 24 61 27 12 100
1974 1 281.0 25 61 27 12 100
United Kingdom, £ millions 1973 72 315 19 61 21 18 100
1974 81 927 20 63 20 17 100
Italy, Lit. milliards 1973 80963 21 57 30 13 100
1974 97 182 23 57 31 12 100
Netherlands, Fl. milliards 1973 166.48 23 56 28 16 100
1974 187.04 22 58 26 16 100
Belgium, BF milliards 1973 1 767.6 22 59 24 17 100
1974 2 069.4 23 60 26 14 100
Denmark, Kr. milliards 1973 164.56 23 52 28 20 100
1974 183.71 22 55 25 20 100
Ireland, £ millions 1973 2 651 24 34 26 40(2 100
1974 2 879 25 33 26 41 (2 100
Luxembourg, Flux. milliards 1973 71.44 28 ·60 21 19 100
1974 82.82 26 53 24 23 100
Total Community,
u.a. milliards 1973 840.2 23 60 26 14 100
1974 920.4 23 60 25 15 100
( 1) The table is based on estimates, at current prices, of orders of magnitude. In a strict sense, comparisons of gross
fixed investment cannot be made because of differences of definition and composition from one member country to another.
(2) Includes some element of fixed investment by semi-State corporations.
enterprise sector slackened somewhat in the fourth quarter of the year in resr>onse to the slowing of the economy at that time and the difficulties of financing increased working capi-tal requirements.
Housing investment was also mixed, private residential housing declining sharply compared with 1973, while local authority housing ex-panded rapidly as a counterbalance. The pri-vate housing sector in the United Kingdom was depressed in 1974. Demand for new houses was slack, mortgage finance was costly and, in the first half of the year, difficult to ob-tain. From the builders' viewpoint construction costs of new. housing had continued to in-crease rapidly but at the same time the stock of unsold homes depressed the market, and,
with high interest charges on borrowings, pro-fitability was often pared to vanishing point. Private sector housing started during 1974 was down 5 1 per cent from the previous year while total new private sector housing invest-ment in the United Kingdom declined in vol-ume by 20.5 per cent. Even at current prices capital investment in private sector housing de-clined by 4.8 per cent.
[image:16.482.31.428.71.391.2]Public sector non-residential capital expendi-tures declined by 8 per cent in volume last year. In this context the relatively large govern-ment expenditure cuts announced in 1973 started to be reflected in the investment pro-gramme. On the other hand, in terms of cur-rent prices public sector investment increased at a rate similar to that of the other two main sectors.
The public sector apart, the behaviour of in-vestment in Ireland in 1974 bore some resem-blance to that in the United Kingdom. Invest-ment by the business sector rose by about 18 per cent at current prices last year mainly as a result of higher machinery and equipment ex-penditures. Imports of producers' capital goods which are indicative of investment perfor-mance, rose by an estimated 25 per cent in value terms. Non-residential business construc-tion, however, was perhaps more affected by the unsettled business environment, with long-term prospects clouded by rising inflation.
The pattern of expenditure on residential con-struction was mixed. Investment in housing by the private sector was reduced last year in constant price terms, as a result of difficulties which the Building Societies in Ireland exper-ienced in attracting funds. Any reduction, how-ever, was more than compensated by the sharp increase in public authority expenditures on dwellings, the value of which rose by over 30 per cent last year. Total residential invest-ment increased almost 23 per cent in value in
1974.
The value of Irish public authority i_nvestment (excluding housing) expanded by an estimated 23 per cent last year although direct compar-isons with 1973 are not possible owing to a change in the financial year. The central gov-ernment pursued an actively stimulative invest-ment policy in 1974 which was reflected in a higher borrowing requirement. Local authority capital expenditures (excluding housing), which are almost entirely financed by the central gov-ernment, did not increase to the same extent. The pattern of investment expenditure in the
Netherlands in 1974 was more uneven than in
the United Kingdom and Ireland as the busi-ness sector did not share in the fall in the vo-lume of fixed capital formation. A certain ben-efit accrued to enterprises in the Netherlands last year from the re-introduction of invest-ment allowances for tax purposes, and this factor, together with new energy diversification projects, no doubt maintained business invest-ment on a higher plane than might have other-wise been the case. Capital expenditures by private and public enterprises were nevertheless retarded initially by the uncertainties of the oil crisis. However, as it became clear that supply problems were less acute than feared, there was an element of catching up in the summer period and, in 1974 as a whole, the value of business capital expenditures increased by over eleven per cent while in real terms there was virtually no change. Because of the rising cost of labour the private sector resorted to dee-pening its investment in capital equipment. Ex-penditures on new machinery and equipment were little affected by the economic slowdown but, in terms of volume, investment in build-ings declined, partly for cyclical reasons but also because of the persistence of a secular downtrend. In an attempt to counteract this, further tax incentives on investment on new buildings were introduced in the fourth quarter of last year.
take into account higher mortgage rates and the inflation of land and building costs. The public authorities in the Netherlands have pursued for some years a policy of limiting their total expenditures to the volume of re-sources available after the demands of the pri-vate sector and the balance of payments had been met. In implementing this policy it has proved easier to restrict the public sectors' ca-pital investment than its current expenditure. There has thus been a secular decline in public investment over the last few years and, al-though short-term programmes of public works have been introduced to combat unem-ployment. the total of Dutch public sector in-vestment continued to fall last year. The mea-sures introduced towards the end of 197 4 to counteract the rise in unemployment and the economic slowdown that was then occurring were designed to stimulate investment in the public as well as the private sector. Neverthe-less total capital expenditures by central and local government in 1974 were 19 per cent lower in real terms than six years previously. The pattern of investment in Germany in 1974 was also uneven. Certain aspects of construc-tion activity, particularly new housing, were distinctly weak in the first half of 1974. New dwelling construction was affected by the downswing in the economic cycle, as evidenc-ed by the ending of the property boom of the early part of the decade, and the large stock of unsold houses. Higher interest rates tended to delay any resurgence in private residential c~n struction and as a result the value of new con-struction declined in 1974 by 10.5 per cent from a year earlier. To counter this slackness in private sector dwelling construction the Ger-man public authorities inaugurated pro-grammes to increase the numbers of houses erected with government assistance.
A similar pattern was evident in private non-residential building. The hesitancy of private in-dustry in placing orders for new capacity, was compensated to a large extent by a sharp ex-pansion in building and civil engineering pro-jects by the German public authorities, many of which were acting under various special
pro-grammes designed to offset slackening de-mand. The value of total public sector capital expenditures increased by 20.2 per cent last year.
Capital expenditures on machinery and equip-ment by the German business sector declined in 1974, by about 2.9 per cent in value and by about 9 per cent in volume terms. These fig-ures reflect the slackening of demand combin-ed with what was. by international standards, a relatively low rate of price inflation during the year, a consequence of which was a nar-rowing of profit margins. The declining trend in investment in new machinery and equipment was closely related to the state of industry as a whole. A number of industries such as motor vehicles and construction were adversely af-fected by economic circumstances from the beginning of the year and later, in the second half of 1974, the chemical, textiles and steel industries suffered a reduction in sales, thus adversely affecting orders for new equipment. The very strong export order book formed the mainstay for the industries concerned (provid-ing some support for certain suppliers of new equipment) but, to~ards the closing months of the year, even the export sector saw a decline in orders relative to those received earlier in 1974. Total non-residential business invest-ment in Germany, comprising both new con-struction and equipment declined by 9.6 per cent in value terms last year.
Invest-ments in new buildings and similar construc-tion work having long lead times before com-pletion, seem on the other hand to have been less affected by the sudden slowing in busi-ness activity than investments in machinery and equipment, especially transportation equip-ment. Thus, in the year 1974, Danish business investment declined by 2.4 per cent in volume following a 14.6 per cent gain in 1973. Price inflation contributed to raising its value by about 14.4 per cent in 197 4.
Housing investment in Denmark was hard hit by the very high cost of mortgage finance pre-vailing for most of the year, and by the after-math of the 1972 and 1973 building boom which left a large stock of unsold houses. These factors coincided with a downturn in consumer confidence and uncertainty as to the employment situation, resulting in a sharp re-duction of about 25 per cent in the volume of housing investment in 1974. The depressed state of residential construction is made even clearer by the continual decline in each quarter of last year in the number of dwelling units started. For 197 4 as a whole the number of dwelling units started in Denmark was reduced to only 25 708 units compared with a ~otal of
50 399 units started in the previous year. In contrast, housing completions totalled 48 595 units in 197 4.
Public authority capital expenditures were sharply curtailed last year as a result of the de-liberate policy in Denmark of halting govern-ment building and public works construction. This limitation which lasted from April until August of last year for local governments, and until October for the national government, was a reflection both of the long-standing desire to restrain the role of government in the economy and of the need to give force to anti-inflation-ary policies which were introduced at that time. As a result of this enforced halt on public authority construction in Denmark for a good part of the year, the volume of government ca-pital expenditures for 197 4 was about 14 per cent lower than in the previous year, continu-ing the declincontinu-ing trend evident since 1971. Following the resumption of public authority construction activity towards the third and fourth quarters of last year, it would seem that capital expenditures by the government might well increase quite considerably in 1975, com-pared with the level of activity evident in mid-1974.
CHAPTER 2
FINANCING
OF
INVESTMENT
2.1. THE FINANCIAL SETTING
At the beginning of 197 4 national authorities were confronted with the need to overcome the serious problems of inflation and of adjust-ment to the sharp increase in petroleum prices demanded by oil exporting countries. In the main the first of these problems was tackled by the introduction of measures to reduce the availability of credit in order to bring about a slackening of demand and of pressures exerted on prices by rising costs. Apart from relatively minor cutbacks in consumption, the main ap-proach to the second of these problems adopt-ed by countries likely to be in heavy deficit on current account in their balance of payments, was to seek to borrow substantial sums on the international capital market.
Both these policies had an inevitable impact on capital markets. The first of these resulted in a rise in short-term interest rates on national ca-pital markets through the operation of restric-tive monetary policies. The second on the oth-er hand, helped to sustain, and possibly to raise, interest rates on short-term eurocurrency markets from which the banking syndicates extending the large scale credits drew their re-sources. The high rates of interest available on eurocurrency deposits certainly attracted the surplus revenues earned by oil exporting countries and probably were a contributory cause from time to time of shortages of liquid-ity on national money markets.
Long-term capital markets in fixed interest se-curities suffered from the upsurge in short-term interest rates on the international market and on national markets which in a number of instances resulted in the appearance of a rev-erse yield gap with short -term rates higher than long. As the prevailing rates of inflation mostly exceeded the yield on long-term invest-ments, bond markets looked decidedly unat-tractive for a large part of 197 4. Movements
out of long-term securities into short-term pla-cements undoubtedly took place with a conse-quent increase in long-term rates but possibil-ities for such rearrangements of portfolios were limited by the capital losses that would have been involved. The rise in long-term yields was, however, sufficient to discourage new borrowing.
New issues of shares also suffered. Additional difficulties in share markets were the uncer-tainty over ·the profitability of enterprises in an inflationary climate and the unmistakable signs of an impending recession which became ap-parent from mid-year onwards.
res-ponse to liquidity problems caused by the out-flow of capital in the third quarter. Finally, from October onwards, there was a distinct shift of emphasis in monetary policy aimed at countering the gathering recession of the economy and the mounting numbers of unem-ployed.
The success in reducing price inflation in Ger-many was attributable not only to a gradual weakening of demand but also to special fac-tors working in favour of a limitation of price increases. The increase in the cost of living over a span of twelve months was 7.4 per cent at the beginning of last year; by end-197 4 the annual increase in prices was down to less than 6 per cent-the lowest in the Community. Two special factors contribut-ed to this performance; the decline in the pro-ducer prices of a number of food items con-tained in the cost of living index, and the in-crease in the external value of the Deutsche-mark, especially towards the end of 197 4, which helped to offset the rate of price infla-tion of imported products. On the other hand, the control over inflation was not helped by a faster rise in wage rates in 19 7 4 than during the previous year, which thereby placed a squeeze on profit margins.
In the first half of 1974, however, the overrid-ing aim of the German monetary authorities was to stabilise the economy in the face of a rising rate of wage inflation and the exigencies of the oil crisis. The money supply on a broadly defined basis (M2 corrected for changes in the composition of reporting banks) rose by 7.9 per cent between June 1973 and June 197 4, which compared with an increase of 18 per cent in the previous 12 month peri-od. The intent of credit policy continued to be oriented in the summer months towards pro-ducing stability, although by this time the de-mand for credit was slackening. The existing restrictions consequently did not appear to need tightening. The Bundesbank was con-cerned primarily with compensating for the drain on liquidity which resulted largely from capital outflows by offering unlimited "lom-bard" loan facilities and lowering the minimum reserve ratios on the banks' domestic liabilities
(in September). Also in September the Barde-pot reserve requirements on funds borrowed abroad was lifted.
against the guilder and the possible impact of the oil crisis began to be eased in 1974. These relaxations had no internal effect. For example, the Nederlandsche Bank was able, in the ab-sence of incentives for foreign investors to place their funds in securities denominated in guilders, to abolish the "0-guilder" regulations whi'ch had prevented foreign capital from reaching the domestic bond market.
Dutch policy regarding wages was designed to ensure that lower income groups did not suffer any reduction of real earnings from the effects of the oil crisis. This involved some element of redistribution of incomes. The price controls in force during the year were intended, on the other hand, to limit and delay the impact of in-flation. Enterprises consequently found them-selves faced with the serious problem of rising wage payments and a limitation on the prices they were allowed to charge, which thus cul-minated in a squeeze on their profit margins. Capital markets within the Belgian
I
Luxem-bourg monetary union were also beginning to surmount their difficulties by end-197 4. The principal emphasis of the Belgian authorities' anti-inflation policy last year was on monetary rather than fiscal policy. At the beginning of 1974 there was some uncertainty as to the possible effects of the oil crisis and conse-quently a flexible attitude was adopted to-wards credit policy. By March, however, it was clear that this approach was doing little to curbthe rate of credit expansion and, with effect from April 1, a credit ceiling was introduced which was in force for the rest of the year, having been considerably toughened in June.
Monetary policy was also aimed at lessening speculative activities and, with this in mind, the Belgian authorities acted to raise interest rates. While the official discount rate was only raised once, in February, from 7.75 to 8.75 per cent, various measures were taken to apply the higher rates on the central bank's special loan facilities to a broader spectrum of loan busi-ness. Short-term money rates climbed up-wards until late summer under the influence of a similar movement in other external markets; the three month treasury bill rate in Belgium, which in January had been 7.65 per cent, av-eraged 11.75 per cent during the months July-September and subsequently declined to 10.50 per cent only in December. Long-term yields followed a similar pattern, those for gov-ernment bonds rising from 8. 14 per cent in January to 9.26 per cent in August before re-ceding to 9.03 per cent in December.
In Luxembourg price inflation, which was
rela-tively low in 1973, steadily worsened last year and consumer prices which had risen at an an-nual rate of only 6.8 per cent in January 1974 showed a rate of inflation of 11.2 per cent by year-end. In order to slow the expansion of credit and to stimulate saving, the public
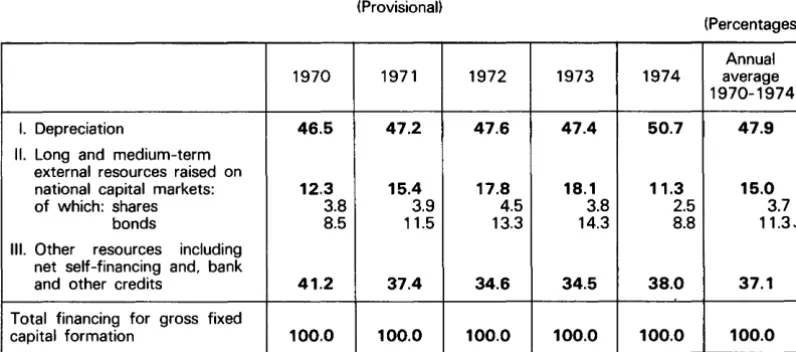
au-Table 4 -Methods of financing the fixed investment of enterprises in the Community
(Provisional)
(Percentages)
Annual
1970 1971 1972 1973 1974 average
1970-1974
I. Depreciation 46.5 47.2 47.6 47.4 50.7 47.9
II. Long and medium-term external resources raised on
national capital markets: 12.3 15.4 17.8 18.1 11.3 15.0
of which: shares 3.8 3.9 4.5 3.8 2.5 3.7
bonds 8.5 11.5 13.3 14.3 8.8 11.3.
Ill. Other resources including net self-financing and, bank
and other credits 41.2 37.4 34.6 34.5 38.0 37.1
Total financing for gross fixed
[image:22.480.24.422.469.645.2]20
thorities introduced or extended measures in July and August to restrict mortgate lending and to raise interest rates. The latter step had the dual purpose of encouraging savings (ini-tially not very successfully) through higher sav-ings deposit rates and discouraging the de-mand for loans by a parallel increase in interest rates on loans.
In common with those in the remaining five Member Countries, financial markets and inter-mediaries in Denmark experienced difficulties last year in meeting the demand for invest-ment funds in the face of a stringent limitation on the availability of credit and interest rates consequently soared. The authorities tightened monetary conditions during the first half of the year both through a squeeze on bank liquidity and by the simple expedient of not raising the ceiling on bank lending until August. The gov-ernment also introduced an unusual scheme in February to dampen the effect on prices of in-creases in index-linked labour costs by reim-bursing companies with a proportion of the in-crease they were compelled to bear. On the side of demand, a compulsory savings scheme for individuals was introduced and, in May, in-direct taxes were increased. Monetary policy, however, probably contributed more than these last measures towards reaching the ob-jectives of containing inflation and reducing the trade deficit.
Largely as a result of these restrictive policies, interest rates rose steeply until mid-year; the average yield on mortgage bonds on the Dan-ish market rose from 13.78 per cent in De-cember 1973 to 17.68 per cent in July last year before retreating to 14.54% in Decem-ber. The stance of monetary policy was chang-ed, in recognition of a weakening of the econ-omy, by the relaxation of the ceiling on bank lending in August and, in November, this ceil-ing had to be raised again because of a further deterioration in the business outlook. The de-cline in interest rates from their peak in July can thus be ascribed mainly to the easing of monetary policy (which was facilitated by the general downtrend in the same period of inter-est rates on the international and other nation-al capitnation-al markets) but the underlying
reces-sionary tendency of the economy also played a part.
The tight monetary policy which France had been experiencing since it was introduced in late 1972 was reinforced at the beginning of 1974. The monetary authorities tended to operate on the level and composition of banks' reserves as a means of achieving interest rate objectives which were an important element in their anti-inflationary policy. The situation was complicated by substantial outflows of c~pital in a bout of speculation against the French franc in January as a result of which the re-serve requirement on non-resident deposits was suppressed in an effort to encourage the funds to remain in the system and so to prev-ent a further cost to the overall balance of payments.
As a result of the general restraint on bank li-quidity in the first half of 197 4, the whole structure of interest rates rose by between one and two percentage points from the end of 1973 to July 1974. At a time when inflation was eroding the real value of capital there was a fear that saving would not be sufficiently en-couraged by the interest rates on offer at the beginning of the year. Similarly it was judged that higher interest rates would help to discourage the speculative activities which were tending to add to inflationary pressures in the first half of the year. On the other hand, the indications are that genuine investment ac-tivity suffered in the latter part of 19 7 4 from a deterioration of the economic outlook rather than the high cost of borrowing. The selective easing of monetary policy' in the closing months of the year in fact led to a decline in some market rates of interest, for example on bonds issued by· public sector or semi-public sector borrowers. The average yield on long-term bonds issued by private sector borrowers, however, having risen from 9.83 per cent in December 1973 to 11.93 per cent in June 197 4 remained close to that figure until the years' end.
The United Kingdom was among the three