promoting access to White Rose research papers
Universities of Leeds, Sheffield and York
http://eprints.whiterose.ac.uk/
This is an author produced version of a paper published in Applied Acoustics.
White Rose Research Online URL for this paper:
Published paper
Yu, L., Kang, J. (2010) Factors influencing the sound preference in urban open spaces, Applied Acoustics, 71 (7), pp. 622-633
Elsevier Editorial System(tm) for Applied Acoustics Manuscript Draft
Manuscript Number: APAC-D-08-00053R3
Title: Factors Influencing the Sound Preference in Urban Open Spaces Article Type: Research Paper
Keywords: Sound; sound preference; urban open space Corresponding Author: Prof. Jian Kang,
Corresponding Author's Institution: School of Architecture First Author: Lei Yu
Order of Authors: Lei Yu; Jian Kang
1 2 3 4 5 6 7 8 9 10 11 12 13 14 15 16 17 18 19 20 21 22 23 24 25 26 27 28 29 30 31 32 33 34 35 36 37 38 39 40 41 42 43 44 45 46 47 48 49 50 51 52 53 54 55 56 57 58 59
Factors Influencing the Sound Preference in Urban Open Spaces
Lei Yu, Jian Kang
School of Architecture, University of Sheffield, Western Bank, Sheffield S10 2TN, UK
Contact details of the corresponding author:
Professor Jian Kang, School of Architecture, University of Sheffield, Western Bank, Sheffield S10 2TN, UK.
1 2 3 4 5 6 7 8 9 10 11 12 13 14 15 16 17 18 19 20 21 22 23 24 25 26 27 28 29 30 31 32 33 34 35 36 37 38 39 40 41 42 43 44 45 46 47 48 49 50 51 52 53 54 55 56 57 58 59
Abstract
In this paper, based on a large scale survey in Europe and China as well as corresponding laboratory studies, the influencing factors on the sound preference
evaluation, considering social, demographical, physical, behavioural and
psychological facets, have been systematically examined based on statistical analyses for each of the nineteen case study sites. Various sound types have been considered, including natural, human, mechanical and instrumental sounds. In terms of social/demographical factors, the results suggest that age and education level are two factors which universally influence the sound preference significantly, although the influence may vary with different types of urban open spaces and sounds. With increasing age or education level, people tend to prefer natural sounds and are more annoyed by mechanical sounds in general. It has also been found that gender, occupation and residence status generally would not influence the sound preference evaluation significantly, although gender has a rather strong influence for certain sound types such as bird sounds, especially at certain case study sites. In terms of physical factors (season, time of day), behavioural factors (frequency of coming to the site, reason for coming to the site), and psychological factors (site preference), generally speaking, their influence on the sound preference evaluation is insignificant, except for limited case study sites and certain sound types. The influence of home sound environment, in terms of sounds heard at home, on the sound preference has been found to be generally insignificant, except for certain sounds. It is noted that there are some correlations between social/demographical factors and the studied physical/behavioural/psychological factors, which should be taken into account when considering the influence of individual factors on sound preference.
1 2 3 4 5 6 7 8 9 10 11 12 13 14 15 16 17 18 19 20 21 22 23 24 25 26 27 28 29 30 31 32 33 34 35 36 37 38 39 40 41 42 43 44 45 46 47 48 49 50 51 52 53 54 55 56 57 58 59
1. Introduction
With the renaissance of city centres, urban open spaces are re-conceptualised with the new ‘urbanity’ [1]. In order to create a friendly environment, rethinking the urban
open spaces from an ecological viewpoint is important [2]. Sound quality is
considered as a key part of ecological/sustainable development of urban open spaces
[3-4]. Soundscape, also called acoustic landscape, is simultaneously a physical and a
social environment when one perceives the environment with his/her hearing, where a sound is a basic element in the ‘scape’ [5]. This ‘scape’ physically consists of the
sounds, the energy waves, the listeners, and the listener’s social circumstances,
dictating who gets to hear what [6-11].Subjective effects of soundscape rely on the
perceptions to acoustic phenomena through a cognitive process in which two concepts
are used: sounds and noises [12]; it is essential to determine aesthetic satisfaction of an aural ‘scape’ [13]. In many soundscape-related studies, the general evaluation of a
soundscape is usually considered as sound level evaluation, namely subjective
evaluation of loudness, normally for background noise [15-20], and as sound
preference evaluation, namely the evaluation of foreground sounds [10-12, 21-22]. As
basic components, individual sounds are important in the whole soundscape [23]. The
evaluation of the sound preference is therefore crucial to determine soundscape
quality in a specific space.
With ever increasing community noise since industrial revolution, a large number
1 2 3 4 5 6 7 8 9 10 11 12 13 14 15 16 17 18 19 20 21 22 23 24 25 26 27 28 29 30 31 32 33 34 35 36 37 38 39 40 41 42 43 44 45 46 47 48 49 50 51 52 53 54 55 56 57 58 59
out [15-17]. Recently, accounting for meaningful acoustic environments, issues of
sound identification and its effects on aural perceptions have been brought forward
with a cognitive or ecological approach [12]. However, the study on the sound
preference, especially in urban open spaces, has been rather limited, although it has
been suggested that the sound preference is affected by various factors from both
physical and social aspects [24-26]. In our previous study [13-14], the sound
preference was investigated in some typical urban squares, as a part of an overall
soundscape research. In the investigation presented in this paper, however, a more
systematic analysis has been made based on case studies in nineteen urban open
spaces in Europe and China as well as on laboratory experiments.
Environmental psychologists pointed out that the implicit attributes of
social/cultural factors and the explicit attributes of physical surroundings are interrelated to affect people’s perception of a physical sound [27-28]. Therefore, the
study of the sound preference evaluation is mainly to explore the relationships
between the preference of a sound and the implicit and explicit attributes. Unlike the
preferences of musical listening which focus on the sound itself, the judgement of
everyday sound listening is to gather relevant information about our surrounding
environment [11]. In this study, the influencing factors on the sound preference
evaluation, considering social, demographical, physical, behavioural and
psychological facets, have thus been systematically examined based on a series of
large scale field survey. The influences of those factors on the sound level evaluation
1 2 3 4 5 6 7 8 9 10 11 12 13 14 15 16 17 18 19 20 21 22 23 24 25 26 27 28 29 30 31 32 33 34 35 36 37 38 39 40 41 42 43 44 45 46 47 48 49 50 51 52 53 54 55 56 57 58 59
useful for soundscape design in urban open spaces, and also helpful for formulating
input variables for a soundscape prediction model based on artificial neural networks
[30-33].
2. Methodology
2.1 Field survey
From 2001 to 2005, a series of field studies were carried out in fourteen European
and five Chinese urban squares. The case study sites were selected from nine cities in
six countries, namely Bahnhofsplatz, Germany Kassel (site 1); Florentiner, Germany
Kassel (site 2); Karaiskaki, Greece Athens (site 3); Seashore, Greece Athens (site 4);
Kritis, Greece Thessaloniki (site 5); Makedonomahon, Greece Thessaloniki (site 6);
IV Novembre, Italy Milan (site 7); Piazza Petazzi, Italy Milan (site 8); Jardin de
Perolles, Switzerland Frobourg (site 9); Place de la Gare, Switzerland Frobourg (site 10); All Saint’s Garden, UK Cambridge (site 11); Silver Street, UK Cambridge (site
12); Barkers Pool, UK Sheffield (site 13); Peace Gardens, UK Sheffield (site 14);
Chang Chun Yuan Square, China Beijing (site 15); Xi Dan Square, China Beijing (site
16); Century Square, China Shanghai (site 17); Nanjing Road Century Square, China
Shanghai (site 18); and Xu Jia Hui Park, China Shanghai (site 19). The case study
sites represented a variety of microclimatic and macroclimatic conditions, a diversity
1 2 3 4 5 6 7 8 9 10 11 12 13 14 15 16 17 18 19 20 21 22 23 24 25 26 27 28 29 30 31 32 33 34 35 36 37 38 39 40 41 42 43 44 45 46 47 48 49 50 51 52 53 54 55 56 57 58 59
level and residential status (local or non-local).
Information gathered through the questionnaire surveys and observations included the interviewees’ social/cultural background, their activities and behaviours on site,
the sounds they identified, and their sound preferences. The acoustic questions were
generally introduced as a part of the investigation of the overall physical environment,
to avoid possible bias. Objective measurements of the sounds were also made and
other physical conditions of the surroundings were recorded during the interviews. A
database was consequently established, with variables of social attributes including
age (1: <12; 2: 12~17; 3: 18~24; 4: 25-34; 5: 35-44; 6: 45-54; 7: 55-64; 8: >65);
gender (male and female); occupation (students, working people and others, such as
unemployed and pensioners); education (primary, secondary and higher level);
residential status (local and non-local); sounds often heard at home (bird, insect,
speaking, music, and traffic), preference of the site (like the site or do not like the site
for certain reasons), frequency of coming to the site (first time, per year, per month,
per week, per day for EU sites; and first time, occasionally, sometimes, often, daily
for Chinese sites); and reason for coming to the site (for the equipment/services of the
site, for children playing and private meetings, for business/meeting/break, for
attending social events, passing by). Also included in the database were some physical
attributes including season and time of day during the interviews, which were found
to be related to noise evaluation in previous studies [34-35]. In Table 1 the above
factors and their categorisations and scales are summarised. Wherever appropriate,
1 2 3 4 5 6 7 8 9 10 11 12 13 14 15 16 17 18 19 20 21 22 23 24 25 26 27 28 29 30 31 32 33 34 35 36 37 38 39 40 41 42 43 44 45 46 47 48 49 50 51 52 53 54 55 56 57 58 59
The frequency analyses showed that normal distribution was generally followed for
the factors studied at each case study site.
In Table 1 it can be seen that three categories are assigned to education. Education
is a broad concept, referring to all the experiences in which a person could have
learned, and it is an important part of socialisation [36]. While the comparison
between people with different education background is rather complicated, in this
study a comparison has simply been made between different education levels.
Generally speaking, there are three levels, namely primary, secondary and higher
education despite the disparity of adult and alternative education in which no distinct
difference exists from low to high level [36]. For occupation, in the surveys a range of
categorisations were used. However, considerable differences were found between
different cities and countries in terms of the definitions and categorisations of
occupations. In order to make comparisons within a common framework, occupations
were then re-arranged to form three categories. In terms of the reason for coming to
the site, similarly, the survey results were also re-arranged from nine to five categories,
given the differences between case study sites, and small sample sizes in certain
categories and case study sites.
The questions were initially developed in English, and then translated into other
languages. Since the surveys were carried out over five years, in several phases, some
slight modifications were made in the questionnaire design. For example, in the
surveys in China the question about the sounds often heard at home was added, but
1 2 3 4 5 6 7 8 9 10 11 12 13 14 15 16 17 18 19 20 21 22 23 24 25 26 27 28 29 30 31 32 33 34 35 36 37 38 39 40 41 42 43 44 45 46 47 48 49 50 51 52 53 54 55 56 57 58 59
In Table 2 the noticed sounds are classified, where the results are listed based on
each of the nineteen case study sites, so that possible differences caused by the
interviewees’ social/cultural backgrounds can be examined. It is noted that in all the
Tables in this paper, the grey areas indicate where the sounds/variables were
unavailable/inapplicable. For some sound sources, sub-divisions are made in the table,
including bell (bells of church/town hall, bells of clock), music (played on-site in the
open spaces, from nearby stores, from passing car) and traffic (car passing, bus
passing and vehicle parking). It can be seen that in most squares the noticed sounds were people’s speaking and traffic. The sound of footsteps was often noticed in
squares located in city centres. Other commonly noticed sounds included water (site 1, 7, 12, 14, 18, 19), bird (site 9, 11, 15, 19), and children’s shouting (site 3-6, 8, 9, 14,
15, 19). For the case study sites in Sheffield and China, all the sounds listed in Table 2
were evaluated in terms of the sound preference even they were not heard during the
interview, whereas in other sites only noticed/heard sounds were evaluated. For the
subjective evaluation of sound preference, a 3-point scale was used, namely -1:
favourable, 0: neither favourable nor annoying, and 1: annoying. In a pilot study, a
5-point scale was also used, from -2 to 2, but it was found that some interviewees
were not sure about the differences between -2 and -1, as well as between 1 and 2.
2.2 Laboratory experiment
1 2 3 4 5 6 7 8 9 10 11 12 13 14 15 16 17 18 19 20 21 22 23 24 25 26 27 28 29 30 31 32 33 34 35 36 37 38 39 40 41 42 43 44 45 46 47 48 49 50 51 52 53 54 55 56 57 58 59
on the sound preference in depth, under controlled conditions. The experimental study
was designed in three stages, with 56 participants in total. In stage one nine sounds similar to the field studies were listed to inquire the participants’ sound preferences,
without actually playing back the sounds. In stage two, six sounds related to the
noticed sounds in the case study sites were played back through headphones to the
participants, and the evaluations of the sound preference, tranquillity, comfort and
pleasantness were made. In stage three, five video recordings with sound relating to
the case study sites were presented, examining the aural/visual interactions. It should
be noted that in the laboratory experiments the social/demographical profiles of the
subjects, considering age, gender, occupation and education level, were less
representative than those in the field studies and also, the types of sound were less. As
a result, direct comparison between field studies and laboratory results has not been
always feasible. In Table 3 the studied sounds in the laboratory experiments are
shown, where Lab01, 02 and 03 refer to the three stages respectively.
3. Influence of social/demographical factors on the sound preference
The influence of age, gender, occupation, education level and residence status on
the sound preference has been analysed using SPSS [37] in terms of the
Pearson/Spearman correlation and Independent t-test wherever appropriate. Again, it
is noted that such analyses have been carried out based on individual sites, so that
1 2 3 4 5 6 7 8 9 10 11 12 13 14 15 16 17 18 19 20 21 22 23 24 25 26 27 28 29 30 31 32 33 34 35 36 37 38 39 40 41 42 43 44 45 46 47 48 49 50 51 52 53 54 55 56 57 58 59
social/demographical factors on natural sounds (bird, water, insect), human sounds (speaking, footsteps and children’s shouting) and mechanical sounds (car passing, bus
passing, vehicle parking, and construction) are shown, respectively. The instrumental
sounds are not included since there were barely church bells in the Chinese sites, and
the music types played in the Chinese sites were rather different from those in the
European sites. This, in a way, shows the importance of considering cultural
differences in studying sound preferences. For the laboratory experiments, since the
sound evaluation in stage three was only made for combined sounds and it was not
directly comparable to the results of field studies, only results in stage one and two are
included, as Lab01 and Lab02 in Table 4-6. Table 7 summarises the percentage of the
sites with significant influences, for all sound types. It is noted that in this paper,
marks * and ** indicate significant difference or correlation, with * representing
p<=0.05 and ** representing p<=0.01.
3.1 Age
In Table 4 and 7 it can be seen that for two natural sounds, namely bird and
insect sounds, age has a rather strong influence on the sound preference, as six out of
eleven, and three out of eight studied cases having statistically significant correlations,
respectively. With the increase of age, the sound preference for bird and insect sounds
also increases, reflected by the negative correlation coefficients in most of the
1 2 3 4 5 6 7 8 9 10 11 12 13 14 15 16 17 18 19 20 21 22 23 24 25 26 27 28 29 30 31 32 33 34 35 36 37 38 39 40 41 42 43 44 45 46 47 48 49 50 51 52 53 54 55 56 57 58 59
two for bird sound and one for insect sound, but the coefficients are small and
statistically insignificant. It is interesting to note that for another type of natural sound,
water, only one out of ten studied cases show statistically significant correlations
between age and the sound preference evaluation. In other words, age has less
influence on the sound preference of water, perhaps because water plays a particular
role in urban soundscape and it is enjoyed by all ages [38] – the average sound
preference score for water, considering of all age groups, is -0.45 in this study.
The influence of age on the sound preference of two human sounds, namely
speaking and footsteps, is generally less compared with that for natural sounds
including bird and insect sounds, as can be seen by comparing Table 4 and 5.
However, it is interesting to note that the subjective evaluations of these two sounds
are more varied among cities, suggesting the possible effects of cultural factors. It is noted, however, for children’s shouting, age has a relatively strong influence on the
sound preference, as seven out of fifteen studied case having statistically significant
correlations, and these sites are distributed in different cities and countries.
For mechanical sounds including car passing, bus passing, vehicle parking and
construction, the influence of age on the sound preference is also relatively low, as
can be seen in Table 6 and 7. In Table 6 it is interesting to note that the correlation
coefficients for the sound of vehicle parking are all positive except one site (site 16,
Beijing Xi Dan Square), but with a small and statistically insignificant correlation
coefficient, suggesting that with the increase of age, people may become slightly more
1 2 3 4 5 6 7 8 9 10 11 12 13 14 15 16 17 18 19 20 21 22 23 24 25 26 27 28 29 30 31 32 33 34 35 36 37 38 39 40 41 42 43 44 45 46 47 48 49 50 51 52 53 54 55 56 57 58 59
correlation is only found in one site, namely site 14 (Sheffield Peace Gardens),
indicating that age barely influences the preference of this sound. A possible reason
for the significant correlation in the Peace Gardens was that the construction
work/noise during the interviews was related to the change of the site, which was
more objected by older people.
Whilst in this study some correlations between age and sound preference have
been found depending on different types of sound, previous studies in terms of noise
annoyance suggested varied results regarding the effect of age [29, 39-41].
3.2 Education level
In Table 7 it can be seen that compared to age, education level is a more
significant influencing social/demographical factor on the sound preference and the
influence varies with different sounds. The influence of education level on the sound
preference evaluation is generally more significant for mechanical sounds compared
to natural and human sounds. It can be explained that mechanical sounds are usually
related to the sensation of noise, and it has been found in a parallel study that
education level is the most influencing factor on the sound level evaluation compared
to other social/demographical factors [29]. Other studies also showed that people with
a higher education level could be slightly more annoyed by noise [41-42], although
some researchers argued that education had no significant effect on the noise
1 2 3 4 5 6 7 8 9 10 11 12 13 14 15 16 17 18 19 20 21 22 23 24 25 26 27 28 29 30 31 32 33 34 35 36 37 38 39 40 41 42 43 44 45 46 47 48 49 50 51 52 53 54 55 56 57 58 59
mechanical sounds, the correlation coefficients are positive, indicating that people
with a higher education level are more annoyed by mechanical sounds. For the small
number of negative coefficients the correlations are generally low and not at a
significant level, although it is noted that most case study sites with a negative
correlation are in Greece, perhaps suggesting the relatively weak influence of
education level on the sound preference evaluation there. For natural sounds,
conversely, the correlation coefficients are predominately negative, suggesting that
with the increase of education level people tend to prefer natural sounds more. For
human sounds, there are mixed positive and negative correlation coefficients, and it
seems that there is no clear tendency in terms of the distribution of cities and
countries.
3.3 Gender, occupation, and residential status
In Table 7, it is found that the influence of gender on the sound preference
evaluation is limited for all studied sounds except the sound of bird, as seven out of
eleven studied cases have a significant difference between the sound preference
evaluation of males and females. However, from Table 4 it is noted that the
differences contain both positive and negative values, suggesting there is no
consistent tendency. A possible reason for this might be cultural differences, as the
negative values are from the Sheffield sites as well as the laboratory experiments in
1 2 3 4 5 6 7 8 9 10 11 12 13 14 15 16 17 18 19 20 21 22 23 24 25 26 27 28 29 30 31 32 33 34 35 36 37 38 39 40 41 42 43 44 45 46 47 48 49 50 51 52 53 54 55 56 57 58 59
words, females in Sheffield preferred bird sounds less than males, whereas females in
Shanghai preferred bird sounds more than males. For other sounds there are also
mixed positive and negative values in terms of the differences between genders. The differences between genders have also been examined in other studies. Mehrabian’s
research indicated that, in general, women are slightly more sensitive to a sound than
men [45], whereas some other studies seem to suggest that the effect of gender on
noise annoyance is not important [13-14, 41, 43].
Similar to gender, occupation also has little influence on the sound preference. In
Table 7 it can be seen that the percentage of the studied cases where significant
correlations exist is very low, all below 40%. From Table 4-6 it is seen that the
correlation coefficients are mixed with positive and negative values.
The influence of residence status on the sound preference evaluation is generally
also not strong, as can be seen in Table 7. Fig. 1 shows the mean difference between
local and non-local residents in terms of the sound preference evaluation, considering
all studied cases. It is interesting to note that from natural sounds to mechanical
sounds, the mean difference between local and non-local residents becomes higher;
suggesting that non-local people are generally more annoyed by mechanical sounds in
urban squares, especially construction sounds.
4. Influence of physical, behavioural and psychological factors on the sound
1 2 3 4 5 6 7 8 9 10 11 12 13 14 15 16 17 18 19 20 21 22 23 24 25 26 27 28 29 30 31 32 33 34 35 36 37 38 39 40 41 42 43 44 45 46 47 48 49 50 51 52 53 54 55 56 57 58 59
Based on the statistical analyses of each case study site, this section examines
the influence on the sound preference evaluation from physical, behavioural and
psychological factors, including season, time of day, frequency of coming to the site,
reason for coming to the site, and the site preference. Some other behavioural factors,
such as wearing earphones, reading/writing, and moving activities, are considered to
be less relevant to the sound preference evaluation and thus not included in the
analysis, although in the sound level evaluation their influences have been studied
[29]. Corresponding to Section 3, ten individual sounds ranging from natural to
mechanical sounds are examined. In Table 8 the effects of season and time of day are
shown, and in Table 9 the effects of frequency of coming to the site, reason for
coming to the site and the site preference are demonstrated. Table 10 summarises the
percentages of the sites with significant influences.
For the Chinese sites, since the surveys were carried out in summer only, the
effect of season is not examined. In Shanghai Nanjing Road Square (site 18) all the
surveys were carried out in midday and thus, the effect of time of day is not examined
for that site. From Table 8 it can be seen that for natural sounds, the effects of season
and time of day on the sound preference are generally trivial as a significance level
only shows in three studied sites, and only for two sounds. For water sound, season
has a significant influence on the sound preference in two out of five studied sites,
namely site 7 (Milan IV Novembre) and site 12 (Cambridge Silver Street), and for
bird sound preference, time of day only has a significant influence in site 9 (Fribourg
1 2 3 4 5 6 7 8 9 10 11 12 13 14 15 16 17 18 19 20 21 22 23 24 25 26 27 28 29 30 31 32 33 34 35 36 37 38 39 40 41 42 43 44 45 46 47 48 49 50 51 52 53 54 55 56 57 58 59
For human and mechanical sounds, the effects of season and time of day are
relatively higher compared to that for natural sounds, although the number/percentage
of the case study sites with a significant level is still rather low, generally less than
30%, as can also be seen in Table 10, except for speaking, footsteps and vehicle
parking, where the percentage is 46.2%, 37.5% and 50%, respectively, in terms of the
season effect. The effects of season and time of day on the noise annoyance have also
been indicated in other studies [46-48]. It is interesting to note that in three Greek case
study sites, including Athens Seashore Square (site 4), Thessaloniki Kritis Square (site
5), and especially, Thessaloniki Makedonomahon Square (site 6), the effect of season
and time of day is considerably greater than that of other sites, suggesting the
importance of considering cultural and climate conditions.
In Table 9 only noticed sounds in the case study sites are included, since
unnoticed sounds are considered less relevant to these behavioural/psychological
factors for the studied sites. Between frequency of coming to the site and the sound
preference, the correlation is not significant for natural sounds, but for human and
mechanical sounds, significant correlations exist in a small percentage of the sites, as
shown in Table 10, except for construction, but for which only three sites are
analysed.
The effect of the site preference on the sound preference is insignificant for
natural sounds, although only a small number of sites are considered. Conversely, for some human or mechanical sounds, especially children’s shouting, car and bus
1 2 3 4 5 6 7 8 9 10 11 12 13 14 15 16 17 18 19 20 21 22 23 24 25 26 27 28 29 30 31 32 33 34 35 36 37 38 39 40 41 42 43 44 45 46 47 48 49 50 51 52 53 54 55 56 57 58 59
percentage of sites, at 42-100%, as shown in Table 10. A possible reason is that those
sounds are distinguishable sounds on the sites, as keynotes or soundmarks and also, some sounds are rather loud, such as children’s shouting.
While the influence of frequency of coming to the site and the site preference are
generally insignificant on the sound preference, between the reason for coming to the
site and the sound preference evaluation the correlations are even less significant,
except for insect sound and construction sound, although the results of these two
sounds are only based on two to three case study sites.
5. Influence of home sound environment on the sound preference
Long-term acoustic experience has been found to be an important factor in
influencing the sound level evaluation in urban open spaces [29]. It has been also
found that long-term changes in noise exposure are important for general noise
evaluation [48-50]. In the five Chinese case study sites a question was asked about the
sounds usually heard at home. The difference in the sound preference of a given
sound between people having or not having the sound at home is then examined
through Independent t-tests for each case study site, and the results are shown in Table
11. It is noted that whilst five sound types, namely bird, insect, speaking, traffic and
music, were included for the home environment, for the fields surveys more detailed
classifications were made, including three types of traffic sounds and three types of
1 2 3 4 5 6 7 8 9 10 11 12 13 14 15 16 17 18 19 20 21 22 23 24 25 26 27 28 29 30 31 32 33 34 35 36 37 38 39 40 41 42 43 44 45 46 47 48 49 50 51 52 53 54 55 56 57 58 59
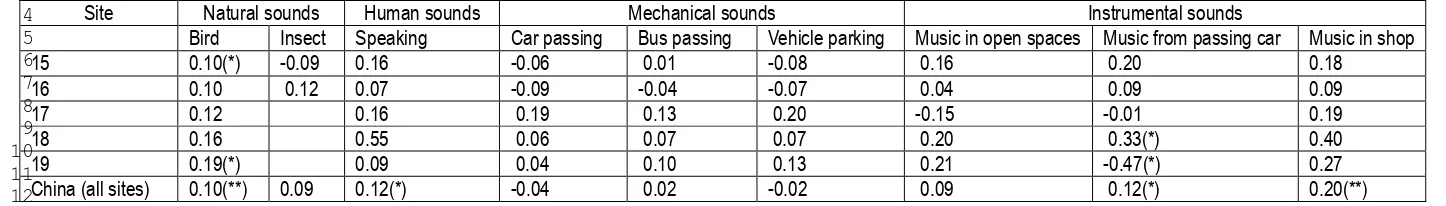
In Table 11 it can be seen that the differences between the two groups of people are
insignificant for most of the sounds, in most of the case study sites, except for bird
sounds and music from passing car, for which three out of six study cases show
significant differences. In other words, the sounds heard at home generally do not
affect the sound preference in urban open spaces significantly. A possible reason is
that some sounds, such as traffic, are rather common, so that the experience at home is
less important in terms of the sound preference. For bird sound, it is interesting to
note in Table 11 that the mean differences are all positive, suggesting that those
people who hear bird sounds often at home may tend to prefer bird sounds in urban
open spaces too.
6. Relationships between social/demographical and physical/behavioural/psychological
factors
Whilst the influence of various social, demographical, physical, behavioural and
psychological factors on the sound preference has been analysed above, the
relationships between those factors are examined in this section, since the influence of
certain factors may be affected by their relationships with other factors. Although
some relationships are commonly recognised, for example, it is normally expected
that how often one comes to a site should correlate to whether he/she is a local
resident, it is still useful to systematically examine such relationships, given that the
1 2 3 4 5 6 7 8 9 10 11 12 13 14 15 16 17 18 19 20 21 22 23 24 25 26 27 28 29 30 31 32 33 34 35 36 37 38 39 40 41 42 43 44 45 46 47 48 49 50 51 52 53 54 55 56 57 58 59
relationships between social/demographical and physical/behavioural/psychological
factors are shown, where it is noted that the reason for coming to the site is not
included due to its weak influence on the sound preference evaluation, as can be seen
in Table 8 and 9. Corresponding to Table 12, Table 13 summarises the percentages of
the sites with significant influences.
It can be seen from Table 12 and 13 that age generally has strong correlations
with physical/behavioural/psychological factors, in 55.6% of the sites in terms of time
of day, 47.4% of the sites in terms of frequency of coming to the site, and 50.0% of
the sites in terms of the site preference. It is also shown that occupation is more
related with frequency of coming to the site, education level is highly related with the
site preference, and the residence status is closely related to frequency of coming to
the site. Conversely, the influence of gender is rather weak. By comparing various
physical/behavioural/psychological factors, it is seen that the frequency of coming to
the site and the site preference are most related to various social/demographical
factors, whereas season is the least related.
Table 14 summarises the relationships among the sound preference,
social/demographical factors, and physical/behavioural/psychological factors. It can
be seen that simultaneous effects between social/demographical and
physical/behavioural/psychological factors may exist in over 50% of the cases where
significant influences of physical/behavioural/psychological factors have been found.
For the frequency of coming to the site and the site preference such simultaneous
1 2 3 4 5 6 7 8 9 10 11 12 13 14 15 16 17 18 19 20 21 22 23 24 25 26 27 28 29 30 31 32 33 34 35 36 37 38 39 40 41 42 43 44 45 46 47 48 49 50 51 52 53 54 55 56 57 58 59
mechanical sounds the simultaneous effects are greater. It is interesting to note that
the simultaneous effect in site 6 (Thessaloniki Makedonomahon Square) is
considerably higher than that of other case study site.
7. Conclusions
In this paper the influence of social, demographical, physical, behavioural and
psychological factors on the sound preference evaluation has been investigated based
on nineteen case study sites in Europe and China. The statistical analyses have been
made for each case study site, allowing the examination of possible influence of
cultural and geographical factors, by comparing different sites. In terms of
social/demographical factors, the results suggest that age and education level are two
factors which generally influence the sound preference significantly, although the
influence may vary with different types of urban open spaces and sounds. It is
interesting to note that with increasing age or education level, people tend to prefer
natural sounds and are more annoyed by mechanical sounds although there are certain
cultural differences. It has also been found that gender, occupation and residence
status generally would not influence the sound preference evaluation significantly
although gender has a rather strong influence for certain sound types such as bird
sounds. In terms of physical, behavioural, and psychological factors, generally
1 2 3 4 5 6 7 8 9 10 11 12 13 14 15 16 17 18 19 20 21 22 23 24 25 26 27 28 29 30 31 32 33 34 35 36 37 38 39 40 41 42 43 44 45 46 47 48 49 50 51 52 53 54 55 56 57 58 59
for a limited case study sites and certain sound types. Among these factors, the reason
for coming to the site has been found influencing the sound preference evaluation
least, and the site preference has been found most influencing. The influence of home
sound environment on the sound preference has been found to be generally
insignificant, except for certain sounds. For example, those people who hear bird
sounds often at home may tend to prefer bird sounds in urban open spaces too.
It is noted that there are some correlations between social/demographical and
physical/behavioural/psychological factors. Among those, the frequency of coming to
the site and the site preference are more related to social/demographical factors.
In addition to contributing to a better understanding of influencing factors on the
sound preference in urban open spaces, the results of this study are also important in
determining the input variables for soundscape prediction models, for which the
artificial neural networks techniques are being explored [30-32]. With such models
the simultaneous effects of various factors can also be taken into account.
Acknowledgements
The data in this paper are mainly from two research projects, funded by the
European Commission and the British Academy. The authors are indebted to the
project partners for their permission of using the data, and to Dr. Mei Zhang and Dr.
Wei Yang for useful discussion.
References
1 2 3 4 5 6 7 8 9 10 11 12 13 14 15 16 17 18 19 20 21 22 23 24 25 26 27 28 29 30 31 32 33 34 35 36 37 38 39 40 41 42 43 44 45 46 47 48 49 50 51 52 53 54 55 56 57 58 59
[2] Selle K. Vom ‘sparsamen umgang’ zur ‘vision’ offener räume. Werkbericht Nr. 29
der Arbeitsgruppe Bestandsverbesserung, Hannover und Dortmund, 1992.
[3] Kang J. Urban Sound Environment. London: Taylor & Francis incorporating Spon;
2006.
[4] Brown A.L, Muhar A. An approach to the acoustic design of outdoor space.
Journal of Environmental Planning and Management 2004;47:827-842.
[5] Schafer R.M. The Soundscape: Our Sonic Environment and the Tuning of the
World. Rochester Vt.: Destiny Books; 1994.
[6] Schaudinischky H.L. Sound, Man and Building. London: Applied Science
Publishers; 1976.
[7] Thompson E. The Soundscape of Modernity: Architectural Acoustics and the
Culture of Listening in America, 1900-1933.Cambridge, Mass, London: MIT Press;
2002.
[8] Corbin A. Village Bells: Sound and Meaning in the 19th-century French
Countryside. London: Papermac; 1999.
[9] Truax B. Acoustic Communication (2nd ed.). Norwood N.J.: Ablex Publishing
Corporation; 2000.
[10] Dubois D. Categories as acts of meaning: the case in olfaction and audition.
Cognitive Science Quarterly 2000;1:35-68.
[11] Gaver W. What in the world do we hear? An ecological approach to auditory
event perception. Ecological Psychology 1993;5:1-29.
1 2 3 4 5 6 7 8 9 10 11 12 13 14 15 16 17 18 19 20 21 22 23 24 25 26 27 28 29 30 31 32 33 34 35 36 37 38 39 40 41 42 43 44 45 46 47 48 49 50 51 52 53 54 55 56 57 58 59
soundscape: Using verbal data to access everyday life auditory categories. Acta
Acustica united with Acustica 2006;92:945-951.
[13] Yang W, Kang J. Soundscape and sound preferences in urban squares. Journal of
Urban Design 2005;10:69-88.
[14] Yang W, Kang J. Acoustic comfort evaluation in urban open public spaces.
Applied Acoustics 2005;66:211–29.
[15] Berglund B, Lindvall T, Schwela D.H. Guidelines for Community Noise. World
Health Organization Report, 1999.
[16] Schulte-Fortkamp B. The meaning of annoyance in relation to the quality of
acoustic environments. Noise and Health 2002;4:13-18.
[17] Schultz T.J. Community Noise Rating. London: Applied Science Publishers;
1982.
[18] Schultz T.J. Synthesis of social surveys on noise annoyance. J. Acoust. Soc. Am.
1978;64:377–405.
[19] Botteldooren D, Verkeyn A. Fuzzy models for accumulation of reported
community noise annoyance from combined sources. J. Acoust. Soc. Am.
2002;112:1496–508.
[20] Job R.S.F. Community response to noise: A review of factors influencing the
relationship between noise exposure and reaction. J. Acoust. Soc. Am.
1988;83:991-1001.
[21] Guastavino C. The ideal urban soundscape: investigating the sound quality of
1 2 3 4 5 6 7 8 9 10 11 12 13 14 15 16 17 18 19 20 21 22 23 24 25 26 27 28 29 30 31 32 33 34 35 36 37 38 39 40 41 42 43 44 45 46 47 48 49 50 51 52 53 54 55 56 57 58 59
[22] Lavandier C. The contribution of sound source characteristics in the assessment
of urban soundscapes. Acta Acustica united with Acustica 2006;92:912-921.
[23] Westerkamp H. Sound excursion: plano pilato, Brasilia. Soundscape: The Journal
of Acoustic Ecology 2000;1:20–1.
[24] Southworth M. The sonic environment of cities. Environment and Behaviour
1969;1:49-70.
[25] Berglund B, Eriksen C.A, Nilsson M.E. Exploring the perceptual content in
soundscapes. In: Sommerfeld E, Kompass R, & Lachmann T. (eds.) Fechner Day.
Lengerich: Pabst Science Publishers; 2001.
[26] Sémidor C. Listening to a city with the soundwalk method. Acta Acustica united
with Acustica 2006;92:959-964.
[27] Robert G. Environmental Psychology: Principles and Practice (2nd ed.).Boston:
Allyn and Bacon; 1997.
[28] Bell A.P, Greene C.T, Fisher D.J, Baum A. Environmental Psychology (4th ed.).
Fort Worth: Harcourt Brace College Publishers; 1996.
[29] Yu L, Kang J. Effects of social, demographical and behavioral factors on the
sound level evaluation in urban open spaces. J. Acoust. Soc. Am. 2008;123:772-783.
[30] Yu L, Kang J. Soundscape evaluation in city open spaces using artificial neural
network. In: UIA 2005 – XXII World Congress of Architecture, Istanbul, Turkey.
[31] Yu L, Kang J. Neural network analysis of soundscape in urban open spaces. In:
Proceedings of the 149th Meeting of the Acoustical Society of America, 2005,
1 2 3 4 5 6 7 8 9 10 11 12 13 14 15 16 17 18 19 20 21 22 23 24 25 26 27 28 29 30 31 32 33 34 35 36 37 38 39 40 41 42 43 44 45 46 47 48 49 50 51 52 53 54 55 56 57 58 59
[32] Yu L, Kang J. Integration of social/demographic factors into the soundscape
evaluation of urban open spaces using artificial neural networks. In: Proceedings of Internoise’06, Honolulu, USA.
[33] Patterson D.W. Artificial Neural Networks: Theory and Application. London:
Prentice-Hall; 1996.
[34] Vallet M, Vernet I, Champelovier P, Maurin M. A road traffic noise index for the
night time. In: Proceedings of Internoise’96, Liverpool, UK.
[35] Griffith M.J, Howarth H.V.C. Subjective response to combined noise and
vibration: summation and interaction effects. J. Sound Vib. 1990;143:443-54.
[36] Borg W.R. Educational Research: An Introduction (5th ed.). New York; London:
Longman; 1979.
[37] Pallant J. SPSS Survival Manual (2nd ed.). Maidenhead: Open University Press;
2005.
[38] Sémidor C, Venot-Gbedji F. Fountains as a natural component of urban
soundscape. J. Acoust. Soc. Am. 2008;123:3395.
[39] Taylor S.M. A path model of aircraft noise annoyance. J. Sound Vib.
1984;96:243-60.
[40] Weinstein N.D. Individual differences in reactions to noise: a longitudinal study
in a college dormitory. Journal of Applied Psychology 1978;63:458-66.
[41] Miedema H.M.E, Vos H. Demographic and attitudinal factors that modify
annoyance from transportation noise. J. Acoust. Soc. Am. 1999;105:3336–44.
1 2 3 4 5 6 7 8 9 10 11 12 13 14 15 16 17 18 19 20 21 22 23 24 25 26 27 28 29 30 31 32 33 34 35 36 37 38 39 40 41 42 43 44 45 46 47 48 49 50 51 52 53 54 55 56 57 58 59
noises on man. J. Acoust. Soc. Am. 1999;105:942.
[43] Fields J.M. Effect of personal and situational variables on noise annoyance in
residential areas. J. Acoust. Soc. of Am. 1993;93:2753–63.
[44] Tonin R. A method of strategic traffic noise impact analysis. In: Proceedings of
Internoise’ 96, Liverpool, UK.
[45] Mehrabian A. Public Places and Private Spaces – The Psychology of Work, Play,
and Living Environments. New York: Basic Books Inc. Publisher; 1976.
[46] Griffiths I.D, Langdon F.J, Swan M.A. Subjective effects of traffic noise
exposure: reliability and seasonal effects. J. Sound Vib. 1980;71:227–40.
[47] Recuero M, Blanco-Martin E, Grundman J. Study of the acoustical environment
of a city. In: Proceedings of Internoise’96, Liverpool, UK.
[48] Vallet M. Annoyance after changes in airport noise environment. In: Proceedings
of Internoise’ 96, Liverpool, UK.
[49] Fields J.M, Dejong R.G, Brown A.L, Flindell I.H, Gjestland T, Job R.F.S,
Kurra S, Lercher P, Schumer-Kohrs A, Vallet M, Yano T. Guidelines for reporting core
information from community noise reaction surveys. J. Sound Vib. 1997;206:685–95.
[50] Fidell S, Silvati L, Pearsons K. Noticeability of a decrease in aircraft noise.
1 2 3 4 5 6 7 8 9 10 11 12 13 14 15 16 17 18 19 20 21 22 23 24 25 26 27 28 29 30 31 32 33 34 35 36 37 38 39 40 41 42 43 44 45 46 47 48 49 50 51 52 53 54 55 56 57 58 59
List of Figure legends
Fig. 1. Mean difference between local and non-local residents in terms of the sound
1 2 3 4 5 6 7 8 9 10 11 12 13 14 15 16 17 18 19 20 21 22 23 24 25 26 27 28 29 30 31 32 33 34 35 36 37 38 39 40 41 42 43 44 45 46 47 48 49 50 51 52 53 54 55 56 57 58 59 -0.2 -0.15 -0.1 -0.05 0 0.05 0.1 0.15 0.2 Bi rd W a te r In s e c t Sp e a k in g F o o ts te p s C h ild e rn 's s h o u ti n g C a r p a s s in g Bu s p a s s in g Ve h ic le p a rk in g C o n s tru c ti o n
Type of sound
[image:30.595.93.451.71.411.2]M e a n d if fe re n c e i n s o u n d p re fe re n c e e v a lu a ti o n
Fig. 1. Mean difference between local and non-local residents in terms of the sound
1 2 3 4 5 6 7 8 9 10 11 12 13 14 15 16 17 18 19 20 21 22 23 24 25 26 27 28 29 30 31 32 33 34 35 36 37 38 39 40 41 42 43
Table 1
Factors studied and their categorisations and scales Factors Categorisation and scale
Season 1- winter; 2- autumn; 3- spring; 4- summer
Time of day 1- morning: 9.00am-11.59pm; 2- midday: 12.00-14.59pm; 3- afternoon:15.00-17.59pm; 4- evening:18.00-20.59pm; 5- night: 21.00pm-8.59am Frequency of coming to the site Scale 1-5: 1=first time; 5=every day
Reason for coming to the site 1- equipment/services of the site; 2- children playing and private meetings; 3- business/meeting/break; 4- attending social events; 5- passing by Age 1: <12; 2: 12~17; 3: 18~24; 4: 25-34; 5: 35-44; 6: 45-54; 7: 55-64; 8: >65
Gender 1- male; 2- female
Occupation 1- students; 2- working people; 3- others (e.g. unemployed and pensioners) Education level 1- primary; 2- secondary; 3- high level
Residential status 0- non local; 1- local
1 2 3 4 5 6 7 8 9 10 11 12 13 14 15 16 17 18 19 20 21 22 23 24 25 26 27 28 29 30 31 32 33 34 35 36 37 38 39 40 41 42 43
Table 2
Noticed sounds (marked by √) in the case study sites
Site
Natural sounds Human sounds Mechanical sounds Instrumental sounds
Bird Water Insec
t
Speak
in
g
Foots
tep
C
hi
ld
ren
’s
shouti
ng
Traf
fic
C
ons
truct
io
n
Mus
ic
Bel
l
Car Bus Parking In open space From stores From passing car Church Clock
1 Bahnhofsplatz √ √ √ √ √ √
2 Florentiner √ √ √ √
3 Karaiskaki √ √ √ √
4 Seashore √ √ √ √
5 Kritis √ √ √ √ √
6 Makedonomahon √ √ √ √
7 IV Novembre √ √ √ √
8 Piazza Petazzi √ √ √ √
9 Jardin de Perolles √ √ √ √
10 Place de la Gare √ √ √ √
11 All Saint's Garden √ √ √ √ √ √
12 Silver Street √ √ √ √ √
13 Barkers Pool √ √ √ √ √ √ √ √
14 Peace Gardens √ √ √ √ √ √ √ √ √ √
15 Chang Chun Yuan Square √ √ √ √ √ √
16 Xi Dang Square √ √ √ √ √ √ √
17 Century Square √ √ √ √
18 Nanjing Road Square √ √ √ √ √ √ √ √
1 2 3 4 5 6 7 8 9 10 11 12 13 14 15 16 17 18 19 20 21 22 23 24 25 26 27 28 29 30 31 32 33 34 35 36 37 38 39 40 41 42 43
Table3
Sounds presented (marked by √) in the laboratory experiments
Stage
Single sounds
Combined sounds
Natural sounds Human sounds Mechanical sounds Instrumental sounds
Bird Wate
r fa
ll
Insect Speak
ing
Children’
s
shouting Skateboar
d
Car &
Bus
pas
sing
Traf
fic
Construction Mus
ic in
op
en
space Bells o
f
church/clock Traf
fic +
Bird
Sp
eak
ing
+
Be
ll
Fountain + Mus
ic
Fountain + Children’
s
shouting Fountain + Construction
Lab01 √ √ √ √ √ √ √ √ √
Lab02 √ √ √ √ √ √
1 2 3 4 5 6 7 8 9 10 11 12 13 14 15 16 17 18 19 20 21 22 23 24 25 26 27 28 29 30 31 32 33 34 35 36 37 38 39 40 41 42 43
Table 4
Correlation coefficients between the sound preference evaluation of the studied natural sounds and age, occupation and education level; as well as mean differences between males and females, non-local and local residents, and students and working people (laboratory only). Marks * and ** indicate
significant differences or correlations, with * representing p<=0.05 and ** representing p<=0.01. The results for site 2-6 and 8 are not included since all
data are unavailable
Bird Water Insect
Age Gender Occ
upati
on
Educ
ati
on
R
es
id
en
ce
Age Gender Occ
upati
on
Educ
ati
on
R
es
id
en
ce
Age Gender Occ
upati
on
Educ
ati
on
R
es
id
en
ce
Site1 - 0.13 0.12 - 0.18(*) 0.01 0.04
Site7 - 0.04 - 0.02 - 0.05 0.06 0.05
Site9 - 0.22(**) 0.03 - 0.07(*) - 0.08(*) 0.01 Site10
Site11 0.05 0.18(*) - 0.13 - 0.26(**) 0.14
Site12 0.00 - 0.03 - 0.09 0.01 0.02
Site13 - 0.03 - 0.29(*) - 0.12(**) - 0.15(**) 0.13 - 0.02 0.24 - 0.15(*) - 0.01 0.04 - 0.03 - 0.35(**) - 0.14(**) - 0.14(**) 0.02 Site14 0.06 - 0.45(**) - 0.19(**) - 0.01 - 0.18 0.10 - 0.40(**) -0.12(*) - 0.14(*) - 0.09 0.07 - 0.45(**) - 0.20(**) - 0.02 0.04 Site15 - 0.13(*) 0.00 0.05 0.03 - 0.09 0.01 0.00 - 0.00 - 0.06 - 0.06 - 0.23(**) 0.02 0.03 0.01 - 0.16(*) Site16 - 0.15(**) - 0.03 0.05 - 0.13(*) 0.13(*) - 0.00 - 0.02 - 0.03 - 0.06 0.07 - 0.16(**) - 0.07 - 0.02 - 0.05 0.19(*) Site17 - 0.27(*) 0.31(*) - 0.33(*) - 0.29(**) - 0.18 - 0.32(**) 0.21 - 0.29(*) - 0.52(**) - 0.14 - 0.37(**) 0.26 - 0.32(*) - 0.34(**) - 0.06 Site18 - 0.10 0.22(*) - 0.11 - 0.15 - 0.12 0.06 0.10 0.01 - 0.01 0.03 - 0.19 0.02 0.09 - 0.20 0.04 Site19 - 0.14 0.09 - 0.17 - 0.14 - 0.10 - 0.11 0.18(*) 0.12 - 0.22 - 0.12 - 0.17 0.18 0.12 - 0.06 - 0.04
Lab01 - 0.31(*) - 0.26(*) - 0.76 - 0.31(**) - 0.21 - 0.06 0.21 - 0.18
1 2 3 4 5 6 7 8 9 10 11 12 13 14 15 16 17 18 19 20 21 22 23 24 25 26 27 28 29 30 31 32 33 34 35 36 37 38 39 40 41 42 43
Table 5
Correlation coefficients between the sound preference evaluation of the studied human sounds and age, occupation and education level; as well as mean differences between males and females, non-local and local residents, and students and working people (laboratory only)
Speaking Footsteps Children’s shouting
Age Gender Occ
upati
on
Educ
ati
on
R
es
iden
ce
Age Gender Occ
upati
on
Educ
ati
on
R
es
id
en
ce
Age Gender Occ
upati
on
Educ
ati
on
R
es
id
en
ce
Site1 0.01 - 0.08 0.07 - 0.01 0.03 0.01 - 0.03 - 0.05 - 0.21 0.22 Site2 - 0.10 - 0.06 - 0.05 - 0.11 0.11 - 0.01 - 0.12 0.04 - 0.17 0.03
Site3 - 0.18(**) - 0.08(*) - 0.09(*) 0.04 - 0.03 - 0.09(*) - 0.04 - 0.04 0.04 - 0.05 - 0.28(**) - 0.17(*) - 0.14(**) 0.08 0.04 Site4 - 0.05 - 0.02 - 0.01 0.08(*) 0.05 - 0.02 - 0.06(*) - 0.02 0.01 0.05 - 0.09(*) 0.06 - 0.08(*) 0.05 0.02 Site5 0.11 0.18 0.11 - 0.21(**) 0.33(*) - 0.01 - 0.10 - 0.01 0.12(**) - 0.19(*)
Site6 0.07(*) - 0.04 0.08(*) - 0.12(**) - 0.04
Site7 - 0.08(*) 0.06 - 0.03 0.01 0.10(*)
Site8 0.08 0.05 0.11(**) - 0.10(*) 0.07 - 0.20(**) 0.24(**) - 0.19(**) 0.03 0.07 Site9 - 0.06 0.04 0.01 - 0.09(*) - 0.01 - 0.20(**) 0.06 - 0.16(**) - 0.17(**) 0.02 Site10 0.09(*) 0.03 0.06 - 0.10(*) 0.04 0.04 - 0.05 0.07(*) - 0.05 - 0.02
Site11 - 0.14(**) 0.00 - 0.19(**) - 0.00 0.00
Site12 0.03 - 0.19(**) 0.12(*) - 0.09 - 0.03 - 0.38(**) - 0.20 - 0.08 0.44(**) - 0.24
Site13 0.03 - 0.29(*) - 0.06 - 0.00 0.12 - 0.02 - 0.25(*) - 0.12(*) 0.00 - 0.03 0.01 - 0.09 - 0.05 0.00 0.09 Site14 0.14(**) - 0.29 - 0.02 - 0.05 0.01 - 0.10(*) - 0.44(*) 0.01 0.18(**) - 0.07 0.11(*) - 0.25(*) - 0.08 0.01 - 0.03 Site15 - 0.09 - 0.03 0.11 0.13(*) 0.02 - 0.09 - 0.04 0.14(*) 0.11(*) - 0.05 - 0.01 0.03 0.00 0.09 0.06 Site16 - 0.12(*) - 0.12 - 0.11 0.00 0.14 - 0.05 - 0.07 - 0.00 - 0.03 0.11 - 0.21(**) - 0.09 - 0.06 - 0.02 0.23(**) Site17 0.21 - 0.12 0.02 0.04 0.04 0.07 - 0.05 0.06 - 0.16 - 0.12 0.03 0.07 - 0.04 - 0.26 - 0.17 Site18 - 0.02 0.14 0.16 0.26(*) - 0.34(**) 0.19 0.18 0.26(*) 0.33(**) 0.00 - 0.22 - 0.20 - 0.17 - 0.16 0.30 Site19 0.06 0.04 - 0.03 0.34(**) 0.10 0.07 - 0.17 0.11 0.24(*) 0.14 - 0.11 - 0.05 - 0.08 0.12 - 0.25
Lab01 - 0.03 0.16 0.24 0.04 - 0.24 - 0.07 0.02 - 0.19
1 2 3 4 5 6 7 8 9 10 11 12 13 14 15 16 17 18 19 20 21 22 23 24 25 26 27 28 29 30 31 32 33 34 35 36 37 38 39 40 41 42 43 Table 6
Correlation coefficients between the sound preference evaluation of the studied mechanical sounds and age, occupation and education level; as well as mean differences between males and females, non-local and local residents, and students and working people (laboratory only)
Car passing Bus passing Vehicle parking Construction
Ag e Gen de r Oc cup at ion Ed ucat ion R esi de nce Ag e Gen de r Oc cup at ion Ed ucat ion R esi de nce Ag e Gen de r Oc cup at ion Ed ucat ion R esi de nce Ag e Gen de r Oc cup at ion Ed ucat ion R esi de nce
Site1 - 0.03 - 0.08 0.03 0.16(**) - 0.05 0.07 - 0.11 0.09 0.12 - 0.14 Site2 - 0.09 - 0.13(*) - 0.02 0.08 0.09
Site3 0.11(*) - 0.01 0.04 - 0.07 - 0.02 Site4 0.05 - 0.09(**) 0.06 - 0.02 0.05
Site5 - 0.05 0.01 0.03 - 0.03 0.23(**) 0.09(*) 0.01 0.02 - 0.04 - 0.01 - 0.05 0.11 0.05 - 0.08(*) 0.34(**)
Site6 - 0.05 0.08(**) 0.01 - 0.07(*) 0.09(**) - 0.06 0.09(**) 0.01 - 0.08(*) 0.15(**) 0.00 0.07(*) 0.01 - 0.09(**) 0.12(**) Site7 - 0.14(**) - 0.03 - 0.13(**) 0.17(**) - 0.04 - 0.11(**) - 0.02 - 0.11(**) 0.17(**) - 0.07
Site8 - 0.01 - 0.04 0.01 - 0.01 0.07 Site9 - 0.09(**) - 0.05 - 0.11(**) 0.12(**) - 0.04
Site10 0.00 - 0.05 - 0.01 0.10(**) 0.01 - 0.11(**) - 0.13(**) - 0.08(**) 0.07(*) - 0.02 Site11 - 0.14(**) - 0.05 - 0.08 0.01 0.18(**) 0.00 0.08 - 0.03 0.15 0.09 Site12 - 0.13(**) 0.16(**) - 0.00 0.13(**) 0.15(**) - 0.07 0.12(*) 0.03 0.17(**) 0.28(**)
Site13 0.13(**) - 0.21(*) 0.02 0.13(**) - 0.06 0.08 - 0.19(*) - 0.02 0.13(**) - 0.06 0.11(**) - 0.21(*) 0.06 0.03 -0.06 0.01 - 0.29(*) - 0.03 0.03 - 0.09 Site14 0.16(**) - 0.27(*) - 0.09 0.11(*) - 0.03 0.13(**) - 0.30(**) - 0.11(*) 0.12(*) 0.01 0.17(**) - 0.20(*) 0.07 0.10(*) -0.04 0.13(*) - 0.11 0.08 - 0.07 - 0.01 Site15 0.04 0.08 0.00 0.21(**) 0.11 0.03 0.01 0.02 0.14(*) - 0.09 0.08 - 0.08 0.11 0.15(*) 0.06 0.08 0.02 - 0.01 0.23(**) 0.13(*) Site16 - 0.11 - 0.01 - 0.09 0.20(**) 0.07 - 0.13(*) 0.04 - 0.08 0.15(**) 0.04 - 0.02 - 0.01 - 0.08 0.13(*) 0.08 - 0.05 0.05 - 0.05 0.15(*) - 0.01 Site17 0.18 - 0.50(**) 0.20 0.28(*) 0.19 0.19 - 0.10 0.17 0.10 0.15 0.18 - 0.20 0.15 0.09 0.21 0.23 - 0.09 0.20 0.09 0.22 Site18 - 0.13 - 0.10 - 0.01 0.30(*) - 0.03 - 0.06 - 0.08 - 0.09 0.04 0.08 0.07 - 0.05 0.10 0.11 -0.01 - 0.02 - 0.06 - 0.05 0.03 0.08 Site19 0.19 0.10 0.18 0.34(**) - 0.09 0.06 0.10 0.01 0.33(**) - 0.03 0.19 0.10 0.02 0.44(**) 0.06 0.06 - 0.08 - 0.12 0.28(**) 0.12
1 2 3 4 5 6 7 8 9 10 11 12 13 14 15 16 17 18 19 20 21 22 23 24 25 26 27 28 29 30 31 32 33 34 35 36 37 38 39 40 41 42 43
Table 7
Percentage (number) of the studied cases where significant correlations or differences exist between sound preference and social/demographical factors
Age Gender Occupation Education Residence
N
atural sound
Bird 54.5% (6/11) 63.6% (7/11) 36.4% (4/11) 63.6% (7/11) 11.1% (1/9)
Water 10.0% (1/10) 20.0% (2/10) 40.0% (4/10) 20.0% (2/10) 0.0% (0/10)
Insect 37.5% (3/8) 25.0% (2/8) 37.5% (3/8) 25.0% (2/8) 28.6% (2/7)
H
uman
sound
Speaking 31.6% (6/19) 15.8% (3/19) 21.1% (4/19) 42.1% (8/19) 16.7% (3/18)
Footsteps 23.1% (3/13) 23.1% (3/13) 30.8% (4/13) 38.5% (5/13) 0.0% (0/13) Children’s shouting 46.7% (7/15) 20.0% (3/15) 33.3% (5/15) 20.0% (3/15) 15.4% (2/13)
Mec
ha
ni
ca
l
sound
1 2 3 4 5 6 7 8 9 10 11 12 13 14 15 16 17 18 19 20 21 22 23 24 25 26 27 28 29 30 31 32 33 34 35 36 37 38 39 40 41 42 43
Table 8
Correlation coefficients between the sound preference evaluation and physical factors including season and time of day
Site Bird Nature sounds Water Insect Speaking Human sounds Footsteps Children’s shouting Car passing Bus passing Vehicle parking Construction Mechanical sounds Season Time Season Time Season Time Season Time Season Time Season Time Season Time Season Time Season Time Season Time 1 0.02 - 0.05 - 0.27(*) - 0.19 - 0.16 - 0.22 - 0.16(**) 0.04 - 0.12 - 0.08
2 - 0.34(**) 0.08 - 0.23(*) - 0.21 0.01 0.01
3 0.03 - 0.02 0.08 - 0.03 0.04 0.01 - 0.10 0.03 4 - 0.17(**) 0.07 0.20(**) - 0.17(**) - 0.06 0.05 - 0.15(**) 0.04
5 0.76(**) - 0.08 0.32(**) - 0.08(*) - 0.06 0.04 0.22(**) - 0.10(*) - 0.05 0.07(*) 6 0.29(**) - 0.10(**) - 0.23(**) 0.09(**) - 0.22(**) 0.09(**) - 0.23(**) 0.10(**) 7 - 0.11(**) 0.04 0.26(**) - 0.01 0.02 - 0.02 - 0.02 0.05
8 0.27(**) - 0.18(**) 0.06 - 0.01 0.02 0.03
9 - 0.02 0.12(**) - 0.07 0.10(*) 0.02 0.14(**) 0.06 0.07(*)
10 0.03 - 0.03 0.05 0.00 0.05 0.01 - 0.02 0.04
11 0.15 0.12 - 0.04 - 0.08 - 0.29(**) - 0.03 - 0.39 - 0.05
12 0.14(**) - 0.11 0.08 0.04 - 0.24(*) 0.10 - 0.07 - 0.09(*) - 0.05 - 0.24(**)
13 0.04 0.04 0.01 0.00 0.04 0.04 - 0.01 - 0.02 0.04 0.04 0.01 0.00 0.03 0.02 0.03 0.02 0.03 0.02 0.00 - 0.00 14 0.06 0.05 0.03 0.03 0.02 0.02 0.02 0.01 0.01 0.01 - 0.01 - 0.02 0.05 0.05 0.05 0.05 0.09(*) 0.08 0.03 0.02 15 0.01 - 0.06 0.05 - 0.00 0.02 0.03 - 0.08 - 0.02 - 0.08 - 0.06 16 0.03 - 0.02 0.03 0.01 0.01 - 0.06 - 0.02 - 0.02 0.08 - 0.03 17 - 0.06 - 0.05 0.00 0.03 0.16 - 0.01 0.14 - 0.03 - 0.02 0.07 18
1 2 3 4 5 6 7 8 9 10 11 12 13 14 15 16 17 18 19 20 21 22 23 24 25 26 27 28 29 30 31 32 33 34 35 36 37 38 39 40 41 42 43 Table 9
Correlation coefficients between the sound preference evaluation and the frequency of coming to the site and the reason for coming to the site; as well as the mean differences in sound preference evaluation between people who like and dislike the site (site preference)
Site
Nature sounds Human sounds Mechanical sounds
Bird Water Insect Speaking Footsteps Children’s shouting Car passing Bus passing Vehicle parking Construction
Fr eq ue ncy Si te p re fe re nce Re aso n Fr eq ue ncy Si te p re fe re nce Re aso n Fr eq ue ncy Re aso n Fr eq ue ncy Si te p re fe re nce Re aso n Fr eq ue ncy Si te p re fe re nce Re aso n Fr eq ue ncy Si te p re fe re nce Re aso n Fr eq ue ncy Si te p re fe re nce Re aso n Fr eq ue ncy Si te p re fe re nce Re aso n Fr eq ue ncy Si te p re fe re nce Re aso n Fr eq ue ncy Si te p re fe re nce Re aso n
1 0.12 0.13 - 0.04 - 0.06 0.16 0.06 - 0.03 0.08 0.10 - 0.02 - 0.09 - 0.06 - 0.10 - 0.16 0.02 2 0.17(*) 0.02 0.04 0.15 0.13 0.00 - 0.06 - 0.24(**) 0.00
3 0.11(*) - 0.05 0.12(**) 0.02 0.02 0.04 - 0.1(**) - 0.02 0.10(*) - 0.01 0.05 0.00 4 - 0.06 0.00 - 0.06 0.09(*) 0.00 - 0.02 - 0.04 - 0.09 0.00 0.00 - 0.07(*) - 0.05
5 0.23(**) 0.31(*) - 0.07 0.00 0.16(**) - 0.07 - 0.08(*) - 0.03 0.13(**) - 0.04 0.04 0.07 - 0.11(**) 0.00 0.10(**) 6 - 0.10(**) 0.26(**) - 0.06 - 0.11(**) - 0.03 - 0.11(**) - 0.10(**) - 0.02 - 0.12(**) - 0.09(**) - 0.07 - 0.14(**) 7 0.07 0.01 0.00 0.11(**) 0.04 - 0.03 0.06 - 0.24(**) 0.04 0.07 - 0.23(**) - 0.01
8 - 0.04 - 0.06 - 0.01 0.01 - 0.06 - 0.02 0.07 - 0.20(**) - 0.09 9 0.04 0.05 - 0.02 0.00 0.01 - 0.02 0.05 0.04 0.01 - 0.04 - 0.12(**) - 0.03
10 0.00 0.04 - 0.06 0.04 0.05 - 0.01 - 0.04 - 0.26(**) 0.07 0.01 - 0.20(**) - 0.05 11 0.18 - 0.10 0.00 - 0.06 0.16(*) - 0.07 0.18(**) - 0.21(**) 0.12(*) 0.21(**) - 0.21(**) 0.28(**) 12 0.07 0.04 0.03 0.06 - 0.10 0.17 0.11 - 0.33(**) 0.11 0.03 - 0.15(**) 0.08 0.08 - 0.09 0.10 13 - 0.02 0.14 - 0.08 0.01 0.16 - 0.03 - 0.05 0.14 - 0.00 - 0.03 0.09 - 0.02
14 0.14(**) 0.57(**) 0.04 0.11(**) 0.54(**) 0.08 0.10(*) 0.36(**) 0.03 0.07 0.31(**) 0.06 0.06 0.33(**) 0.04 0.09(*) 0.28(**) 0.07 0.06 0.28(**) 0.05 15 - 0.10 - 0.04 - 0.03 -0.04 - 0.05 0.03 0.02 0.06 0.03 0.07
16 0.05 -0.17(**) - 0.02 - 0.02 0.02 0.00 - 0.09 0.03 - 0.11 0.00 - 0.02 0.02
17 0.01 - 0.09 - 0.23 - 0.14
18 0.03 - 0.24(*) - 0.15 - 0.06 - 0.04
[image:39.792.17.769.80.379.2]1 2 3 4 5 6 7 8 9 10 11 12 13 14 15 16 17 18 19 20 21 22 23 24 25 26 27 28 29 30 31 32 33 34 35 36 37 38 39 40 41 42 43
Table 10
Percentage (number) of the case study sites where significant correlations or differences exist between sound preference and physical/ behavioural/psychological factors
Sound Season Time of day Frequency of coming to the site Site preference Reason for coming to the site
Natural
Bird 0.0% (0/4) 12.5% (1/8) 0.0% (0/4) 0.0% (0/2) 0.0% (0/3) Water 40.0% (2/5) 0.0% (0/9) 16.7% (1/6) 25.0% (1/4) 0.0% (0/4) Insect 0.0% (0/2) 0.0% (0/6) 0.0% (0/3) 50.0% (1/2)
Human
Speaking 46.2% (6/13) 11.8% (2/17) 33.3% (6/18) 23.1% (3/13) 6.7% (1/15) Footsteps 37.5% (3/8) 8.3% (1/12) 11.1% (1/9) 14.3% (1/7) 0.0% (0/8) Children’s shouting 25.0% (2/8) 25.0% (3/12) 37.5% (3/8) 42.9% (3/7) 14.3% (1/7)
Mechanical
Car passing 28.6% (4/14) 16.7% (3/18) 15.8% (3/19) 64.3% (9/14) 18.8% (3/16) Bus passing 22.2% (2/9) 23.1% (3/13) 14.3% (2/14) 44.4% (4/9) 18.2% (2/11) Vehicle parking 50.0% (1/2) 0.0% (0/6) 33.3% (1/3) 100% (1/1) 0.0% (0/2)