Rochester Institute of Technology
RIT Scholar Works
Theses Thesis/Dissertation Collections
12-2014
Proof-to-Print Match: Effectiveness of
Substrate-Corrected Colorimetric Aims in Soft Proofing
Peng ChengFollow this and additional works at:http://scholarworks.rit.edu/theses
This Thesis is brought to you for free and open access by the Thesis/Dissertation Collections at RIT Scholar Works. It has been accepted for inclusion
Recommended Citation
Proof-to-Print Match:
Effectiveness of Substrate-Corrected Colorimetric Aims in Soft Proofing
By Peng Cheng
A Thesis submitted in partial fulfillment of the requirements
for the degree of Master of Science
in the School of Media Sciences
in the College of Imaging Arts and Sciences
of the Rochester Institute of Technology
December 2014
Primary Thesis Advisor: Professor Bruce Myers
Acknowledgment
TABLE OF CONTENTS
List of Tables. ... v
List of Figures. ... vi
Abstract. ... vii
Chapter 1: Introduction ... 1
Statement of the Problem ... 1
Reason for Interest in the Study ... 2
Chapter 2: Theoretical Basis ... 4
Color Management in Soft Proofing ... 4
Metamerism ... 5
ISO 14861: Requirements for color soft proofing systems ... 6
ISO 13655: Spectral measurement and colorimetric computation for graphic arts images ... 7
Substrate-Corrected Colorimetric Aims (SCCA) ... 8
Chapter 3: Literature Review ... 10
Printing Industry Trends... 10
The OBA Challenge ... 13
SCCA Solutions on Hard Proof ... 14
Chapter 4: Research Objectives ... 16
Chapter 5: Methodology ... 17
Part 1: Sample Preparation ... 17
Part 2: Psychometric Experiments ... 21
Chapter 6: Results and Discussions ... 26
Chapter 7: Summary and Conclusions ... 38
Conclusions ... 38
Further Research ... 39
Acknowledgment ... 40
Bibliography ... 41
List of Tables
Table 1: Experiment data in a two-way table ... 27
Table 2: Summary of Chi-Square test results ... 27
Table 3: SPSS results for expt. 1 image 2 ... 28
Table 4: SPSS test results for expt. 2 image 5 ... 30
List of Figures
Figure 1: Test images used in experiment ... 18
Figure 2: Illustration for experiment 1 ... 23
Figure 3: Illustration for experiment 2 ... 24
Figure 4: SPSS bar chart for expt. 1 image 2 ... 29
Figure 5: SPSS bar chart for expt. 2 image 5 ... 31
Figure 6: SPSS bar chart for expt. 2 image 3 ... 32
Figure 7: SPSS bar chart for expt. 2 image 4 ... 33
Figure 8: CRF curves for High-key, Low-key, Yellow, and Magenta images ... 35
Abstract
Soft proofing is an effective solution for clients and printers that decreases production cost and cycle time. However, print buyers are increasingly specifying brighter papers, which contain optical brightening agents (OBAs). One potential concern facing adopters of soft proofing systems is that they fail to consider the influence of OBA when rendering color images. Proofing systems are largely based on existing published specifications and their ICC profiles. These
specifications and ICC profiles — such as SWOP 3 and GRACoL 2006— do not
account for the influence of OBA-loaded printing papers, and therefore could cause a mismatch between the soft proof and the final print.
To improve the soft proofing performance, it is important to account for the influence of OBA in printed color and in soft proofing. This research project
investigated the use of the substrate-corrected colorimetric aims (SCCA) as the source ICC profile to improve proofing color accuracy. By conducting
Chapter 1
Introduction
Print buyers have long required a proof-to-print match. This requirement is complicated by their increased preference for papers that contain OBAs. However, the OBA in the substrates creates a blue color cast, which causes a proof-to-print mismatch in many cases (Chung, 2012). According to Printing Standards: A 2010
Survey Report (Chung & Jensen, 2011), printing companies ranked the two most
problematic technical issues they encountered in applying standards to their operations as “[p]ress sheet and proof do not match each other visually” and “[p]aper containing OBA does not conform to the paper white point specified in ISO 12647-2” (p. 15). Therefore, it is evident that developing a solution to
accommodate for the OBA factor in a proofing system is necessary.
Statement of the Problem
The International Organization for Standardization (ISO) has established ISO/CD 14861,1 the standard which defines a bright/bright viewing condition in a
soft proofing system2. The implementation of this standard does improve the effectiveness of proof-to-print match as compared to traditional soft proofing systems. However, requirements of print buyers have evolved since this standard was developed. As mentioned previously: today’s print buyers prefer brighter
papers that contain OBA. OBA absorbs ultraviolet radiation of illuminant
wavelengths below 400nm and re-emits this energy in the visible blue region of the spectrum. This can cause a visual color shift to blue hues (Tian & Chung, 2011). Since print buyers demand accurate proof-to-print match, the use of OBA papers creates more challenges for printers as current soft proofing systems fail to incorporate the influence of OBA in their renderings (Zunjarrao, 2012).
Although one promising solution—SCCA, which uses substrate-corrected colorimetric aims to build source ICC profile—does exist, it is still a new
technology and is not well understood by the industry. This research applied the SCCA solution to a soft proofing system under OBA influence and investigated the performance in color accuracy.
Reason for Interest in the Study
Due to the significant influence of digital media, the traditional printing
industry continues to face a dramatic decline in both number of establishments and shipment volume (Davis & Gleeson, 2012). In order to survive, implementing a soft proofing system is one of many strategies that has several benefits to
printers. First, soft proofing can increase productivity by eliminating the production, handling, shipping, or management of hardcopy proofs. Second, soft proofing also provides significant cost savings on consumables, such as ink or paper. Third, soft proofing allows clients to approve jobs remotely—no matter where they
are. However, having inaccurate soft proofing systems due to the effect of OBA effectively negates many of these benefits.
In addition, Chung (2013) conducted a case study to verify the effectiveness of SCCA as a source ICC profile on improving visual match between hardcopy proofs and prints on substrates containing OBA. The results showed improved color accuracy for the prints, but did not investigate the use of this technique on soft proofing. Therefore, the researcher became interested in applying SCCA to soft proofing systems in consideration of the “OBA factor” in an
Chapter 2
Theoretical Basis
This chapter provides the theoretical basis for this research from the
standpoint of the technical nature of the topic. The important theoretical bases are color management in soft proofing, metamerism, ISO standards for ISO 14861 and ISO 13655, and Substrate-Corrected Colorimetric Aims (SCCA). The following sections present these bases in depth.
Color Management in Soft Proofing
The goal of color management, and specifically of soft proofing, is to yield a state known as WYSIWYG (what you see is what you get). An International Color Consortium (ICC) profile—a description of the color gamut of a particular device in the color reproduction workflow—is a very important element of modern color
to A model: from the source ICC profile (CMYK) to the monitor ICC profile (RGB) via the connection of the PCS. Therefore, building an accurate source profile and monitor profile are key to getting accurate color match (Sharma, 2004).
For soft proofing, it is important that the display color space is sufficiently larger than that of the source color space. In addition, ICC profile-based color management recognizes four specific rendering intents: Perceptual, Relative Colorimetric, Absolute Colorimetric, and Saturation. These rendering intents tell the color management system how to deal with out-of-gamut colors in the conversion process. A detailed discussion of rendering intents is outside of the scope of the present report. However, Absolute Colorimetric, which maps the paper white point to the monitor color space, is the only rendering intent utilized here as this particular method is the most appropriate for proofing applications (Fraser, Murphy & Bunting, 2005). Interested readers can refer to Sharma (2004) or Fraser, Murphy, and Bunting (2005) for a more detailed discussion of this topic.
Metamerism
Metamerism is a phenomenon wherein two different color samples with
match under a different lighting source or to a different observer (Fraser, Murphy & Bunting, 2005). There are two different forms of metamerism. When the
mismatch occurs because of a change in illumination, it is called illuminant
metamerism. When the mismatch occurs due to a change in observer, it is called
observer metamerism (Berns, 2000). Because of metamerism, it is not necessary
to use identical materials to produce the same color appearance.
Metamerism is the foundation of today’s color reproduction technology. For
example, a printer only uses cyan, magenta, yellow and black inks to produce the color of green leaves, instead of using the green ink. Likewise, a display is also able to present the same color as the source image by using red, green, and blue phosphors.
Since this research is investigating the influence of OBA on the
proof-to-print match, the relevant phenomenon for consideration is illuminant
metamerism. In other words, the measurement illuminant, used in specifying the
printed color and in building the ICC profile, and the viewing illuminant should be the same. In addition, the color match between display and print is based on metamerism.
This International Standard specifies requirements for systems that are used to produce, from digital data, images on electronic displays that are intended to simulate a characterized printing condition defined by a set of characterization data. Recommendations are provided with regard to equipment selection, setup, operating and environmental conditions. Test methods associated with these requirements are also specified (ISO 14861, 2011).
Additionally, this standard specifies three different soft proofing scenarios, which are: (1) a soft proof displayed on a monitor without an associated view cabinet; (2) a viewing cabinet is associated with the monitor; and (3) the monitor is integrated into a viewing cabinet. The third scenario allows for simultaneous viewing (putting the print sample and soft proof on display side-by-side), which was considered the best for this research. Therefore, the researcher applied the third scenario to this research under the P2 lighting condition, which is defined in ISO 3664.
ISO 13655: Spectral measurement and colorimetric computation for graphic arts images
was largely due to the widespread use of OBAs in printing substrates. Two specific measurement conditions—M0 and M1—are germane to the present study.
Measurement condition M0 describes legacy instrumentation. This includes the overwhelming majority of color measurement instrumentation manufactured prior to 2010. Measurement condition M1 describes spectrophotometers that better depict for the effect of OBAs in color measurement (Connor, 2011).
Substrate-Corrected Colorimetric Aims (SCCA)
Although ISO 12647-2 standards define substrate colors with aim points and tolerances, more and more production papers exceed the ISO tolerance limits due to the influence of OBAs. SCCA is a solution for this issue, which is
implemented by adjusting a dataset. Chung and Tian (2011) adopted a solution to calculate substrate-corrected aims based on tristimulus linear equations for measurement backing correction (ISO 13655, 2010). The algorithm is shown in the following equations:
X2 = X1(1 + C) − XminC (1)
C = Xw2− Xw1
Where: X1 is the tristimulus value of printed color on Substrate_1.
X2 is the corrected tristimulus value of printed color on Substrate_2.
C is a constant
Xw1 is the measured tristimulus value of Substrate_1.
Xw2 is the measured tristimulus value of Substrate_2.
Xmin is the minimum (max TAC) tristimulus value of Substrate_1.
Based on the above equations, substrate-corrected CIEXYZ (Color_2) would be calculated, and then would be converted back to CIELAB space.
Chapter 3
Literature Review
This literature review begins with an overview of the current status of the printing industry. Next, the pertinent studies and research related to the use of soft proofing technology in the printing industry are presented.
Printing Industry Trends
Many sources indicate that the number of printing plants in the printing industry is in a state of decline (Webb, 2012). One contributing factor to this condition is the emergence of electronic media, such as the Internet, mobile media and telephony. “From 1999 to 2009 the number of total U.S. printing plants fell from 49,410 to 33,564—a decline of 15,845 (32 percent). In a typical year, more than 1,500 plants ceased operations” (Davis & Gleeson, 2012, p. 4). In
current workflows. Soft proofing is one way to improve efficiency.
Benefits from Soft Proofing
Currently, a number of printers have set up soft proofing systems in their color management workflow. Brown Printing Inc. has developed a soft proofing system that has provided very large cost savings as compared to hardcopy proofing (Cleaveland, 2007). Also, soft proofing can improve workflow efficiency because it avoids the creation and delivery of hard proofs. “Soft proofing helps to
make your business more eco-friendly, creating a ripple effect throughout the industry as reductions in consumables translate into a smaller environmental footprint“ (Magazines Canada, 2008). When compared to hard proofing, soft
proofing decreases costs and minimizes cycle time by reducing the workload for customer service, sales, and prepress staff, and by allowing for communication, collaboration, and job processing in real time.
Previous Research
tools, and specific software. Since the research project implemented ISO12646 standards successfully, all required parameters of the soft proofing system met the ISO standard, and the system yielded accurate soft proof-to-print matches. However, these researchers set up the monitor and viewing booth separately, which caused mismatch in some cases due to eye adaptation3.
To resolve this problem, Zunjarrao (2012) used an ISO 14681 integrated viewing condition to conduct soft proofing research. He also optimized the system by matching the white points of the monitor and print, so the results showed a positive conclusion. Zunjarrao (2012) mentioned that future research could focus on incorporating the OBA factor into a soft proofing system, which is the purpose of this study.
Other researchers examined the adoption of soft proofing in printing organizations (e.g., PRIMIR (2005), Yang (2013)). While these studies did not examine technical issues per se, they explored adoption rates of these
technologies within the marketplace.
3
The OBA challenge
Optically brightened papers are widely used today. These substrates look whiter and brighter due to the OBAs added during papermaking. An OBA is one type of chemical additive that is used to correct or improve the natural yellow color of pulp. Chung (2012) claimed “[w]hen paper mills accommodate print buyers’
paper needs by adding optical brightening agents in the papermaking process, it creates a misalignment in printing conformance according to the ISO 12647-2 standards. It also causes mismatches or color cast between the OBA prints and the non-OBA proof, according to the ISO 12647-7 standard” (p. 13). During the
process of color reproduction, color appears differently on papers with and without OBA, so it is necessary to develop methods to account for OBA effects (Tian & Chung, 2011). Although ISO 12647-2 standards specify the substrate colors and CMYK solid colors, prints on OBA papers exceed the ISO tolerance limits. Therefore, colorimetric aims need to be adjusted for substrate color difference (Chung & Tian, 2011).
ICC profiles did not factor in the influence of OBA. Therefore, when applying standard ICC profiles in the proofing color management workflow, proof-to-print mismatch will occur due to the different paper color. In order to address this issue, this research incorporated the influence of OBA into the soft proofing system.
SCCA Solutions on Hardcopy Proof
Previous researchers investigated the application of SCCA to the
production of hardcopy proofs. Chung (2013) conducted a case study to verify the effectiveness of SCCA as a source ICC profile to improve the visual match
between proofs and prints with OBA. In this case study, three hard proofs were made using the GMG proofing system with different ICC profiles: original SWOP 34 (ignoring the white point of the printing paper), substrate-corrected SWOP 3 under M0 measurement, and substrate-corrected SWOP 3 under M1 measurement. The results showed that proof-to-print match was achievable when SCCA under M1 measurement served as the source ICC profile. In addition, “[t]he
proof best matches prints containing OBA if gamut clipping between the two color
4
SWOP 3: Specifications for Web Offset Publications (SWOP) has become a major factor in
the success of the publication printing industry in the United States. SWOP 3 is a
spaces is minimized” (Chung, 2013, p. 6, ). Likewise, it is reasonable to believe
that soft proof-to-OBA print match would also be improved when using SCCA as source ICC profile because a monitor has a larger color gamut than a press does, and it does not have the gamut clipping issue. This present research examined this assumption.
Chapter 4
Research Objectives
Current soft proofing systems under the ISO/CD 14861 standards do a good job on soft proof-to-print match, but are encountering more and more
mismatches when commercial printers use paper with OBA for production in order to cater to print buyers’ needs (Tian & Chung, 2011). In this present research, two
research questions are addressed:
1) For a color-managed print on both OBA and non-OBA substrates, does the soft proof-to-print match depend on how the source ICC profile is generated in a soft proofing workflow?
Chapter 5
Methodology
This chapter describes the experimental design, the instrumentation and equipment used as part of the experimental design, and the methods used for collecting and analyzing data. The methodology includes two parts: sample preparation and psychometric experiments.
Part 1: Sample Preparation
To obtain better research results, the preparation includes selecting test images, printing test samples, building CMYK-source ICC profiles, setting up a soft proofing system, and calibrating the monitor.
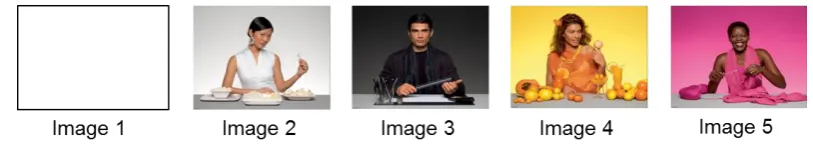
in premedia and printing. Therefore, the researcher decided to choose test images from these reference images. Additionally, each reference image has one prominent color (e.g., cyan, yellow, magenta). Previous studies showed there are less OBA effects on yellow and high ink coverage content in hardcopy proofing. Therefore, it was important to include these kinds of images in this study. Eventually, four images were chosen, which were High-key image, Low-key image, Yellow image, and Magenta image, as illustrated in Figure 1. Additionally, the white point is an essential
[image:27.612.135.542.402.476.2]element in soft proofing, so a pure white image was also included.
Figure 1: Test images used in experiment
1.3 CMYK source ICC profiles. Three different source ICC profiles were investigated in this study. These are Invercote T profile (associated with Non-OBA loaded Invercote T print), Invercote G profile (associated with OBA loaded Invercote G print), and SCCA profile (associated with substrate-corrected dataset). All three profiles were created in X-rite i1 Publish software, but in two different ways: (1) for Invercote T & G profiles, the researcher cut the IT8.7/4 test target out from the corresponding print sheet, then read the target using an X-rite i1 Pro 2 spectrophotometer under M1 measurement condition and built profiles in i1 Publish application. These profiles were built based on fully characterized datasets. (2) For the SCCA profile, CIELAB values (M1) of the white point for the OBA paper was measured and, then input into an existing spreadsheet based SCCA. This allowed the researcher to obtain the substrate-corrected CIELAB values for all 1,617 patches. Finally, by importing the substrate-corrected dataset into i1 Publish, the SCCA profile was generated.
ISO 12646 defines the minimum requirements for monitor properties including resolution, size, and uniformity of luminance. It also requires the lighting conditions of the viewing booth to be compliant to P2 condition in ISO 3664 (ISO/DIS 12646, 2006). Based on the published Eizo monitor specification, the resolution and the size of the Eizo CG242W satisfied the ISO standard. To verify uniformity of luminance, the researcher captured color values on the screen over two weeks. Data analysis of these readings showed that the monitor has good uniformity of luminance.
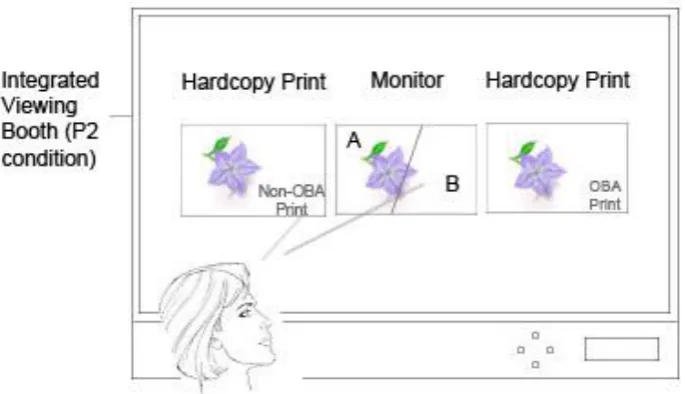
ISO 14861 requires an integrated viewing condition for the scenario of comparing hardcopy prints to soft proofs (ISO/CD 14861, 2011). As shown in Figure 2, the monitor was custom fitted into the viewing booth, which is an integrated viewing condition.
ISO 3664 defines the P2 condition, which is “[t]he illuminance at the center of the viewing surface shall be 500 lx ± 125 lx” (ISO/DIS 3664, 2008).
1.5 Calibrated monitor. According to ISO 12646, the monitor shall be calibrated under the following parameters: white point of D50, luminance of no less than 80cd/m2, and gamma value of 1.8-2.4. The researcher tried all of the parameter combinations for white point D50; luminance of 80 cd/m2, 120 cd/m2, and 160 cd/m2; and gamma of 1.8, 2.2, and 2.4 to build the profile, so as to find the best match for the pure white image between soft proof and print. The profile based on D50 white point, 120 cd/m2 luminance, and 2.2 gamma value was found to have the best match. This profile was used to calibrate the monitor. The calibration process was completed by using an X-Rite i1 Pro 2 spectrophotometer and i1 Publish software.
Part 2: Psychometric Experiments
This part describes the methods and procedures of the psychometric experiments involved in this study, which are the Farnsworth Munsell 100 Hue Test (FM 100 Hue Test), experiment 1, and experiment 2. There was a sequence order among the three psychometric experiments. FM 100 Hue Test was
conducted first, then experiments 1 and 2. The following sections give the details of the experiments.
observers for the experiment. Those who were categorized as average or superior color discrimination by the scoring software were considered qualified observers and were selected to participate in the experiment. Thirty-three prospective observers underwent the FM 100 Hue Test. Thirty of these observers qualified to participate in the experiment.
2.2 Experiment 1. Before beginning the experiment, the following critical sample preparation were completed: (1) the monitor and viewing booth were warmed up for at least 30 minutes; (2) the display profile was set to D50 white point, 120cd/m2, and 2.2 gamma value; (3) the light intensity of the viewing booth was set to 49%, which was compliant to P2 condition; (4) the room light was dimmed, bringing the ambient illumination to less than 32 lx; (5) opened Photoshop CS6 and unchecked “Use Black Point
Compression” and “Use Dither” under the “Conversion Options” section in
Color Settings; (6) opened fifteen images (5 images x 3 types of embedded profiles) in Photoshop CS6 and readied them for display; (7) set the
After the FM 100 Hue Test, the researcher guided qualified observers into the lab and handed them an answer sheet. First, image 1 with Invercote T profile embedded was displayed on the monitor as the soft proof, and the researcher put two image 1 prints (OBA and non-OBA print) side-by-side. The observer was asked to judge which print was a better match to the soft proof and put the result on their answer sheet. Next, the soft proof was changed to image 1 with Invercote G profile embedded, with the same two prints for comparison. After that, the experiment was
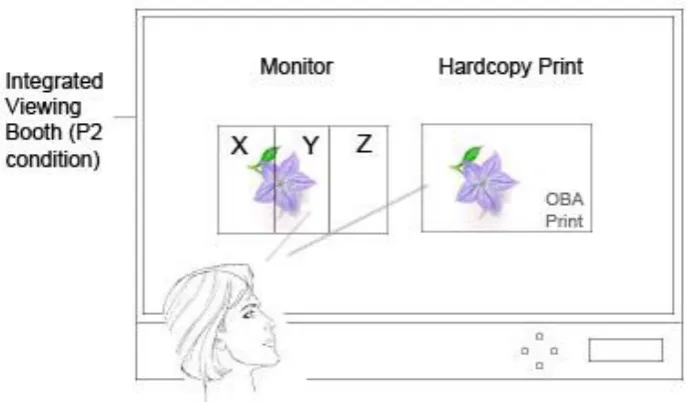
[image:32.612.167.510.446.643.2]2.3 Experiment 2. After finishing experiment 1, the observer moved to experiment 2. Five more soft proofs were introduced, which were images with embedded SCCA profiles (see Figure 3). Non-OBA prints were not needed this time, as only the OBA prints were put side-by-side with the soft proof. For each image, the researcher cycled through the three different soft proofs (labeled as X, Y, and Z; Part 1 1.3 describes the details), and the observer was asked to provide a ranking order for match performance (best, better, or good) among the three soft proofs when compared to the OBA print.
Figure 3: Illustration for experiment 2
In general, the Chi-Square test is a statistical test applied to
Chapter 6
Results and Discussions
The goal of this research was to determine the relationship between (1) the print sample and profile type embedded in an image (experiment 1), and (2) the profile type embedded in an image and soft proof-to-OBA print match
performance (experiment 2). A Chi-Square test was employed to investigate the relationship between these two variables. The null hypothesis (H0)assumes there
is no association between the two, while the alternative hypothesis (Ha) claims
that some association does exist.
Using the raw data from all thirty observers, the researcher summarized the frequency for each image in a two-way table, as listed in Table 1. Next, the Chi-Square test was performed at a 0.05 level of significance. Table 2 lists a summary of the test results, while a detailed listing of the test results is included in Appendix A. As shown in Table 2, with the exception of image 4 in experiment 1, the null hypothesis rejected5 for each of the image analyses.
5 “Reject” means there is a significant association between the two variables, while “Do not
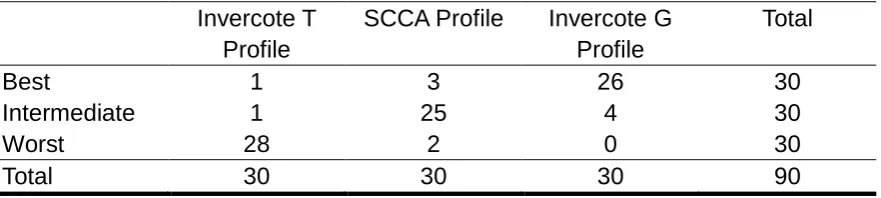
Table 1
Experiment data in a two-way table for experiment 2 image 1
Invercote T Profile
SCCA Profile Invercote G Profile
Total
Best 1 3 26 30
Intermediate 1 25 4 30
Worst 28 2 0 30
Total 30 30 30 90
Table 2
Summary of Chi-Square test results
Image 1 White paper Image 2 High Key Image 3 Low Key Image 4 Yellow Image 5 Magenta Experiment 1 Reject Reject Reject Do not
reject
[image:36.612.107.548.222.321.2]Reject Experiment 2 Reject Reject Reject Reject Reject
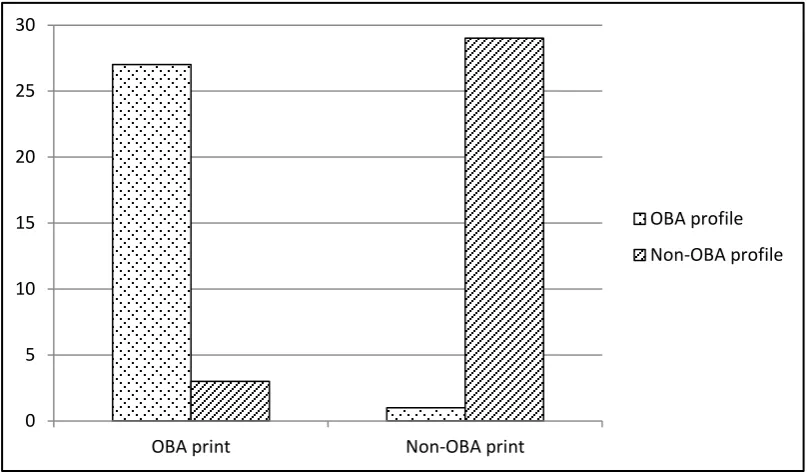
[image:36.612.101.547.422.504.2]However, the alternative hypothesis does not specify the type of association. Figure 4 provides more information to interpret the specific associations between the variables. In the bar chart, the horizontal axis represents type of soft proof (Invercote T profile embedded or Invercote G profile embedded), and the vertical axis represents the frequency count of the print sample chosen based on type of soft proof.
Table 3
Chi-Square test results for expt. 1 image 2
Figure 4: SPSS Bar chart for expt. 1 image 2
From the bar chart, it appears that non-OBA (Invercote T) print had a better match when the soft proof was the image with the Invercote T profile embedded, while the OBA (Invercote G) print had a better match for the Invercote G profile case. In other words, when a non-OBA profile (e.g., a current standard
specification, like SWOP or GRACoL) is applied in a job, there will likely be a mismatch between the soft proof and an OBA print.
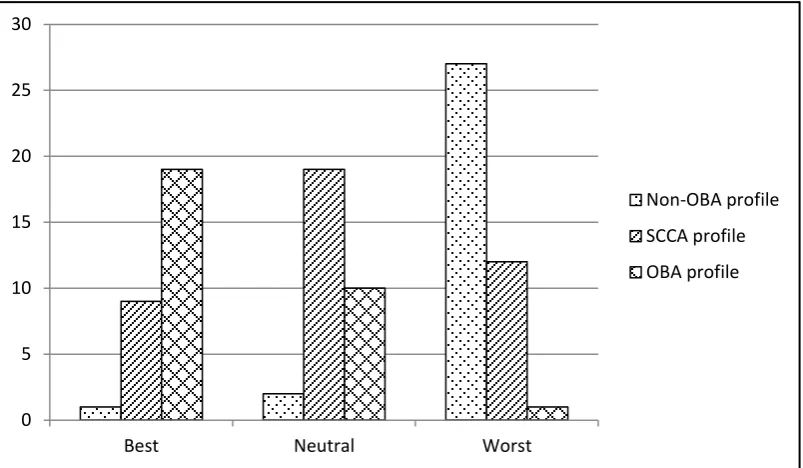
Likewise, the test results for image 5 in experiment 2 are shown in Table 4 and Figure 5. In Table 4, no cells have an expected count of less than 5, and the p
value is less than 0.001. The null hypothesis is rejected, which means there is a
0 5 10 15 20 25 30
OBA print Non-OBA print
OBA profile
significant association between the types of profiles embedded in an image and the match performance between the soft proof and an OBA print.
Table 4
Chi-Square test results for expt. 2 image 5
Value df p value Pearson Chi-Square 74.228 4 .000 N of valid cases 90
Figure 5: SPSS Bar chart for expt. 2 image 5
However, for image 4 (Yellow image) in experiment 1, the Chi-Square test results indicated that the null hypothesis was not rejected as indicated in Table 5. The p value was 0.121, which is greater than 0.05 and therefore the null
hypothesis was not be rejected. This indicates that there is no
empirically-supported association between the yellow-dominant print sample and the profile types embedded in an image.
Table 5
Chi-Square test results for expt. 1 image 4
Value df p value Pearson Chi-Square 2.4 1 .121
0 5 10 15 20 25 30
Best Neutral Worst
Non-OBA profile
SCCA profile
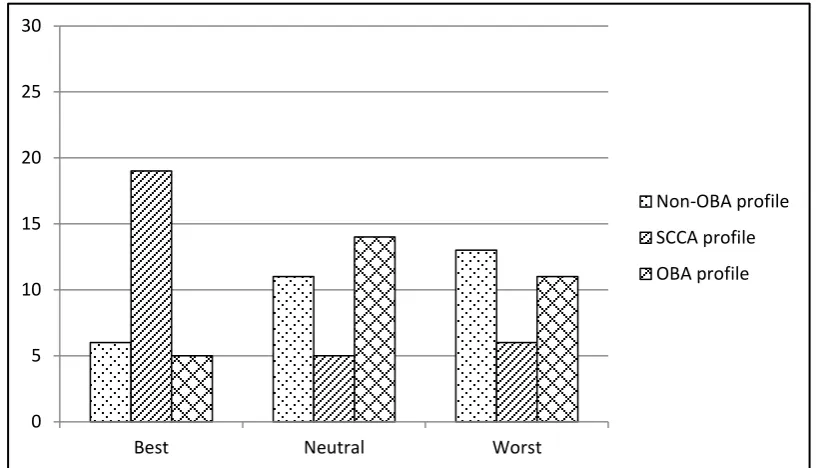
The test results for images 3 (Low-key) and 4 (Yellow) in experiment 2 are detailed in Figures 6 and 7.
Figure 6: SPSS Bar chart for expt. 2 image 3
0 5 10 15 20 25 30
Best Neutral Worst
Non-OBA profile
SCCA profile
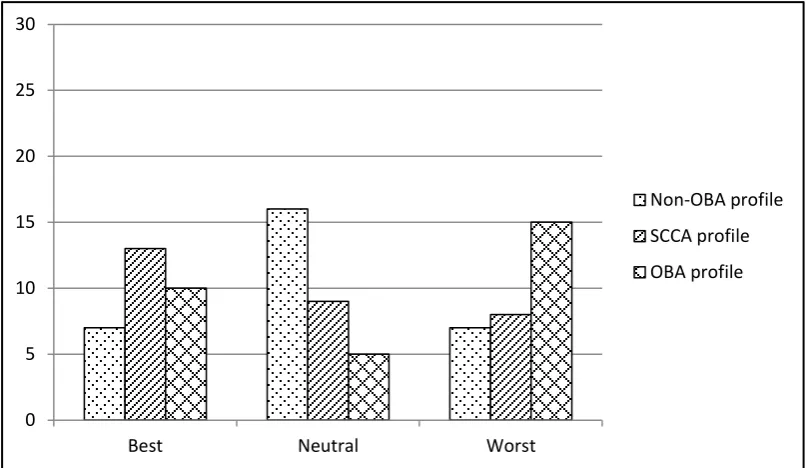
Figure 7: SPSS Bar chart for expt. 2 image 4
The p values for both images (0.001 for low-key image and 0.019 for yellow image) were both less than 0.05. These p values are highly significant, indicating statistically significant association were observed between the embedded profile types and match performance for both images. Even though the significant
association exists, there are interesting differences in the results when compared to the analysis of image (e.g., image 5 test results show that the Invercote G profile-embedded soft proof had the best match performance). As shown in Figures 6 and 7, the best performance was with the SCCA profile-embedded soft proof for images 3 and 4.
0 5 10 15 20 25 30
Best Neutral Worst
Non-OBA profile
SCCA profile
The goal of experiment 1 was to examine the assumption that the soft proof has a better match with its corresponding print sample (e.g., soft proof with Invercote G profile and the Invercote G print). This is likely due to the
methodology utilized in which the profile used in the soft proof was built based upon the corresponding fully characterized dataset. For experiment 2, it is
reasonable to expect the ranking order of match performance is the soft proof with the Invercote G profile, followed by the SCCA profile and, finally, the Invercote T profile. However, the data did not support this for all types of images, and images 3 (Low-key) and 4 (Yellow) were exceptions. The literature suggests two possible reasons for this: First, Tian and Chung (2011) claim that “[l]arger color differences
due to OBA in paper are observed in color patches with less coverage. As the ink coverage increases, less correction is needed” (p. 25). The Low-key image had
high ink coverage, and, as a result, there was less color shift influence due to the OBA. The second reason is the recognition that Yellow inks absorb short
A quantitative way of explaining this phenomenon is shown in Figure 8. The researcher plotted the CRF (Cumulative Relative Frequency) curves against ΔE00 values for all images (with the exception of image 1, as the pure white image
[image:44.612.180.460.219.455.2]contains only one color patch).
Figure 8: CRF curves for High-key, Low-key, Yellow, and Magenta images
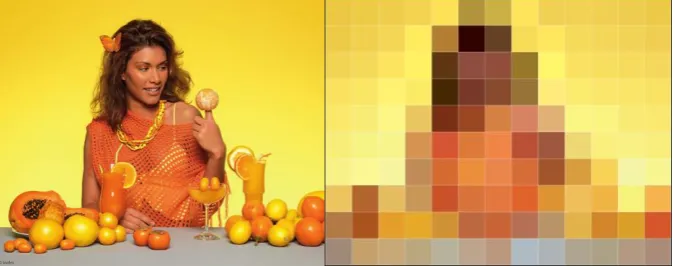
The procedure for plotting the CRF curves that was followed by the researcher was:
(1) converted the image to a very low resolution image (130 pixels in total) in Adobe Photoshop (see Figure 9);
0.0 0.1 0.2 0.3 0.4 0.5 0.6 0.7 0.8 0.9 1.0
0.0 0.5 1.0 1.5 2.0 2.5 3.0 3.5 4.0 4.5 5.0 5.5 6.0 6.5
(2) used Color Worksheet feature in ColorThink Pro to obtain the ΔE00
value list for all 130 samples between the Invercote T profile and the Invercote G profile;
(3) transferred ΔE00 values into a spreadsheet program, sorted them, and
then expressed the rank order in terms of percent of total samples;
(4) the percent rank numbers were plotted as CRF curves against the ΔE00
[image:45.612.146.484.312.445.2]values in Excel.
Figure 9: Original and low resolution image
In general, people report 90 percentiles of a CRF curve as quality evaluation criteria (Sigg, 2004). As shown in Figure 9, the CRF curves for the Yellow and Low-key images indicate 2.0 and 2.7 ΔE00 value respectively at the
90th percentile. Normally, human eyes find it difficult to detect color differences when the ΔE00 value is less than 3.0 (Eizo Desktop Color Handbook, 2009). This
images, the ΔE00 values were 5.6 and 3.5 respectively at the 90th percentile,
Chapter 7
Summary and Conclusions
Conclusions
This research investigated the relationship between types of profiles embedded in soft proofs and prints, as well as improving color accuracy performance when an SCCA solution is used in a soft proofing workflow. The results indicate that soft proofs and prints can cause mismatch in a soft proofing environment due to the influence of OBA, but the degree of mismatch depends on image content. For example, images with high ink coverage or prominent yellow color will likely have less influence from OBA. Results also indicate that both fully characterized and SCCA solutions can improve soft proof-to-print match.
Further Research
In a soft proofing system, the white point match between the monitor and the substrate serve as the baseline. Due to the limited research resources
available in this present study, a closer visual match between the white points was not fully obtained. Therefore, another direction for further research would be to develop a better calibration tool set for a soft proofing system that aims to obtain a close white point match between the display and substrate under D50 conditions.
This research has shown that the SCCA solution can improve soft proof-to-print match. However, there is no indication as to the existence of any limits on improvement performance. Perhaps there is no significant improvement if the color difference is less than 2 ΔE00 or more than 8 ΔE00. Further research
could investigate SCCA performance as a function of the white point between RPC (Reference Printing Condition) and APC (Actual Printing Condition).
Another further research direction can focus on developing quantitative methods for the comparison between soft proofs. In this research, the CRF curve only works for experiment 1 which is associated with physical print, however, for experiment 2, there is no available quantitative methods to find out the ΔE among
Bibliography
Berns, R. S. (2000). Billlmeyer and Saltzman’s Principles of Color Technology (3rd Ed.). New York, NY: John Wiley & Sons, Inc.
Cleaveland, C. (2007). Soft touch. American Printer.
Chung, B. (2012, 4th quarter). Connecting the dots. Spectrum Bulletin. Chung, B. (2013). Conformance to substrate-corrected dataset: A case study.
Presented at the TAGA Conference, February 2013, New York, NY. Chung, R. & Jensen, S. (2011). Printing Standards: A 2010 Survey Report. A
Research Monograph of the Printing Industry Center at RIT.
Chung, R. & Tian, Q. (2011). Substrate correction in ISO 12647-2. Presented at the TAGA Conference, March 6-9, 2011, Pittsburgh, PA.
Connor, O. K. (2011). The M factor: What does it mean? X-Rite White Paper. Retrieved from http://www.xrite.com/documents/literature/en/
L7-510_M_Factor_en.pdf
Davis, R. H., & Gleeson, E. (2012). Special Report: A Planning Guide for 2012–
2013. Printing Industries of America Economic and Market Research Department.
Eizo Desktop Color Handbook. (2009). Chapter 2: Color Management Basics. Retrieved December 18, 2013, from
http://www.eizo.com/global/library/EIZO_DCH_CH2.pdf
Engeldrum, G. P. (2000). Psychometric Scaling: A Toolkit For Imaging Systems
Development. Winchester, MA: Imcotek Press.
Field, G. G. (2004). Color and Its Reproduction – Fundamentals for the Digital
Imaging and Printing Industry. Sewickley, PA: GATF Press.
Fraser, B., Murphy, C., & Bunting F. (2005). Real World Color Management (2nd ed.) Berkeley, CA: Peachpit Press.
ISO/DIS 12646:2006, Graphic technology – Displays for color proofing – Characteristics and viewing conditions.
ISO/DIS 13655:2009, Graphic technology - Spectral measurement and colorimetric computation for graphic arts images.
ISO/CD 14861.2:2011, Graphic technology - Requirements for color soft proofing systems
ISO/DIS 3664:2008, Graphic technology and photography - Viewing conditions. Magazines Canada. (2008, September). Soft proofing: A guide to benefits and
best practices. Magazines Canada White Paper. Retrieved from
http://www.magazinescanada.ca/uploads/File/files/soft%20proofingWP%2 0FINAL%20DOC.pdf
PRIMIR (2005). Dynamics and Trends in Color Proofing 2005-2010.
Sharma A. (2004). Understanding Color Management. Clifton Park, NY: Thomson Learning, Inc.
Sigg, F. (2004). A New Tool for Quantitative Comparison of Color Differences. Test Target 4.
Sole, A., Nussbaum, P., & Hardeberg, J. Y. (2010). Implementing ISO12646 Standards for Soft Proofing in a Standard Printing Workflow According to PSO. Paper presented at IARIGAI, Montreal, Canada, September 2010. Retrieved from http://www.colorlab.no/content/download/28878/330518/
file/Sole2010.pdf
Tian, I. & Chung, R. (2011). Effect of Paper Containing OBA on Printed Colors.
Webb. J. (2012). Economic Outlook. Presented at the CMIC Summit 2012, October 19, 2012, Rochester, NY
Yang, Xi. (2013). Trends in Soft Proofing Utilized as Contract Proofs in
Commercial Lithographic Printing. (Published Master’s Thesis.) Rochester
Institute of Technology, Rochester, NY.
Zunjarrao, V. J. (2012). An Investigation of Soft Proof to Print Agreement Under
Bright Surround. (Published Master’s Thesis.) Rochester Institute of
APPENDIX A: Chi-Square Test Results for Both Final Experiments
Experiment 1 Image 1 – White paper
Experiment 1 Image 3 – Low-key image