Lateral impact response of end-plate beam-column connections
A. Al-Rifaie
a, Z.W. Guan
a,b,⇑, S.W. Jones
a, Q. Wang
b aSchool of Engineering, University of Liverpool, Liverpool L69 3GQ, UK b
School of Mechanical Engineering, Chengdu University, Shiling Town, Chengdu City, Sichuan Province, PR China
a r t i c l e i n f o
Article history:
Received 14 April 2017 Revised 3 July 2017 Accepted 14 August 2017
Keywords:
Steel connection Lateral impact Finite element Dynamic increase factor
a b s t r a c t
The behaviour of different steel beam to column connections has been studied intensively against static and seismic loading regimes. However, there is a lack of knowledge on the response of such connections against impact and blast. In order to close this gap, the most common connections with partially depth end plate (PDEPCs), as a simple connection, and flush plate (FPCs), as a moment resisting connection, were investigated under both quasi-static and impact loads. Here, eight specimens were tested under those loading conditions with different locations. 3 D finite element models were then developed and val-idated against the corresponding experimental results. Full range analyses of the connection responses under both loading regimes are then carried out using the validated FE models to examine the internal forces of the connections. Finally, the results of full analyses under both loading regimes were compared and dynamic increase factors (DIF) were proposed to assist predicting the impact response of these types of connections using the static analysis. The results showed that failure modes under both loading regimes were similar, but with the larger fracture on the PDEPC under quasi-static load than that under lateral impact. The DIFs were found to be between 1.02 and 1.21, 1.03 and 1.36 and 1.22 and 1.45 based on the bolt tensile strength, axial resistance and bending resistance of the connections, respectively. However, if based on the energy approach, the range of DIFs was recorded between 1.25 and 1.38 using the experimental results and between 1.19 and 1.34 using the finite element analysis results.
Ó2017 The Authors. Published by Elsevier Ltd. This is an open access article under the CC BY license (http:// creativecommons.org/licenses/by/4.0/).
1. Introduction
In the past four decades, the structural engineers have given considerable attention on investigating the response of structural members subjected to accidental loads such as impact and blast. These loads may be resulted from faulty practice, terrorist attack or vehicle impact, etc. The collapse of Ronan point in 1968 alerted the structural designers to the problem of progressive collapse at which local failure of primary structural elements led to the col-lapse of the connected members[1]which resulted in a dispropor-tionate collapse. SCI publication P391 [2] that presents the structural robustness of steel framed buildings in accordance with the Eurocode and UK National Annexes states that ‘‘ In essence, the objective is to ensure that buildings do not suffer disproportionate collapse under accidental loading. Largely, this is assured in steel framed buildings by designing connections appropriately”. Also, after the WTC collapse, it was reported that the connection response against impact and fire needs to be understood and quan-tified as critical components of structural frame[3]. Hence, it will
be beneficial to investigate the dynamic behaviour of this critical part on the structural frame particularly for connections with a low moment resistance. In steel framed structures having simple or semi-rigid beam-to-column connections, the connections are likely to be weaker than the columns and beams. However, in this case, any local failure developed in the connection due to the acci-dental loading may likely be followed by a partially or entirely pro-gressive collapse of the steel frame. Hence, connection response should be investigated prior to other steel frame components to prevent or reduce the possibility of progressive collapse occurrence.
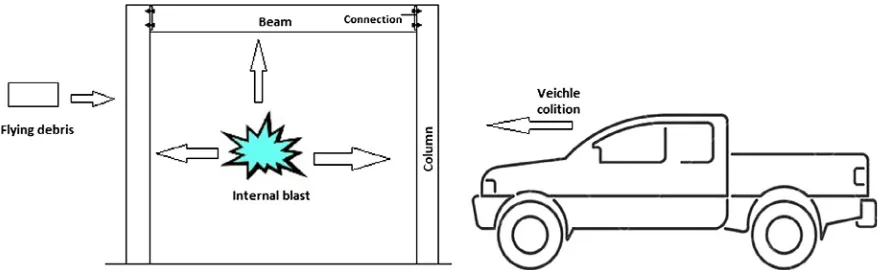
Generally the impact loading could be transferred to any struc-tural beam-to-column connection by either striking the beam or the column connected. However, columns are more likely to expose to such forces than beams such as vehicle impact, flying debris or internal explosion, as shown in Fig. 1. Consequently, intensive studies were carried out to investigate the response of different types of columns under such loads (Yu and Jones [4], Mannan et al.[5], Bambach et al. [6], Zeinoddini et al.[7,8], Al-Thairy [9], and Shakir et al.[10]). In those studies, axially and non-axially loaded columns were investigated experimentally and numerically under lateral impact loads. Nevertheless, the structural aspects of steel frames require columns to be connected
http://dx.doi.org/10.1016/j.engstruct.2017.08.026
0141-0296/Ó2017 The Authors. Published by Elsevier Ltd.
This is an open access article under the CC BY license (http://creativecommons.org/licenses/by/4.0/).
⇑ Corresponding author at: School of Engineering, University of Liverpool, Liverpool L69 3GQ, UK.
E-mail address:zguan@Liverpool.ac.uk(Z.W. Guan).
Contents lists available atScienceDirect
Engineering Structures
to beams using suitable connections. Then, studying the columns response with ignoring the connection contribution would lead to incomplete understanding of the overall steel frame behaviour. Izzuddin et al.[11]realized this fact and concluded that progres-sive collapse failure of buildings is largely dominated by the max-imum deformation allowed on the connections in relation to their built-in ductility.
The lack of knowledge on the dynamic capacities of steel con-nections indicates that limited studies were conducted. Recently, an experimental and numerical study on fin-plate connections under static and dynamic conditions was undertaken with a load-ing time to failure less than 32 ms. The study verified the ability of the modified component method to predict the connection response under high strain rate loading[12]. Wang et al.[13]also investigated numerically the response of a fin-plate connection due to falling floor impact loads. The main finding was the total displacement could be reduced using high strength steel. Angle cleat connections were investigated as another type of connection under high loading rate by Rahbari et al.[14]with the results indi-cating that such connections are relatively insensitive to the strain rate. A numerical study was presented by Kang et al. [15]as an attempt to investigate the response of steel frame with moment resisting connections against vehicle impact. The results showed that the frame remained stable under 40 km/h (11.1 m/s) car hit-ting speed, while the frame was severely damaged in a progressive manner when the car speed reached more than 80 km/h. Grimsmo et al.[16]conducted an experimental study at which extended end plate connections were tested under quasi-static and impact load hitting the column axially (i.e. shear and bending moment pro-duced on the connection). The results showed that the connections tested behaved in a preferable manner and became more ductile under impact loads. However, Tyas et al. [17] showed that the PDEPC connection became less ductile under dynamic test com-pared to that under quasi-static one. This contradiction in the results from Tyas et al.[17]and Grimsmo et al.[16]indicates that more research need to be carried out on both connection types to improve the knowledge on this issue. It should be mentioned that the studies conducted by Rahbari et al.[14], Kang et al.[15]and Tyas et al.[17]were under lateral dynamic load while the others were under gravitational dynamic loads. The experimental study that carried out by Grimsmo et al. aforementioned at Ref. [16] was followed by a numerical study conducted by the same authors using the finite element modelling[18]. The main findings were that the energy dissipated by the connection was significantly increased by reducing the end plate thickness, while marginal effect on the response of the connection was found by applying dif-ferent axial forces on beam.
In this paper, simple and semi-rigid end plate connections were investigated experimentally and numerically against static and
impact loads applied laterally on the column. The experimental work contained testing eight L-beam to column connections, four of them under impact loads and the others under quasi-static load. The test set-up was designed to provide moment and axial tensile force at the connections. Moreover, finite elements models were developed and verified by the experimental results, which were further used to predict the internal forces and energies dissipated under static and dynamic loads. In order to present a relation between the static and dynamic behaviour of the connections, Dynamic Increase Factor (DIF) which is preferred by the structural engineers, was suggested to assist predicting internal forces gener-ated on the connection due to impact loading based on forces and energy.
2. Experimental study
2.1. Reaction frame fabrication
The specimens to be tested require a stiff reaction frame to sup-port them under both the quasi-static and impact loads. This frame should be stiff enough to minimize any movement during the test that may affect the results. The frame was designed and fabricated at the University of Liverpool and some trial tests were carried out to examine its suitability.
Fig. 2shows the schematic diagram of the test setup containing
the details of the frame, in which the frame contains three parts, i.e. floor mounted rails, moveable sub-assembly and bracers. The rails provided a fixed location for the drop hammer operator. Also, holes in the rails were provided to allow the movable sub-assembly for variable lengths. Two vertically mounted supports fabricated were bolted to the rails to provide a rigid base. The cross members with a detachable clamping setup provided a method to rigidly clamp the samples. Three rigid bracers were employed to connect the rails to both ends of the sub-assembly frame and the detachable clamping setup in order to minimize the rotational movement of the sub-assembly frame which supports the specimens.
[image:2.595.72.513.66.205.2]The rigidity of the reaction frame was examined prior to test the specimens. Hence, three additional trial specimens having a con-nection stronger than all of those to be investigated in this study were tested under impact load. The translational and rotational movements of the reaction frame at the detachable clamping where the specimen connected to the stiff frame were recorded using high speed camera. The maximum rotational angle and the maximum downward translation of the detachable clamp for all trials measured were 0.61°and 1.7 mm, respectively. However, it is expected that this error is to be minimized using weaker joints as proposed in this study.
2.2. Specimen preparation
Figs. 3(a) and (b) display the test setup considering two loca-tions of the applied load and two types of connecloca-tions. The size of beam and column were 30512737 and 15215237, respectively. An 8 mm thick end plate was welded to the bottom of the beam by 4 mm fillet weld then connected to the column by four M16 bolts with the grade 8.8. All welding work was carried out by a licensed welder on a private company (WREN Industrial & Marine Fabrication Ltd., Sandon Industrial Estate-Liverpool-L5 9YN) and special care was taken to avoid plate distortion due to high welding temperature. In the real situation, most structural frames are provided with lateral bracing to prevent the sway of the frame. This was considered in the test setup by providing a lat-eral restraint to the beam. Thus, each beam flange was connected to the stiff frame by six M16 bolts with the grade 8.8. Roller sup-port was attached to the end of column to prevent any horizontal sway of the column as in a practical situation and to enhance the rotational stiffness of the frame.
Fig. 3(c) also indicates the two types of connections investigated in this study, i.e. the PDEPC (as a simple connection) and the flush end plate (as moment resisting connection). In the former, the plate was welded to the beam web only while it was welded to the beam web and flange in the latter.Table 1shows the test spec-imens and matrix of parameters used in the experimental work under static and impact loads.
2.3. Material testing
Standard tensile coupon tests were performed for all steel sec-tions involved in the specimens, in addition to the high strength bolts. The coupons were also taken from the web and flange of both the beam and column to be tested separately as the properties of them may be varied. The stress-strain curves of the web and flange of the aforementioned sections showed a slight difference. Hence, the results from both the webs were selected to represent the stress-strain curves of these parts. All the tests were repeated three times and the replicated tests showed excellent repeatability. The
corresponding engineering stress-strain curves were obtained for all constituent materials under quasi-static load. True stress–loga-rithmic plastic strain curves were also obtained in order to con-sider a large displacement in the modelling as it will be discussed in Section3.2.1. The material properties of both washers and nuts were assumed to be similar to the bolt properties.Fig. 4 shows the stress strain curves of the steel sections used in this study. The effect of strain rate was also taken into account which is to be discussed in Section4.2.1to obtain dynamic material prop-erties and then to be used as input data in the FE modelling.
2.4. Structural testing
The connections prepared were tested under static load using hydraulic actuator and lateral impact load using a drop hammer. A schematic of the test setup under impact load is shown in Fig. 2. The same setup was used for the static tests by replacing the drop hammer by a quasi-static loading device. Also the same stiff frame was used to clamp the specimens under both load regimes.
For the impact test, the beam of each specimen was connected first to the stiff frame by 12 M16 bolts with the grade 8.8. Then a flat projectile with a mass of 107.5 kg and a contact area of 100100 mm was released from a height of 2.9 m to hit the free end of the column with an initial measured velocity of 7.5 ± 0.05 m/s, which generate a dynamic tensile force and bending moment on the connection. A laser Doppler Velocimeter (LDV) sys-tem was used to acquire the velocity time history of the projectile during the short period of the impact loading. The system was con-nected to a computer via an interface card and fiber optic cable to manage the operating software. The processing of the LDV signals was performed to minimize the noise using the digital filter soft-ware imPRESSion 6 with a cut-off frequency of 1000 Hz[19]. The acceleration was evaluated from the differentiation of the mea-sured velocity time history. The impact force was obtained by mul-tiplying the impactor mass by the acceleration.
[image:3.595.76.530.70.322.2]In order to capture the displacement time history at the free end of the specimens, a high speed camera (HSC) was used with
(a) Elevation view of L-beam to column connection specimen loaded at a distance
(L1) from the centre line of the connection
(b) Elevation view of L-beam to column connection specimen loaded at a distance
(L2) from the centre line of the connection and the locations of strain gauges
[image:4.595.105.436.478.699.2](c) Types of connection being investigated in this study (Section a-a in Fig. 3a)
one high voltage light to increase the clarity of the target to be hit by the projectile. ProAnalyist motion analysis software was employed to convert the frames captured by the HSC to displace-ment time history curve. In addition to the LDV and HSC, four mul-tipurpose strain gauges were attached to each specimen at different locations to capture the strain time history. Two of them were placed on the end plate, while the other two were located on the top flange of the column where the maximum moment was expected, and on the web of the beam as shown inFig. 3b. The strain gauges were wired and connected to a conditioning unit which completes a full bridge and amplifies the bridge output. The output of the signal conditioner was connected to four chan-nels Tektronix TDS2024C oscilloscope of 2 Gs/s sampling rate. A calibration equation of 5 V = 10,000m
e
was used to convert the voltage time history of the oscilloscope to strain time history. Hence, after 10,000me
the system is unable to capture strain.In the static test, a hydraulic actuator was used to apply a quasi-static load on the specimen as mentioned in Section2.1. Also, the specimens were attached with strain gauges at the same locations for impact specimens and the same system used in impact test was used to obtain strain measurements with a longer time scale. One LVDT was placed at the free end of the column to capture the deflection with each load increment.
3. Finite element analysis
In order to investigate the connection response under static and impact loads, the internal forces produced in the connection com-ponents need to be determined. The main parameters that affect the connection behaviour under lateral impact load were specified to be tensile strength of bolts, axial resistance and moment resis-tance of the connection. This is because the connection experiences
dynamic tensile force and moment under lateral impact. The finite element analysis (FEA) was employed to obtain those internal forces as they cannot be measured experimentally. Also, the vali-dated FEA model could be used to investigate the effects of various parameters on the connection response by intensive parametric studies.
3.1. Description of the finite element modelling
Finite element analysis was performed using ABAQUS/Explicit [20]which is suitable for both of dynamic and quasi-static loading. Also, it is a preferable approach for dealing with complicated con-tact problems rather than implicit or general static procedure. A special attention should be taken for using ABAQUS Explicit to model quasi-static loading by ensuring that the inertial forces remain insignificant. This was checked by ensuring that the ratio of the kinetic energy to the internal energy (ALLKE/ALLIE) should be always less than 5%[20]. Different loading rates and mass scal-ing were studied to save the analysis time and the optimum values were found out to be 0.67 mm/s and 106,respectively, with ALLKE/ ALLIE less than 2% for all models.
Fig. 5shows the FE model developed to simulate the impact
test. Eight-noded solid element with reduced integration (C3D8R) was used to model all parts. Four elements through the thickness of each part were generated to avoid element hourglass. Due to the large deformations that connection components (bolts and plate) may experience, finer mesh was generated at and near those components. The surface of the column flange with possible con-tact with the projectile was also refined to obtain reasonable results of velocity and impact force time histories. Also, to make use of the symmetry nature, a half model was employed to save the CPU of the analysis. The connection between the stiff frame and the beam flanges was modelled as a fixed end due to negligible movement, which was observed during the trial tests using the high speed camera as mentioned in Section 2.2. The projectile was modelled as a flat rigid body with dimensions of 100100100 mm and a mass of 53.75 kg (half of the total mass) assigned with a downward velocity of 7.5 m/s. The bolt was modelled without threads but their effect was considered by a reduction of the area of the threaded region. Hence, a hole is cen-trally located through the threaded region only with an area equal to the gross area of the bolt minus the net tensile area. A represen-tative hole with a diameter of 7.9 mm was applied to make the equivalent area where the hole is located equal to 152 mm2.
Modelling of contact between various surfaces is one of the most critical processes. Hence, considerable attention was made to select the proper master and slave surfaces and to assign appro-priate interaction properties to model the interaction. Tie con-strains and surface to surface contact formulations were used to model contact surfaces. The former was employed to connect weld to the beam and plate, nuts to bottom washers, and nuts to bolts as no visible deformation was observed on these parts during the experimental tests. However, the surface to surface contact was employed between bolt heads and top washers, washers and end plate, bolt shank and holes of plate and column, plate and column, roller and column, in addition to projectile and column. Penalty friction formulation with a coefficient of friction of 0.2 between contact surfaces was selected to simulate the tangential behaviour of the contact, while the normal hard contact allowing separation was assumed for all interaction surfaces. The time histories for impact force and displacement underneath the projectile in addi-tion to the strain in the selected four locaaddi-tions where strain gauges were placed were requested in the model for the validation purpose.
The FE model developed above for modelling the impact response was modified for quasi-static models. It was initially
Table 1 Test specimens.
Specimen reference Loading type Connection type Load location
PFI8 Impact PDEPC L1a
PNI8 Impact PDEPC L2b
FFI8 Impact FPC L1
FNI8 Impact FPC L2
PFI8S Quasi-static PDEPC L1
PNI8S Quasi-static PDEPC L2
FFI8S Quasi-static FPC L1
FNI8S Quasi-static FPC L2
a L1 load located 1224 mm from the center line of the connection. b L2 load located 374 mm from the center line of the connection.
0 100 200 300 400 500 600 700 800 900
0 0.05 0.1 0.15 0.2 0.25 0.3
Engineering Stress (MPa)
Engineering Strain
Bolt (fy=645,fu=798)
Column (fy=336,fu=442)
Beam (fy=337, fu=448)
[image:5.595.53.283.215.379.2]plate (fy=253,fu=374)
started to model the quasi-static analysis using similar mesh size to that used for impact analysis. However, the CPU time of the quasi-static analysis was found to be significantly larger than that of the impact case. Therefore, mesh sensitivity study was con-ducted to select the optimum mesh size at which the results would not show noticeable dynamic effect. It was found that the coarser mesh could be used for quasi-static analysis comparing with that for the impact one.
3.2. Modelling of materials behaviour
3.2.1. Modelling the Elasto-plastic behaviour
The Elasto-plastic behaviour of steel materials was modelled using ABAQUS/Explicit based on the engineering stress-strain curves obtained experimentally as shown inFig. 4. Hence, modulus of elasticity (E) and yield stress (
r
y) were taken from the curves for each material to be used as input data to define the elastic stage up to the yielding point. In order to obtain reasonable material prop-erties in the plastic stage, the engineering stress-strain curves were modified to obtain the true stress-strain curves using the following equations.r
true¼r
engð1þe
engÞ ð1Þe
true¼lnð1þe
engÞ ð2Þwhere
r
engande
engare the engineering stress and the correspond-ing engineercorrespond-ing strain, respectively. These equations were used up to the onset of necking (at the point of ultimate stress (Fu)). Beyond necking, a tri-axial strain starts to develop which makes the beha-viour more complicated and the equations above are not valid. Therefore, a simplified methodology was used to draw the true stress strain curve beyond necking by assuming that the material experiences considerable strain corresponding to a constant stress level. The ultimate stress (Fu) was used as the constant stress value, while the fracture strain was calculated using Bridgman strain equation.e
truef ¼lnA
Af ð3Þ
whereAis the original cross sectional area of the tensile specimen tested and Afis the cross sectional area after fracture.
Plastic strain hardening behaviour up to the peak stress was modelled based on the stress-strain relationships after the yielding
point (Fig. 4). These curves then were modified using the dynamic increase factor included in Johnson-Cook (DIFJC) model as follows.
DIFJC¼1þCln
e
_ ð4ÞHere, C is the strain rate constant;
e
_¼e
_=e
_0is the strain rate ratio, wheree
_ ande
_0are the current strain rate and the reference quasi static strain rate (e
_0= 0.001 s1), respectively. The constant C was assumed to be 0.039 for the end plate and weld, and 0.0072 for high strength bolt, washers and nuts as adopted by Ribeiro et al.[21]. The beam and column were not considered as strain-rate sensitive materials in the modelling of the low velocity impact. Also, it should be mentioned that to simplify the simulation, the material proper-ties of the heat-affected zone were assumed to be the same as the base material.3.2.2. Modelling the damage
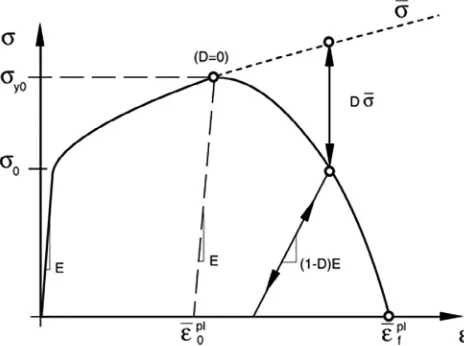
[image:6.595.74.513.67.259.2]After the strain hardening stage, onset of damage and damage evolution need to be modelled.Fig. 6shows a typical stress strain curve with progressive damage degradation of an isotropic mate-rial. The solid line after onset of damage (Damage parameter (D) = 0) represents the initiation of damage, while the dashed curve refers to the material response without damage. Hooputra et al. [22] proposed a procedure at which ductile damage and shear
Fig. 5.The FE model of the impact test.
[image:6.595.310.542.566.739.2]damage could be predicted for aluminium alloys. This approach was adopted to predict damage for isotropic ductile material. In this paper, ductile damage under impact load was modelled using the equivalent plastic strain-triaxial stress state envelope devel-oped by Ribeiro et al.[21]. It was used to estimate the damage ini-tiation of T-stub connection under impact load which was related to this study. Also, it was developed for both of bolts and plate which have more or less the same material properties of those used in this study. Shear damage initiation modelling in ABAQUS is described as a function of shear stress ratio, strain rate and the equivalent plastic strain (
e
plo ). In order to define these parameters, the same model was employed using isotropic metal plasticity constitutive model and both of shear stress ratio and strain rate were requested as output in a group of elements where the shear failure occurred close the weld toe on the plate. Then, the fracture strain is obtained from true stress-strain relationship under uniax-ial tension. Once damage initiation is detected at any element, the damage evolution stage starts to lead to the progressive degrada-tion of the element stiffness until the ultimate failure. In this study, an effective plastic displacement assuming a linear relationship between effective plastic displacement (upl) and the damage vari-able (D) was adopted to model the damage evolution. It is consid-ered also that the effective plastic displacement to be an input to the model is a function of the mesh size and the equivalent plastic strain as follows.
upl¼Lc
e
plo ð5Þ
where Lc is the element size. (
e
plo) can be determined in Fig. 6, depending on the stress-strain curve of the materials tested. The modelling of ductile and shear failure under quasi-static was per-formed using ABAQUS keyword option. Hence, the ultimate tensile stress of the plate and bolt were used as input data to model the ductile damage. Also, shear damage of the end plate was modelled in the same way of ductile damage and a value of the equivalent plastic strain at the onset of shear damage (e
pls) of 0.2 was complied with the experimental results for all models.4. Results and discussion
4.1. Experimental results under impact load and validation of the FE model
4.1.1. Impact force-displacement relationships
The impact force-displacement curves were obtained by com-bining both the impact force-time history acquired from the LDV and the displacement-time history acquired from HSC.Fig. 7shows the time histories of load and displacement for the specimen FFI8.
It can be seen that the maximum peak force produced in a time less than 1 ms followed by drastically descended multi-peaks due to the intermittent impact. Then, the impact force begins to be more stable at a force level of about 50 kN. As the maximum displace-ment reached, the projectile start to rebound and a noticeable degradation in force value can be seen. On the other hand, the dis-placement time history indicates that the maximum disdis-placement of the specimen corresponds to the stabilised force that was pro-duced after multi peak forces.
Figs. 8–11show the impact force-displacement curves for all
specimens. It can be seen that the impact force (F) versus displace-ment can be generally divided into three stages which are demon-strated inFig. 8, i.e.
(1) The peak stage: at which the impact force reaches its maxi-mum value with less than 3 mm of displacement;
(2) The plateau stage: in this stage, the connection begins to deform plastically with a relatively stable impact force after the first peak;
(3) The bounce stage: in this stage, the curve descends from the total displacement to the separation point as the projectile starts to separate from the struck column.
Changing the location of impact load from L1= 1.224 m to L2= 0.374 m leads to increasing the peak force by 8% and 24% for the PDEPCs and the FPCs, respectively. Also, the peak forces of the FPCs are greater than those of the PDEPC by 25% and 10% when the load is located at L2and L1from the connection, respectively. This is due to the higher stiffness of the FPC, at which the velocity of the pro-jectile at the onset of contact with the stuck column decelerated faster than the PDEPC specimens. After the first peak stage
partic-0 10 20 30 40 50 60 70
0 50 100 150 200 250 300 350
0 0.005 0.01 0.015 0.02 0.025 0.03
Displacem
ent (m
m
)
Force (kN)
Time (s)
Force-FE
Force-Exp
Displacement-FE
[image:7.595.326.552.412.558.2]Displacement-Exp
Fig. 7.The force time history and displacement time history of the specimen FFI8.
0 50 100 150 200 250 300 350 400 450
0 5 10 15 20 25
Force (kN)
Displacement (mm) FE Exp
Stage 1 Stage 2
Stage 3
Fig. 8.The impact force-displacement curve of the specimen FNI8.
0 50 100 150 200 250 300 350
0 10 20 30 40 50 60 70
Force (kN)
Displacement (mm)
FE
[image:7.595.53.283.591.738.2]Exp
[image:7.595.321.557.597.736.2]ularly when the load is far away from the joint (L1), a clear inter-mittent impact can be seen. This is attributed to missing contact between the projectile and the struck column where a clear gap was noticed between them by the high speed camera. Besides, the peak forces induced in these specimens descends gradually until reaching the mean stage as the difference in velocities between the projectile and column was smaller. Grimsmo et al. [16] also observed multiple hits leading to intermittent impact and gradual descending of peak forces in joints with a flexible end-plate under impact load.
Regarding the plateau stage, it is clear that the specimens loaded near the connection (L2) experienced a higher plateau force. Also, around 84% and 60% of the total energy were absorbed in this stage for the specimens loaded at L2and L1from the joint, respec-tively. It is expected that these percentages will be higher if a col-umn is supported from the free end as that in the practical case. However, this can be investigated by using the validated model to perform parametric studies to study different cases of geometry and energies in addition to the boundary conditions. Therefore, the plateau stage can be classified as the critical stage between other stages at which most of the applied energy is absorbed.
As the velocity of both projectile and struck column attains to zero, the third stage starts and the displacement approaches to its maximum value. The area under the curve at this stage repre-sents the recovered energy by the specimen after the impact energy is dissipated. The recovered energy of both connections was not affected for the load being located near the connection (L2), i.e. approximately same area under curve, as shown inFigs. 8 and 10. While, the FPC demonstrated a recovered energy of 285% of that of the PDEPC if the load was located far away from the connec-tion (L1) as shown inFigs. 8 and 10.
The validation process contained the validation of both the load-time history and displacement-time history first for a speci-men. Then, both experimental curves were combined to obtain the experimental load-displacement curve as mentioned above. Finally, the former curves were compared with those obtained from the FE model. Fig. 7 shows the displacement time history and load time history of the specimen FFI8, together with the numerical modelling output. Good correlation is obtained.Figs. 8– 11also show the validation of the FE models against experimental results. A good agreement is obtained, which indicates the model is capable of predicting the three stages of impact response. How-ever, the peak force in the simulation seems increasing faster than that in the test, which may be attributed to the assumption of the rigid projectile that has the much higher contact stiffness than the deformable steel projectile used in the test. Also, the model is able to predict the total displacement at the free end of the column up to the separation point.
4.1.2. Deformation modes
The results from all impact tests demonstrate three different modes of failure, i.e. end plate bending, first bolt pair bending and fracture of the end plate close to the weld toe.Figs. 12–14 show those failure modes of the connection components under impact load. It can be seen that all specimens experienced large deformations at the end plate, while fracture of the weld toe occurred only in the PDEPC. The bend of the first pair of bolts is noticed as well which is likely attributed to the bearing stresses between the end plate and the bolt shank. This may lead to another type of failure representing either by combined shear-bending of the bolt or bearing failure of the plate. Owens and Moore [23] showed that the bearing failure of plate occurred under pure quasi static axial tensile load on the joint. Hence, both of these failure modes need to be covered using the validated FE model under impact load. Moreover, the failure mode of both joints was not affected significantly by changing the load location.
In general, very good correlation between the observed and pre-dicted failure modes was obtained, as indicated inFigs. 12–14. It can be seen that the FE models produce accurate predictions of the three failure modes. In addition to the failed shape, the strain time histories in the four critical locations of each specimen were also examined and verified against the measurements, which con-firms the validity of the FE models developed.Fig. 15shows the validation of strain time histories in these locations (Fig. 3b) for the specimen PNI8. A good agreement is obtained for all the gauges except strain gauge 2 which saturated at 10,000m
e
that is the max-imum strain to be captured by the oscilloscope as mentioned in Section2.4.0 50 100 150 200 250 300 350
0 5 10 15 20 25 30 35
Force (kN)
Displacement (mm)
FE
[image:8.595.40.278.67.207.2]Exp
Fig. 10.The impact force-displacement curve of the specimen PNI8.
0 50 100 150 200 250 300 350
0 20 40 60 80 100
Force (kN)
Displacement (mm)
FE
[image:8.595.43.277.253.393.2]Exp
Fig. 11.The impact force-displacement curve of the specimen PFI8.
(Pa)
[image:8.595.310.547.597.739.2]4.2. Experimental results under Quasi-static load and validation of the FE models
4.2.1. Force-displacement relationships
Figs. 16 and 17show the load displacement curves of all
spec-imens tested under quasi-static load. It can be seen that all the con-nections demonstrated bilinear behaviour with noticeable degradation in the stiffness up to failure. The FPC showed higher stiffness than the PDEPC in both loading locations, as expected, since the former is a moment resistance connection. Also, the PDEPC showed a considerable ductility up to failure though it is classified as a simple connection.
As mentioned in Section3.1, ABAQUS/explicit was found to be the appropriate approach for simulating a connection with com-plex contact conditions under quasi-static loading.Figs. 16 and
17 also show the verification of the quasi static model against experimental results. Good agreements are obtained for the bilin-ear load-displacement curves in spite of the slight oscillations pro-duced in theses curves particularly after the onset of fracture. These oscillations can be controlled using lower loading rate which in turn leads to increase the time of analysis. Hence, this was avoided in this study because very slight effect was found on the internal forces using lower loading rate.
4.2.2. Deformation modes
Generally, the deformation modes under quasi-static load were similar to that under impact load for all specimens but with a higher damage for the PDEPC specimens close to the weld toe, as shown inFig. 18. The strain rate where the plate tearing occurred seems to be higher than other locations which increase the
[image:9.595.83.525.72.168.2]princi-(Pa)
Fig. 13.The failure mode of the specimen FNI8 under impact load.
[image:9.595.88.523.210.379.2](Pa)
Fig. 14.The failure mode of the specimen PNI8 under impact load.
-0.3 -0.2 -0.1 0 0.1 0.2 0.3 0.4 0.5 0.6 0.7 0.8
0
0.005
0.01
0.015
Strain (με) x10
3
Time (s)
SG1-FE
SG1-Exp
SG4-FE
SG4-Exp
0
2
4
6
8
10
12
14
16
18
0
0.005
0.01
0.015
Strain (με) x10
3
Time (s)
[image:9.595.118.486.416.559.2]SG3-FE SG3-Exp SG2-FE SG2-Exp
ple stresses of the plate and then to delay the tearing failure in that location. In other words, two major components contributed to produce this failure, i.e. excessive bending and shear on the plate
and both of them were delayed due to the strain rate effect. Hence, the PDEPC responded relatively more ductile under impact load than quasi-static load.
4.3. Full-range analyses of the structural response
The validated FE models were used to analyze the full-range response of end plate connections under quasi-static and impact load, including the internal forces in bolts, the axial and moment resistances of the connections investigated. These outputs repre-sent the key factors that affect the joint response under lateral loads. Also, this analysis helps with proposing a DIF for each key factor separately and then to propose a preliminary DIF at which the impact response can be predicted using static analysis that is a preferable procedure for structural engineers. In addition to the internal force based DIF, an energy based DIF was also proposed by comparing both energies dissipated by the system under quasi-static and impact loading. The validated model is also employed to estimate the strain-rate distribution in the critical parts of the connection.
4.3.1. Internal forces on bolts
The tensile forces on the bolt were requested in the FE model as the contact force between the bolt head and the top washer.Figs. 19
and 20show the force time histories of the first and second bolt
under impact load. Generally, continuous force flow with a few spikes can be seen for all specimens in spite of intermittent impact observed in the impact force-displacement relationships. This is because the struck column was kept accelerated and displaced despite the contact separation of the impactor. The numerical results showed that the first bolt for all specimens experienced a faster change in force than the second bolt after the onset of loading (for example in specimen FFI8, the first bolt needs less than 1.5 ms to reach 60 kN while the second bolt reaches the same load by more than 6 ms). Also, it can be seen that after the maximum displace-ment of the free end of the column, the forces on both bolts begin to degrade rapidly due to the fast deceleration of the applied force in the bounce stage. Moreover, specimens loaded at L2from the joint center experienced a faster bolt force degradation to reach the separation point. Besides, it can be seen that the first bolt for all specimens loaded dynamically gains a considerable amount of its peak force in a short period, which indicates that the bolt expe-rienced a high strain rate. This may lead to bolt thread stripping fail-ure which is a type of failfail-ure to be avoided in connection. Mouritz [24]showed that failure load of mild steel bolt thread under impact tension load decreased with increasing strain rate. However, this 0
20 40 60 80 100 120 140 160
0 5 10 15 20 25 30 35
Force(kN)
Displacement (mm)
[image:10.595.42.277.66.237.2]FNI8S-FE FNI8S-Exp PNI8S-FE PNI8S-Exp
Fig. 16.Force-displacement curves of the specimen FNI8S and PNI8S under quasi-static load.
0 10 20 30 40 50 60
0 20 40 60 80 100
Force(kN)
Displacement (mm)
FFI8S-FE
FFI8S-Exp PFI8S-FE
[image:10.595.40.279.284.470.2]PFI8S-Exp
Fig. 17.Force-displacement curves of the specimen FFI8S and PFI8S under quasi-static load.
(Pa)
[image:10.595.68.510.568.740.2]type of failure was not observed in all specimens tested here, which may need to be examined under higher impact energies.
4.3.2. Internal axial resistance
The axial capacity of the joint plays a very important role in the progressive collapse failure which is referred in Eurocode as a tying force[2]. Hence, a section was made in the beam near the joint using ‘‘free body cut” command available in ABAQUS and axial force versus time was requested to represent the axial resistance of the connection.Fig. 21shows the axial resistance versus time curves for specimens tested under impact load. It can be seen that the connection axial force loaded at L1started its peak with a con-siderable negative value of about 50 kN. In this short period of time, the column tried to push the beam upward, creating down-ward (negative) reaction which is opposite to the situation under quasi-static load. In order to prove this, a beam translation was tracked in y-axis using FE model with a large deformation scale factor and the upward translation of the beam was observed dur-ing that period. Moreover, disregarddur-ing the negative peaks of those specimens shows that FPC specimens need a shorter time to reach their peak force than the PDEPC specimens. The specimens loaded far away from the joint seem having more vibration than others, as can be seen inFig. 21, which may be considered as a precaution of the nut loosening that is an unfavourable connection failure.
4.3.3. Internal moment capacity
Perhaps, there is no concern about the integrity and robustness of a structural frame having moment resistance connections. Hence, it was suggested to use them to improve the structural
robustness of building frames subjected to terrorist explosion attack in the US[25]. However, using simple connections may raise the possibility of local failure followed by progressive collapse. Therefore, it would be beneficial to investigate the internal moment capacity under impact and static loads to have a deep insight into the structural behaviour. The ‘‘Free body cut” com-mand was used again in the same section that was used to inves-tigate the internal axial force to examine the internal moment resistance of the connection under both load regimes. Fig. 22 shows the internal moment versus time curves of the four speci-mens tested under lateral impact load. As expected, PDEPC demon-strated a lower moment resistance than the FPC in both loading points. For a fair comparison between the moment resistances of the connections, the maximum displacement at the free end of the FPC was used here as a bench mark. The comparison showed that specimens FFI8 and PFI8 have an internal moment resistance of 39.27 kN m and 15.79 kN m, respectively at a displacement of 60.2 mm (at time = 0.0179 s). In other words, the internal moment resistance of the PDEPC was about 40% of that of the FPC when loaded at L1, while this ratio decreased to 25% for specimens loaded at L2. Moreover, it can be seen that both the connection types reach the peak moment faster as the loading point is moving towards joint. Therefore, the specimens loaded close to the joint required less than 1 ms to reach its peak moment resistance, while more than 5 ms was needed for others loaded far away from the connection.
4.3.4. Strain-rate distributions at the critical locations
Strain rate is defined as the change in strain of a material with respect a time. To obtain more knowledge on the strain rate distri-0
20 40 60 80 100 120 140
0 0.005 0.01 0.015 0.02 0.025 0.03 0.035
Force (kN)
Time (s)
[image:11.595.49.289.68.224.2]FNI8 FFI8 PNI8 PFI8
Fig. 19.Internal tensile force time histories of the first bolt row under impact load.
0 10 20 30 40 50 60 70 80 90
0 0.005 0.01 0.015 0.02 0.025 0.03 0.035
Force (kN)
Time (s)
FNI8 FFI8 PNI8 PFI8
Fig. 20.Internal tensile force time histories of the second bolt row under impact load.
-100 -50 0 50 100 150
0 0.01 0.02 0.03 0.04
Axial force (kN)
Time (s)
[image:11.595.318.557.69.220.2]FNI8 FFI8 PNI8 PFI8
Fig. 21.Internal axial resistance time histories under impact load.
-20 -10 0 10 20 30 40 50
0 0.005 0.01 0.015 0.02 0.025 0.03 0.035 0.04
Mom
ent (kN.m
)
Time (s)
FNI8 FFI8 PNI8 PFI8
[image:11.595.49.289.261.417.2] [image:11.595.320.555.584.739.2]bution in the system, the strain time histories were requested at the elements in the connection that experienced large deforma-tions, such as those in the end plate and the first bolt. The scalar variable SDEG available in ABAQUS was used to specify the ele-ments that initiate the damage degradation. The locations selected to investigate the strain rate distribution in this study are shown in
Fig. 5, as P1, P2, P3 and P4.Fig. 23shows the average strain rate in
those points. To compare the strain rate on the plate of both types of connections, P1 could be compared with P2 and P3. Hence, it could be noticed that the strain rate at P1 of the specimen PNI8 was 32.39 s1, while it was 15.31 s1at P2 and 18.15 s1at P3 in the specimen FNI8. In other words, the PDEPC experienced the twice strain rate of the FPC, if the load is located near the connec-tion. Approximately, the same trend could be identified if the spec-imens loaded far away from the connection. This could be attributed to the higher deformation that PDEPC exhibited at a specific time if compared with FPC as the latter is stiffer than the former. P4 could be used to compare the strain rate at the critical point on the first bolt. It is clear that specimens loaded near the connection experienced the higher strain rate than those loaded far away from the connection. For instance, the first bolt of the specimen FNI8 experienced a strain rate of 12.54 s1, while it was only 3.92 s1in the specimen FFI8. This is because the first bolt of the specimen loaded near the connection needs less time than those loaded far away to reach its maximum force, as shown in Fig. 19.
5. Dynamic increase factor (DIF)
Dynamic increase factor can be defined as the ratio of dynamic strength to its static counterpart of a material or structural mem-ber. Response of a structural member at high strain rate is more complicated than its static response. Therefore, one of the straight
methods to predict the strength of a structural member under dynamic load is to enhance its static strength multiplying by an appropriate DIF. This approach was used by Wang et al.[26] to estimate the dynamic resistance capacity of concrete filled double steel tubular members under lateral impact. Also, it was used by Liu et al.[27]to address the appropriate DIF for the design of struc-tures against progressive collapse. Generally, two types of DIF were commonly used: force-based DIF and displacement-based DIF. The former is the ratio of the dynamic load to the static load of the structural system under the same displacement, while the latter is the ratio of the dynamic displacement to the static displacement under the same load. In this study, the former was found to be more appropriate so that the impact force-displacement relation-ships were recorded first. Then, the corresponding specimens were loaded under quasi-static loads up to the same maximum displace-ment acquired under impact load. However, DIFs were proposed in terms of the internal force and the energy dissipation in this study to evaluate their consistence.
[image:12.595.41.278.66.258.2]5.1. DIFs based on the internal force
Table 2shows comparisons of the extreme values of the main
components in the connection that affect the connection response under quasi static and impact loads. Clearly, all the static results demonstrate the lower extremes than the impact results in ent levels. The first bolt row in all specimens shows a small differ-ence in DIF, with a range of 1.17–1.21 being recorded. On the other hand, the second bolt row demonstrates the lower dynamic effect than the first row in a range of 1.02–1.16. The DIFs predicted for the axial connection resistance were identified for the FPC to be 1.03 and 1.12 for specimens loaded at L2and L1, respectively. How-ever, these factors increased from 1.15 to 1.36 in the PDEPC spec-imens. Hence, the axial capacity of moment resistance connections loaded close to the connection seems to be less affected dynami-cally than those loaded far away. The PDEPCs exhibited the similar trend of the DIF for both loading locations but slightly higher than those of the moment resistance connection by about 20%. Regard-ing the internal moment resistance, the PDEPC demonstrated higher DIFs than those of FPC particularly if the load applied far away from the connection. Then a considerable reduction from 1.45 to 1.22 (about 16%) was produced if the FPC replaced by PDEPC for specimen loaded far away the connection. However, a slight difference of about 2% could be noticed if the load was applied near the connection for both types of connections. This could be attributed to the higher moment resistance of the FPCs than those of PDENCs which are not designed to resist bending moment. Here, the PDEPCs showed a good impact moment resis-tance in spite of the fact that they are not designed to resist bend-ing moment.
5.2. DIFs based on the energy principle
The energy principle was used to estimate the experimental and numerical DIF. Hence, dissipated energy which represents the area
0 5 10 15 20 25 30 35
P1 P2 P3 P4
Strain rate (s
-1
)
Critical selected places
FNI8 FFI8 PNI8 PFI8
[image:12.595.33.552.665.754.2]Fig. 23.The averaged strain rate distributions at the selected critical locations.
Table 2
Summary of the extreme internal forces of the connections under impact and quasi-static loads and the related DIFs.
Specimen Static tensile force in the 1st bolt row (kN)
Impact tensile force in the 1st bolt row (kN) DIF-1st bolt row Static tensile force in the 2nd bolt row (kN)
Impact tensile force in the 2nd bolt row (kN) DIF -2nd bolt row Static axial resistance (kN) Impact axial resistance (kN) DIF-axial resistance Static moment resistance (kN m) Impact moment resistance (kN m) DIF – moment resistance
FNI8 109.40 132.84 1.21 68.05 79.21 1.16 128.76 133.08 1.03 23.94 33.35 1.39
FFI8 109.10 130.03 1.19 63.32 69.65 1.10 50.26 58.03 1.15 34.87 42.86 1.22
PNI8 82.47 96.64 1.17 56.60 62.12 1.10 95.27 107.50 1.12 9.49 13.51 1.42
under the load-displacement curve was determined using digital filter software imPRESSion 6[19]for specimens tested under both load regimes. Then the DIFs were calculated using the following equation.
DIF¼Ei
Es ð6Þ
whereEi is the energy dissipated under impact load andEs is the energy dissipated under quasi-static load. The static dissipated energy was calculated by assuming that the specimen has the same initial stiffness after releasing the load.Table 3shows comparisons of the Ei andEs obtained based on the experimental results and numerical analyses for specimens tested, in addition to the corre-sponding DIFs.
Clearly, all the static results demonstrate the lower energy dis-sipations than the impact counterparts. Based on the experimental results, the DIF varies from 1.25 to 1.38 for all specimens tested. However, it varies from 1.19 to 1.34 based on the FE models. Hence, the difference between them is less than 5%, which indi-cates good correlation. Moreover, the specimen PFI8 demonstrates the higher DIF both experimentally and numerically, which is coin-cided with that using the internal force approach, as the maximum DIF was identified in this specimen against bending moment. It could be said that the proposed DIFs based on the two approaches obtained good insight into the dynamic effect on the end plate con-nections under lateral impact load.
It should be mentioned that the proposed DIF needs to be inves-tigated further with different circumstances such as connection geometries, impact locations, boundary conditions and applied energies to verify the possibility of using these DIFs. This will be studied separately.
6. Conclusions
Experiments work and the finite element analyses have been successfully undertaken to study the structural response of end plate connections under both lateral quasi-static and impact loads. Here, the dynamic increase factor (DIF) has been proposed by eval-uating the dynamic response of the connections in relation to their quasi-static counterparts to indicate the dynamic effect on the con-nection systems. The finite element models developed have also been rigorously validated against the corresponding experimental results in terms of load-displacement traces, deformation modes, strain-time histories. The validated models are further used to obtain the internal forces of the connection components which cannot be measured experimentally. Based on the above work, the following conclusions can be drawn as follows.
Test results showed that the lateral impact response of the end plate connection can be classified as three stages: (i) the peak stage, (ii) The plateau stage and (iii) the bounce stage. The plateau stage can be considered as the most critical stage because more than 60% of the impact energy (area under the load-displacement curves) was dissipated, along with the development of plastic deformation.
Both connection types investigated showed large local plastic deformations on the end plate and the first bolt row under quasi-static and impact loads. Generally, similar failure modes was observed under both load regimes but larger tearing close the weld toe was observed on the PDEPC under quasi-static load. This confirms the increase on the connection stiffness under impact load due to the strain rate effect at the crack tip.
Simulation of bolted connections under impact load required special attention due to the complexity of geometry and contact. In addition to its efficiency to model the dynamic events, ABAQUS/-explicit was found to be an effective method to simulate bolted connections under quasi-static loading but with ensuring the kinetic energy to internal energy ratio for each part of the model to be less than 5%. Also, using loading rate of 0.67 mm/s with 106 mass scaling factor can help the analysis with reducing computa-tional costs without a significant dynamic effect on numerical results.
Finally, two approaches were used to predict the dynamic effect of such connections under lateral impact load. In the internal force based approach, the DIFs identified are between 1.03 and 1.45, while in the energy based approach the maximum DIF was identi-fied experimentally and numerically to be 1.38 and 1.34, respectively.
Acknowledgements
The work presented in this paper was supported by the Min-istry of Higher Education and Scientific Research in Iraq, which is gratefully appreciated. The authors would like to thank Mr A. Al-Husainy for his help with the data processing. The authors also wish to thank Mr. M. Bratley and Mr. D. Neary for their assistance in the experimental work.
References
[1] Adminstration U.S. G.S. GSA. Progressive collapse analysis and design guidelines for new federal office buildings and major modernization projects; 2003.
[2] Way AG. Structural robustness of steel framed buildings; 2011 [SCI. 55]. [3] McAllister T, Corley G. World trade center building performance study: data
collection, preliminary observations, and recommendations, Fedral Emergency Management Agency; 2002.
[4]Yu J, Jones N. Numerical simulation of a clamped beam under impact loading. Comput Struct 1989;32(2):281–93.
[5]Mannan MN, Ansari R, Abbas H. Failure of aluminium beams under low velocity impact. Int J Impact Eng 2008;35(11):1201–12.
[6]Bambach MR, Jama H, Zhao XL, Grzebieta RH. Hollow and concrete filled steel hollow sections under transverse impact loads. Eng Struct 2008;30 (10):2859–70.
[7]Zeinoddini M, Parke GAR, Harding JE. Axially pre-loaded steel tubes subjected to lateral impacts- an experimental study. Int J Impact Eng 2002;27:669–90. [8]Zeinoddini M, Harding JE, Parke GAR. Axially pre-loaded steel tubes subjected
to lateral impacts (a numerical simulation). Int J Impact Eng 2008;35 (11):1267–79.
[9] Al-Thairy H. Behaviouand design of steel column subjected to vehicle impact. School of Mechanical, Aerospace and Civil Engineering, PhD Thesis, University of Manchester; 2012.
[image:13.595.42.562.86.153.2][10] Shakir AS, Guan ZW, Jones SW. Lateral impact response of the concrete filled steel tube columns with and without CFRP strengthening. Eng Struct 2016;116:148–62.
Table 3
Summary of energies dissipated under quasi-static and impact loads and the related DIFs.
Specimen Experimental results DIFExp FE results DIFFE
Es(J) Ei(J) Es(J) Ei(J)
FNI8 1871 2575 1.38 1981 2495 1.26
FFI8 1862 2330 1.25 1883 2248 1.19
PNI8 2007 2760 1.38 2057 2498 1.21
[11] Izzuddin BA, Vlassis AG, Elghazouli AY, Nethercot Obe DA. Assessment of progressive collapse in multi-storey buildings. In: Proceedings of the Institution of Civil Engineers – Structures and Buildings 2007;160(4):197–205. [12]Stoddart EP, Byfield MP, Davison JB, Tyas A. Strain rate dependent component based connection modelling for use in non-linear dynamic progressive collapse analysis. Eng Struct 2013;55:35–43.
[13]Wang H, Yang B, Zhou XH, Kang SB. Numerical analyses on steel beams with fin-plate connections subjected to impact loads. J Constr Steel Res 2016;124:101–12.
[14]Rahbari R, Tyas A, Buick Davison J, Stoddart EP. Web shear failure of angle-cleat connections loaded at high rates. J Constr Steel Res 2014;103:37–48. [15] Kang H, Shin J, Kim J. Analysis of steel moment frames subjected to vehicle
impact. In: APCOM & ISCM, Singapore; 2013.
[16]Grimsmo EL, Clausen AH, Langseth M, Aalberg A. An experimental study of static and dynamic behaviour of bolted end-plate joints of steel. Int J Impact Eng 2015;85:132–45.
[17]Tyas A, Warren JA, Stoddart EP, Davison JB, Tait SJ, Huang Y. A methodology for combined rotation-extension testing of simple steel beam to column joints at high rates of loading. Exp Mech 2012;52(8):1097–109.
[18]Grimsmo EL, Clausen AH, Aalberg A, Langseth M. A numerical study of beam-to-column joints subjected to impact. Eng Struct 2016;120:103–15.
[19] ImPREESSion 6. NecoletTecnonlgies. Germany: Weisang GmbH & Co. KG; 2002.
[20] Abaqus documontations. SIMULIA; 2012.
[21]Ribeiro J, Santiago A, Rigueiro C, Barata P, Veljkovic M. Numerical assessment of T-stub component subjected to impact loading. Eng Struct 2016;106:450–60.
[22]Hooputra H, Gese H, Dell H, Werner H. A comprehensive failure model for crashworthiness simulation of aluminium extrusions. Int J Crashworthiness 2004;9(5):449–64.
[23]Owens GW, Moore DB. The robustness of simple connections. Struct Eng 1992;70(3):37–53.
[24]Mouritz AP. Failure mechanisms of mild steel bolts under different tensile loading rates. Int J Impact Eng 1994;15(3):311–24.
[25] The Oklahoma City bombing: improving building performance though multi-hazard mitigation. Washington DC; 1996.
[26]Wang R, Han L-H, Zhao X-L, Rasmussen KJR. Analytical behavior of concrete filled double steel tubular (CFDST) members under lateral impact. Thin-Walled Struct 2016;101:129–40.