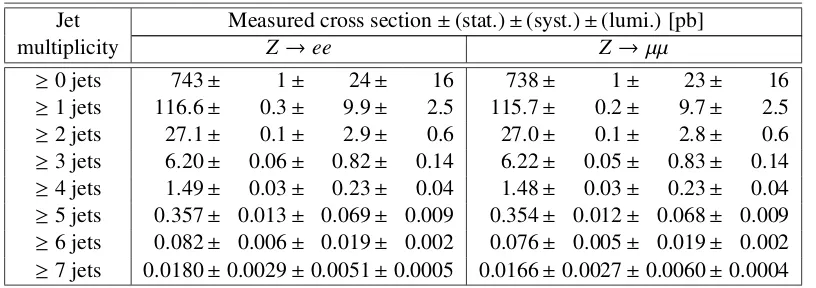
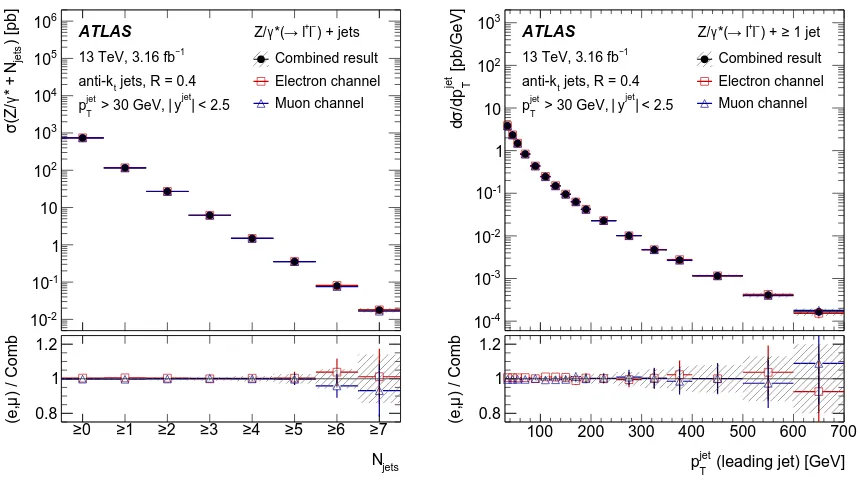
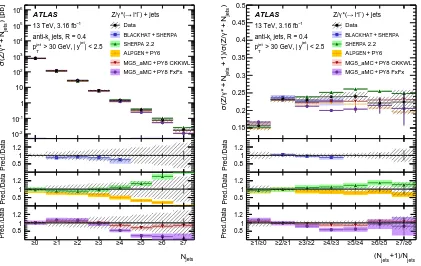
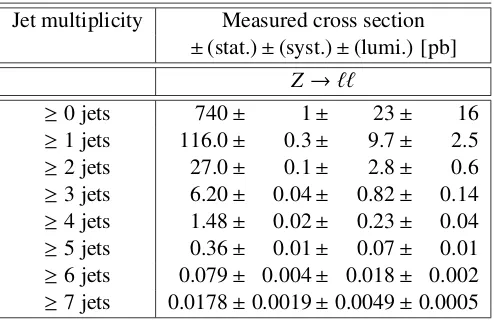
Measurements of the production cross section of a Z boson in association with jets in pp collisions at root s=13 TeV with the ATLAS detector
Full text
Figure

Related documents
Finally, the network should increase the profile of research results around public private mix issues for both national and international policy makers, and thus
Future work shou d investigate whether group density affects other parameters of immunity in eusocia insects such as the PO system AMP s and potentia
The Stereotactic Ablative Radiotherapy for Oligometa- static Non-small Cell Lung Cancer (SARON: NCT02417662) randomised controlled trial commenced recruitment in early 2016 and
Speakers from the 50 th LCD Anniversary event in London: Left to Right are John Rudin (Folium), Mark Verrall (Merck), Cyril Hilsum, Cliff Jones, Martin Schadt,
study, of NMT , 56 used a variant of the facilitated null approach to validate the target gene; the deletion of both chromosomal alleles was not possible until a “ rescue ” allele
1) Transposition of Directive 76/464/EEC: Information from each Member State was collected to see how and when the Framework directive and daughter Directives were transposed
Relative Si abundance is plotted against exposure time in (c) and the fitting shown with the anchoring fit in (d).. Amongst the XPS peaks observed from the photopolymer flats,
The table shows the results of several probit regressions on a dummy variables that is one if an insurer was nominated as global systemically important by the Financial Stability
