R E S E A R C H A R T I C L E
Open Access
Cancer care coordinators in stage III colon
cancer: a cost-utility analysis
Tony Blakely
1, Lucie Collinson
1, Giorgi Kvizhinadze
1, Nisha Nair
1*, Rachel Foster
1, Elizabeth Dennett
2and Diana Sarfati
1Abstract
Background:There is momentum internationally to improve coordination of complex care pathways. Robust evaluations of such interventions are scarce. This paper evaluates the cost-utility of cancer care coordinators for stage III colon cancer patients, who generally require surgery followed by chemotherapy.
Methods:We compared a hospital-based nurse cancer care coordinator (CCC) with‘business-as-usual’(no
dedicated coordination service) in stage III colon cancer patients in New Zealand. A discrete event microsimulation model was constructed to estimate quality-adjusted life-years (QALYs) and costs from a health system perspective. We used New Zealand data on colon cancer incidence, survival, and mortality as baseline input parameters for the model. We specified intervention input parameters using available literature and expert estimates. For example, that a CCC would improve the coverage of chemotherapy by 33 % (ranging from 9 to 65 %), reduce the time to surgery by 20 % (3 to 48 %), reduce the time to chemotherapy by 20 % (3 to 48 %), and reduce patient anxiety (reduction in disability weight of 33 %, ranging from 0 to 55 %).
Results:Much of the direct cost of a nurse CCC was balanced by savings in business-as-usual care coordination. Much of the health gain was through increased coverage of chemotherapy with a CCC (especially older patients), and reduced time to chemotherapy. Compared to‘business-as-usual’, the cost per QALY of the CCC programme was $NZ 18,900 (≈$US 15,600; 95 % UI: $NZ 13,400 to 24,600). By age, the CCC intervention was more cost-effective for colon cancer patients < 65 years ($NZ 9,400 per QALY). By ethnicity, the health gains were larger for Māori, but so too were the costs, meaning the cost-effectiveness was roughly comparable between ethnic groups.
Conclusions:Such a nurse-led CCC intervention in New Zealand has acceptable cost-effectiveness for stage III colon cancer, meaning it probably merits funding. Each CCC programme will differ in its likely health gains and costs, making generalisation from this evaluation to other CCC interventions difficult. However, this evaluation suggests that CCC interventions that increase coverage of, and reduce time to, effective treatments may be
cost-effective.
Keywords:Care coordinators, Patient navigators, Economic evaluation, Cost-effectiveness, Cost-utility analysis, Colon cancer
* Correspondence:nisha.nair@otago.ac.nz
1Burden of Disease Epidemiology, Equity, and Cost-Effectiveness (BODE3)
Programme, Department of Public Health, University of Otago Wellington, PO Box 7343, Wellington, New Zealand
Full list of author information is available at the end of the article
Background
Cancer care can be complex for patients to navigate. Partly in response to this, there has been an increasing emphasis on cancer care coordinator roles (CCC; also known as patient navigators, key workers, one to one support workers, liaison officers, coordination officers, and case management nurses) to improve patient out-comes within cancer care services, especially among lower socio-economic populations [1, 2]. Providing bet-ter coordinated care for cancer patients has been identi-fied by the National Institute for Health and Care Excellence (NICE) as essential to enabling the needs of patients to be identified and met [3]. CCC roles vary in terms of the stage of cancer management on which they focus, ranging from access to cancer screening, to co-ordination of care following diagnosis, to survivorship support. Evidence of effectiveness is starting to emerge with regards to improving uptake of cancer screening, earlier stage at diagnosis, timeliness of care, adher-ence to treatment, hospital utilisation and patient sat-isfaction [4–13].
Expenditure on cancer care is increasing at an alarm-ing rate worldwide. This increase highlights the need for changes to models of care delivery and a need for evaluations to assist with determining and prioritising cost-effective interventions – including service config-urations in addition to pharmaceuticals and discrete treatments [14]. There are examples of economic ana-lyses of CCC type interventions conducted elsewhere [15–17], but to our knowledge no nurse-led hospital-based cancer coordination intervention has been sub-jected to a rigorous cost-utility analysis [18]. There is considerable uncertainty in the effect and cost of service-level interventions. However, decision-makers still need to prioritise where cancer control resources are deployed. This paper brings together these agendas, using microsimulation modelling incorporat-ing the considerable uncertainties.
Given the diverse nature of CCC programmes, it was not possible to evaluate them generally across all cancer sites. We thus focused on stage III colon cancer for three reasons. First, colon cancer is a‘priority’cancer for which CCC programmes are emerging; second, the treatment pathway requires both surgery and chemo-therapy and therefore more coordination may be re-quired than (say) early stage colon cancer for which surgery alone is considered curative; and third, there is a consensus that adjuvant chemotherapy should be offered following surgery for stage III disease.
There is increasing concern about social inequalities in cancer survival and outcomes, and New Zealand is no exception. For example, Māori (the indigenous popula-tion) have worse survival from cancer that is not fully explained by stage at presentation [19], including for
colon cancer [20]. Part of the reason for these social in-equalities in survival is likely to include differences in re-ceipt of treatments and waiting times to treatments [21], which may be remedied through the CCC programmes.
The objective of this paper is to determine the cost-utility of a CCC intervention in stage III colon cancer, including differences by patient age, sex, ethnicity, and socio-economic status (collectively called socio-demographics from here on). The CCC in question is a clinical nurse spe-cialist who provides support and information to the patient, coordinates the provision of treatment, and identifies and addresses barriers to care.
Methods
Methods are briefly outlined here; more detail is pro-vided in the Additional files. A health system perspective was used; costs and benefits beyond the health system (e.g. productivity costs) were out of scope. Participants were patients with stage III colon cancer in New Zealand, modelled till death, or age 110 years. Costs were in 2011 New Zealand dollars (with conversion of the main incremental cost-effectiveness ratio to US dollars and UK pounds using exchange rates as of March 2013). A 3 % per annum discount rate was applied to costs and benefits.
Intervention and comparator definition
The CCC intervention was defined as a hospital-based clinical nurse specialist (CNS) who is the main point of contact for the patient and a key point of contact for health professionals involved in the patient’s care. This begins at the point of provisional diagnosis of colon can-cer and continues until initiation of chemotherapy for patients with confirmed stage III colon cancer. The CCC role would include: providing information and support for the patient, identifying and addressing patient bar-riers to accessing care (transport/financial/social), coord-inating arrangements for pre-operative assessments and hospital admission, optimising post-operative care, track-ing investigations and appointments, ensurtrack-ing the patient is discussed at a multidisciplinary team meeting, making referrals as necessary, and acting on any administrative delays. (See Additional file 1 for more detail on the CCC intervention).
described in the Input Parameter section below and in Additional file 2. We acknowledge that treatment cover-age and waiting times are also influenced by other re-source constraints (e.g. theatre space/time, staffing, and ward space), and a CCC per se will have little or no im-pact on these structural barriers. It should also be noted that this intervention was conceptualised based on the New Zealand context.
The comparator was business-as-usual i.e. no dedi-cated CCC programme as is common in many countries. In a business-as-usual scenario, needs assessment is pro-vided by a number of different nurses, doctors or other health professionals at various points along the cancer care pathway, followed by referrals to other health ser-vices. No one individual is responsible for tracking refer-rals, investigations or appointments and acting on delays, with potential for tasks to be duplicated or missed. (See Additional file 1 for more detail on the comparator).
Model overview
We constructed a discrete event simulation model (DES; a form of microsimulation) to address our research question. Modelling was conducted in Tree Age Pro 2012. A DES model was chosen as it allows“jumping”from the time of one‘event’to the time of the next event, making it particu-larly useful when patients are subject to competing events. There were four competing events in our case: time to death from colon cancer, time to death from other causes, time to surgery, and time to start of chemotherapy. The first three‘compete’at diagnosis. If the patient makes it to surgery, then deaths from cancer, death from other causes and time to chemotherapy are the three competing events. And if the patient makes it to chemotherapy, the two (absorbing) death states are the remaining competing events (see Figure 1 for model structure overview). The main model outputs were health gain (in quality-adjusted life-years or QALYs), incremental costs, and incremental cost-effectiveness ratios (ICERs).
Input parameters
Selected input parameters are shown in Tables 1 and 2, and summarised in the text below. A full input parameter table and further explanation is provided in Additional
file 2. Most input parameters have a best estimate (‘expected value’). To capture the lack of perfect knowledge around each input parameter (input parameter uncertainty), a probability distribution around the expected value was usually defined.
Baseline incidence, survival and mortality data
The estimated incidence rates of colon cancer were cal-culated across all combinations of sex, age, ethnicity (Māori, non-Māori), and socio-economic status (three levels) from New Zealand Cancer Registry data. These were disaggregated by ethnicity and deprivation using linked census-cancer data (as described elsewhere) [22]. This was further restricted to those with stage III colon cancer, and disaggregated by receipt of surgery and chemotherapy [23].
Colon cancer mortality rates (by time since diagnosis and socio-demographics) were estimated using excess mortality rate modelling on cancer registry data linked to mortality data. These rates were then adjusted to be specific to stage III colon cancer and receipt of surgery and chemotherapy (see Additional file 2). Background population mortality rates were derived from socio-demographic life tables [24].
Baseline waiting times to surgery and chemotherapy, and baseline coverage of chemotherapy
Baseline waiting times to surgery and waiting times from surgery to chemotherapy (without a CCC) by socio-demographics were estimated using data from a previous New Zealand hospital notes review study of over 600 colon cancer patients diagnosed between 1996 and 2003 [20]. Baseline coverage of chemotherapy was calculated for those who were eligible and did not refuse treatment, by age and socio-demographic group (see Additional file 2).
Effect of a CCC
As mentioned earlier, we specified that the health gain from a CCC intervention would be via four effects: redu-cing time from provisional diagnosis to surgery, reduredu-cing time from surgery to chemotherapy, improving the coverage of chemotherapy (there was little room for improvement in coverage of surgery) and reducing
[image:3.595.62.539.626.720.2]patients’ anxiety during diagnosis and treatment (thus improving patients’quality of life).
We undertook systematic literature searches to deter-mine the impact a CCC might have on increasing chemotherapy coverage, reducing waiting times (to sur-gery and from sursur-gery to chemotherapy), and improving quality of life for cancer patients (see Additional file 3). Evidence for most of these was sparse. The only available source for estimating the impact of a CCC on improving receipt of chemotherapy was a study by Goodwin et al., assessing a CCC-type intervention in older patients with breast cancer in the United States [25]. Similarly, in order to estimate the impact of a CCC on reducing time from diagnosis to surgery as well as from surgery to chemotherapy, we drew on a retrospective case series ana-lysis by Haideri et al., [10] again assessing the effect of a CCC-type intervention in women with breast cancer. The
impact of a CCC on anxiety reduction and thus quality of life was estimated based on a study by Ferrante et al., [8] looking at the effect of a patient navigator on reducing anx-iety after an abnormal mammogram. The available evi-dence was complemented by consultation with health professionals from different cancer centres (medical on-cologist, colorectal surgeon, oncology nurses) in order to source estimates and specify distributions.
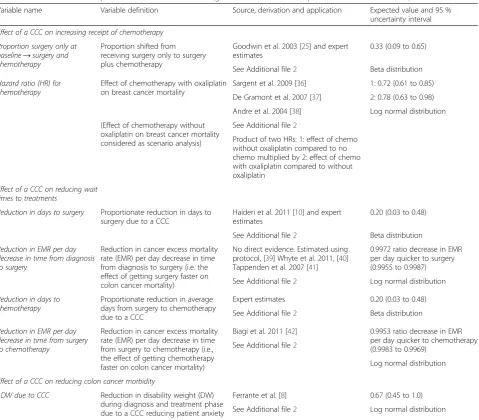
[image:4.595.60.540.97.517.2]The key parameters for effect of a CCC are showed in Table 1, with more detail provided in Additional file 2. We deliberately specified generous uncertainty for each of these input parameters given the lack of robust published evidence. For example, we estimated that a CCC would improve the coverage of chemother-apy by 33 % (but with the 95 % uncertainty interval ranging from 9 to 65 %), and reduce the time between surgery and chemotherapy by 20 % (ranging from 3 to
Table 1Selected effect size parameters used in the model (greater detail and full list provided in Additional file 2)
Variable name Variable definition Source, derivation and application Expected value and 95 % uncertainty interval
Effect of a CCC on increasing receipt of chemotherapy Proportion surgery only at
baseline→surgery and chemotherapy
Proportion shifted from receiving surgery only to surgery plus chemotherapy
Goodwin et al. 2003 [25] and expert estimates
0.33 (0.09 to 0.65)
See Additional file2 Beta distribution
Hazard ratio (HR) for chemotherapy
Effect of chemotherapy with oxaliplatin on breast cancer mortality
Sargent et al. 2009 [36] 1: 0.72 (0.61 to 0.85)
De Gramont et al. 2007 [37] 2: 0.78 (0.63 to 0.98)
Andre et al. 2004 [38] Log normal distribution
(Effect of chemotherapy without oxaliplatin on breast cancer mortality considered as scenario analysis)
See Additional file2
Product of two HRs: 1: effect of chemo without oxaliplatin compared to no chemo multiplied by 2: effect of chemo with oxaliplatin compared to without oxaliplatin
Effect of a CCC on reducing wait times to treatments
Reduction in days to surgery Proportionate reduction in days to surgery due to a CCC
Haideri et al. 2011 [10] and expert estimates
0.20 (0.03 to 0.48)
See Additional file2 Beta distribution
Reduction in EMR per day decrease in time from diagnosis to surgery
Reduction in cancer excess mortality rate (EMR) per day decrease in time from diagnosis to surgery (i.e. the effect of getting surgery faster on colon cancer mortality)
No direct evidence. Estimated using protocol, [39] Whyte et al. 2011, [40] Tappenden et al. 2007 [41]
0.9972 ratio decrease in EMR per day quicker to surgery (0.9955 to 0.9987)
Log normal distribution See Additional file2
Reduction in days to chemotherapy
Proportionate reduction in average days from surgery to chemotherapy due to a CCC
Expert estimates 0.20 (0.03 to 0.48)
See Additional file2 Beta distribution
Reduction in EMR per day decrease in time from surgery to chemotherapy
Reduction in cancer excess mortality rate (EMR) per day decrease in time from surgery to chemotherapy (i.e., the effect of getting chemotherapy faster on colon cancer mortality)
Biagi et al. 2011 [42] 0.9953 ratio decrease in EMR per day quicker to chemotherapy (0.9983 to 0.9969)
See Additional file2
Log normal distribution
Effect of a CCC on reducing colon cancer morbidity
↓DW due to CCC Reduction in disability weight (DW) during diagnosis and treatment phase due to a CCC reducing patient anxiety
Ferrante et al. [8] 0.67 (0.45 to 1.0)
48 %). For practical purposes, more effort was invested in estimating those input parameters where the uncertainty contributed significantly to overall ICER uncertainty (see Additional file 2 and Figs. 3 and 4 for such‘key’parameters).
Quality-adjusted life-years (QALYs) and disability weights
QALYs use many different health status valuation methods e.g. EuroQol (EQ5D) and the Health Utilities Index questionnaire. We used disability weights (DWs, where 0 is perfect health and 1.0 is equivalent to death) adapted from the Global Burden of Disease 2010 [26, 27]. Accordingly, we use the term QALYDW in the Methods and Results section of this paper (but default to QALYs elsewhere).
Disability weights (DWs) were applied separately to four phases of colon cancer disease, by merging the recent Global Burden of Disease 2010 DWs (given for cancers overall) [27] with the relative difference in DW by cancer in the Australian BDS colorectal cancer model [26]. The phases were diagnosis and treatment, remis-sion, pre-terminal and terminal, and the durations and attendant DWs are shown in Additional file 2. We also allow for sex- and age-specific background morbidity, using the expected level of background morbidity for all diseases combined from a recent New Zealand burden of disease study [28]. For example, for a 70–74 year old with an expected background morbidity equivalent to a DW of 0.3 and who was in the diagnosis and treatment (DT) phase of colon cancer (DW of DT phase = 0.288),
their QALYDW per annum was (1–0.3)X (1–0.288) = 0.498. QALYsDW continued to be tallied in the model beyond the cure time (eight years post diagnosis) to death from other causes, or age 110 if still alive.
Health system costs
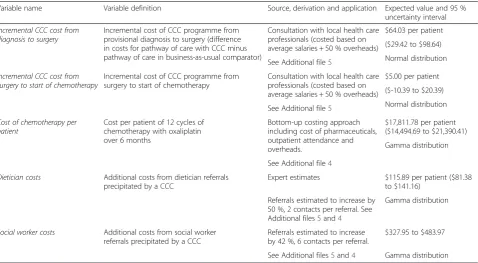
The health system costs were determined by strata of sex and age using a dataset of (nearly) all New Zealanders with their health system events (e.g. hospitalisation, lab test) all ascribed a cost. Following Van Baal et al. [29], we separately determined expected costs for those in the last six months of life. A critical health system cost for our model was that for chemotherapy, as many people moved from having surgery only to receiving chemotherapy post-operatively. We estimated the cost of chemotherapy at $NZ 17,812 per six month treatment per patient using a bottom-up costing approach including the cost of the pharmaceuticals, outpatient attendance and overheads (see Additional file 4). As with QALYsDW, health system costs continued to be tallied in the model beyond the cure time (eight years post diagnosis) to death from other causes or age 110 if still alive.
Incremental cost of CCC
[image:5.595.60.539.99.362.2]The CCC intervention pathway was specified following review of the literature and consultation with local health care professionals, then costed (Additional files 1 and 5). The incremental cost of the CCC intervention is the cost of the care pathway with a CCC in place minus
Table 2Selected cost parameters used in the model (greater detail and full list provided in Additional files 5 and 4)
Variable name Variable definition Source, derivation and application Expected value and 95 % uncertainty interval
Incremental CCC cost from diagnosis to surgery
Incremental cost of CCC programme from provisional diagnosis to surgery (difference in costs for pathway of care with CCC minus pathway of care in business-as-usual comparator)
Consultation with local health care professionals (costed based on average salaries + 50 % overheads)
$64.03 per patient
($29.42 to $98.64)
Normal distribution See Additional file5
Incremental CCC cost from surgery to start of chemotherapy
Incremental cost of CCC programme from surgery to start of chemotherapy
Consultation with local health care professionals (costed based on average salaries + 50 % overheads)
$5.00 per patient
($-10.39 to $20.39)
Normal distribution See Additional file5
Cost of chemotherapy per patient
Cost per patient of 12 cycles of chemotherapy with oxaliplatin over 6 months
Bottom-up costing approach including cost of pharmaceuticals, outpatient attendance and overheads.
$17,811.78 per patient ($14,494.69 to $21,390.41)
Gamma distribution
See Additional file4
Dietician costs Additional costs from dietician referrals precipitated by a CCC
Expert estimates $115.89 per patient ($81.38 to $141.16)
Referrals estimated to increase by 50 %, 2 contacts per referral. See Additional files5and4
Gamma distribution
Social worker costs Additional costs from social worker referrals precipitated by a CCC
Referrals estimated to increase by 42 %, 6 contacts per referral.
$327.95 to $483.97
the cost of the care pathway in the business-as-usual comparator. To determine the time spent on coordinat-ing activities where no CCC exists in the business-as-usual comparator, we calculated the cost per minute of coordinating activity being carried out based on the average salaries (plus 50 % overheads) of the personnel carrying out the activity. The incremental cost of the CCC programme itself is modest (e.g. expected values of $64.03 and $5.00 from provisional diagnosis to surgery and between surgery and chemotherapy, respectively). This is because whilst a CCC is introduced, other re-sources such as surgeon and nurse time previously spent on coordinating activities are released for use elsewhere. We also included the costs for increased allied health re-ferrals precipitated by the CCC.
Analyses
There is often considerable uncertainty in estimates of cost, health gain, and cost-effectiveness. This uncertainty comes from two sources: input parameter uncertainty (uncertainty about input parameters due to lack of per-fect knowledge) and model structure uncertainty (uncer-tainty about the assumptions implicit in the model structure). Additionally, results also vary due to hetero-geneity (differences by patient or population characteris-tics such as age, sex, ethnicity, and socio-economic status) [30]. We conducted a range of analyses to ad-dress input parameter uncertainty, heterogeneity, and model structure uncertainty. The types of analyses we conducted are described briefly below:
Main model analysis
Our main or full model analysis incorporates input par-ameter uncertainty and heterogeneity. As mentioned earlier, for input parameters where there is considerable uncertainty, a probability distribution around the best estimate is defined. Our main analysis captures input parameter uncertainty through a ‘looped’ or nested Monte Carlo simulation approach, involving millions of simulations in total. This approach is described in detail by Koerkamp et al. [30]. The effect of this input param-eter uncertainty is then presented as 95 % uncertainty intervals (UIs) for QALYsDW, incremental costs, and ICERs. These main results’can be presented for all stage III colon cancer patients combined, but also separately by heterogeneous patient types (e.g. different ethnic groups, young and old) – so called ‘heterogeneity analyses’.
Expected value analysis
This analysis uses only expected or central values for each input parameter; it does not allow for input param-eter uncertainty. Such analyses are much quicker to run.
We used this approach for a number of sensitivity and scenario analyses.
Ethnic equity analysis
The main analysis allows for variation in survival, mor-bidity and baseline times to event by ethnic group. While this approach uses the best available data, it also means that we value a life saved for Māori less than that for non-Māori. This is due to the fact that the higher ex-pected background morbidity and lower life expectancy for Māori limits the QALYsDW that can be gained. Therefore, we also undertook an ‘equity analysis’ where we applied the non-Māori least deprived background mortality rates and the non-Māori average background morbidity to Māori.
Scenario analyses
We re-ran models for a range of scenarios to assess the impact of changing various model structure assump-tions, such as the discount rate.
One-way sensitivity analyses
We also undertook a range of one-way sensitivity ana-lyses and Tornado plots [31], using the 2.5th and 97.5th percentile values of input parameters, to assess which in-put parameters contributed the most to uncertainty in the model outputs (i.e. QALYDW, cost and ICER).
Ethics
This analysis was conducted within the Burden of Disease Epidemiology, Equity, and Cost-Effectiveness (BODE3) re-search programme. The BODE3programme is in compli-ance with the Helsinki Declaration. The Health and Disability Ethics Committee confirmed ethical approval was not required for BODE3under section 11.8 and 11.9 of the New Zealand National Ethics Advisory Committee (NEAC) Guidelines for Observational Studies, as ethical approval is not required for secondary use of data for the purpose of quality assurance or outcome analysis when undertaken by those employed by the health service pro-vider holding the information.
Results
Main model analysis
Figure 2 and Table 3 present the findings from our main model analysis. They depict uncertainty in incremental costs and QALYsDWgained, due to input parameter un-certainty (model 1 in Table 3 and solid markers in Fig. 2). They additionally depict variation due to heterogeneity across sex, age, ethnicity and deprivation (model 2 in Table 3 and crosses in Fig. 2). We focus on the former here, and consider heterogeneity below.
$NZ 2,271 (95 % UI $1,225 to $3,641). Accordingly, the ICER was $NZ 18,881 per QALYsDW gained (≈ $US 15,600,≈£UK 10,300) with relatively narrow uncertainty ($NZ 13,442 to $24,610) compared to the uncertainty in both QALYsDW and cost due the strong correlation of increasing cost with increasing QALYsDW (depicted graphically as the eclipse cloud in Fig. 2). This is because a key health benefit of CCC is increased coverage of chemotherapy, which is also a key cost driver.
Heterogeneity analysis
There is a much larger scatter of points on the cost-effectiveness plane in Fig. 2 when variation by patient heterogeneity (sex, age, ethnicity and deprivation) in addition to input parameter uncertainty is depicted. Model outputs vary by these socio-demographics due to
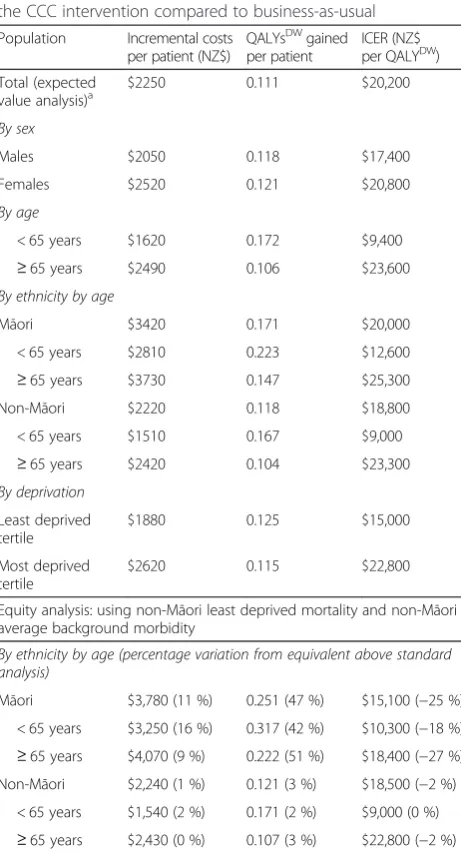
differences in inputs of time to event (surgery, chemo-therapy, death from cancer and death from other causes) and expected population morbidity. Table 4 shows the expected value analysis outputs by socio-demographics. Variation by sex is modest. However, variation by age is large with decreased cost and (modestly) increased QALYsDW gains among younger patients, leading to a more favourable ICER ($9,400). By socio-economic deprivation, the cost is greater for more deprived people, but the QALYsDW gains less leading to a worse ICER ($22,800).
There are large differences in age structure by ethni-city in New Zealand, so we focus on the ethniethni-city by age comparisons. Within young and old, the incremental cost and QALYsDW gained are both estimated to be lar-ger for Māori and the ICER modestly higher for Māori (e.g. $25,300 for Māori≥65 years compared to $23,300 for non-Māori≥65 years).
Scenario analyses
Table 5 shows how the findings vary for scenario ana-lyses about model assumptions and structure. As men-tioned earlier, for practical purposes the scenario analyses use expected values of the input parameters, not the full uncertainty about the input parameters.
The impact of the CCC intervention on quality of life (by reducing the anxiety of patients) and improved sur-vival due to getting to surgery quicker were modest drivers of our analysis. Conversely, increased coverage of chemotherapy and getting to chemotherapy quicker were major drivers of model outputs. For example, ex-cluding any effect on the number of patients getting chemotherapy reduced the incremental cost by 64 %.
[image:7.595.57.540.89.244.2]The majority of health gain and cost from a CCC oc-curred in the post-surgical phase, due to increased coverage of chemotherapy and decreased time to chemotherapy. The ICER was less ($9,100) for the
Table 3Main model analysis: incremental costs, QALYsDW gained and ICERs for the CCC intervention compared to business-as-usual
Incremental costs per patient (NZ$)
QALYsDW) gained per patient
ICER (NZ$ per QALYDW)
Model 1: Averaged over heterogeneity and stochastic variation; input parameter uncertainty only
Mean $ 2,271 0.121 $ 18,881
2.5 % percentile $ 1,225 0.070 $ 13,442
Median $ 2,226 0.119 $ 18,786
97.5 % percentile $ 3,641 0.185 $ 24,610
Model 2: Averaged over stochastic variation; both heterogeneity and input parameter uncertainty included in distribution of outputs
Mean $ 2,239 0.120 $ 23,393
2.5 % percentile $ 992 0.036 $ 6,290
Median $ 1,972 0.113 $ 17,864
97.5 % percentile $ 5,007 0.252 $ 72,041
Dollars are NZ$, for the year 2011. All costs and benefits discounted at 3 % per annum
[image:7.595.56.289.534.715.2]provisional diagnosis to surgery component of the inter-vention (less health gain and also less cost). Varying the discount rate had a moderate impact in an expected manner.
If we excluded the expected population morbidity, the QALYsDW gained increased due to no assumed loss of quality of life in survivors, and therefore the ICER re-duced by 27 %. A life-years gained analysis resulted in a similar ICER.
Scaling up and down the health system costs (exclud-ing chemotherapy) had a modest impact only, but ex-cluding the assumed increased referrals to dieticians and social workers reduced costs by 23 %. Finally, our most comprehensive model included unrelated health system costs into the future, and if these are excluded the (dis-counted at 3 %) costs decrease by 21 %.
Ethnic equity analysis
Applying non-Māori least deprived mortality and non-Māori average background morbidity to both Māori and non-Māori resulted in an increase in the QALYsDW gained by 47 % for Māori and a reduction in the ICER by 25 % such that it becomes lower for Māori compared to non-Māori ($15,100 compared to $18,500; Table 4).
One-way sensitivity analyses
Uncertainty in the following four input parameters has the biggest impact on uncertainty in model outputs (Figs. 3 and 4): the proportionate reduction in days to chemotherapy (QALYsDWand ICER), increased coverage of chemotherapy (QALYsDW, cost and ICER), improved survival from getting chemotherapy quicker (QALYsDW and ICER), and cost per patient of chemotherapy (cost and ICER).
Discussion
[image:8.595.58.289.110.537.2]We find that CCCs, for colon cancer stage III at least, are cost-effective for a willingness to pay of NZ$20,000 (about US$16,500; using mean value) or NZ$25,000 (about US$ 21,000; using the upper uncertainty limit). The major drivers of health gain come from increased coverage of effective treatments and reduced time to ef-fective treatments via better coordination of care, a con-clusion that should be generalisable to other CCC programmes. Impacts through changes in quality of life, if just during the delivery of the programme itself, are unlikely to be a major driver of health gains. We found substantial heterogeneity, in that health gains were greater and costs less for younger patients resulting in better cost-effectiveness. However, this cost variation by age may not be generalisable to other CCC interven-tions, as in our evaluation young people in the‘ business-as-usual’ comparator were already almost all receiving chemotherapy – the key cost driver. Social inequalities in health are a major policy concern worldwide [32]. There are large health inequalities between Māori and non-Māori in New Zealand [33], including for colon cancer survival [20]. Our evaluation suggests that CCC would achieve greater health gains for Māori patients due to lower receipt of chemotherapy and longer wait times in the business-as-usual arm. However, this find-ing is contfind-ingent on our assumption that the propor-tionate increase in chemotherapy coverage, and
Table 4Main model analysis by sex, age, ethnicity, and deprivation: incremental costs, QALYsDWgained and ICERs for the CCC intervention compared to business-as-usual
Population Incremental costs per patient (NZ$)
QALYsDWgained per patient
ICER (NZ$ per QALYDW)
Total (expected value analysis)a
$2250 0.111 $20,200
By sex
Males $2050 0.118 $17,400
Females $2520 0.121 $20,800
By age
< 65 years $1620 0.172 $9,400
≥65 years $2490 0.106 $23,600
By ethnicity by age
Māori $3420 0.171 $20,000
< 65 years $2810 0.223 $12,600
≥65 years $3730 0.147 $25,300
Non-Māori $2220 0.118 $18,800
< 65 years $1510 0.167 $9,000
≥65 years $2420 0.104 $23,300
By deprivation
Least deprived tertile
$1880 0.125 $15,000
Most deprived tertile
$2620 0.115 $22,800
Equity analysis: using non-Māori least deprived mortality and non-Māori average background morbidity
By ethnicity by age (percentage variation from equivalent above standard analysis)
Māori $3,780 (11 %) 0.251 (47 %) $15,100 (−25 %)
< 65 years $3,250 (16 %) 0.317 (42 %) $10,300 (−18 %)
≥65 years $4,070 (9 %) 0.222 (51 %) $18,400 (−27 %) Non-Māori $2,240 (1 %) 0.121 (3 %) $18,500 (−2 %)
< 65 years $1,540 (2 %) 0.171 (2 %) $9,000 (0 %)
≥65 years $2,430 (0 %) 0.107 (3 %) $22,800 (−2 %)
All models are expected value only; there is no parameter uncertainty Dollars are NZ$, for the year 2011. All costs and benefits discounted at 3 % per annum. All values rounded to three meaningful decimal places a
proportionate reduction in time to chemotherapy from CCC, is constant across ethnic groups. When we con-duct an equity analysis with background mortality and morbidity rates held constant by ethnic group, we find greater ‘equity weighted’ health gains for Māori and a comparable ICER between Māori and non-Māori. In-corporating equity in cost-effectiveness evaluations is an under-developed area. Previous researchers have also attempted incorporating equity [34]; our approach should be taken as one possible method to consider and subject to further scrutiny.
Health economic decision models are conducted to as-sist prioritisation of resources. Questions that decision-makers want answered often require collating data that is uncertain, and making justified assumptions. Whilst we have high quality New Zealand data for many of the baseline parameters in our model (e.g. survival by socio-demographics), our evaluation still has many uncertain input parameters (e.g. the effect of a CCC). Despite that, we believe that we have demonstrated that with careful parameter specification and most particularly inclusion of (appropriately) wide uncertainty can still lead to
useful conclusions. Through our scenario (Table 5) and sensitivity analyses (Figs. 3 and 4), we think we have pro-vided enough alternative analyses for interested readers who disagree with our parameterisation and assumptions to find something that accords with their‘prior’. Regard-ing our own best estimates and’prior’, we conclude that CCC for stage III colon cancer at least is probably cost-effective and pro-equity.
[image:9.595.57.538.111.402.2]We are aware of three cost-effectiveness analyses (CEAs; two for breast cancer and one for any ter-minal cancer patient) [15–17] and one cost-benefit analysis [35] of CCC-type interventions. It is difficult to compare our results with these previous evalua-tions due to the different cancers, variation in where the CCC intervention was provided in the cancer care pathway, and different approaches in the economic analyses. In short, one study found the CCC-type inter-vention was no different in cost to usual care and did im-prove quality of life indicators [17], another found no improvement in quality of life outcomes but a reduction in costs with the intervention [15], and a third showed an incremental cost per life year gained of $US 95,625 (from
Table 5Scenario analyses: incremental costs, QALYsDWgained and ICERs for the CCC intervention compared to business-as-usual (percentage difference to expected value analysis in parentheses)
Scenario Incremental costs per
patient (NZ$)
QALYsDWgained
per patient
ICER
(NZ$ per QALYDW)
Expected value analysisa $2,250 0.111 $20,200
Varying phases of CCC intervention
a. CCC from diagnosis to surgery only $80 (−96 %) 0.009 (−92 %) $9,100 (−55 %)
b. CCC from surgery to chemotherapy only $2,170 (−4 %) 0.104 (−6 %) $20,900 (3 %)
Variations to discount rate
c. 0 % per annum discount rate $2,520 (12 %) 0.148 (33 %) $17,100 (−15 %)
d. 6 % per annum discount rate $2,080 (−8 %) 0.088 (−21 %) $23,600 (17 %)
Variation to epidemiological parameters
e. Set all DWs (incl pYLDs) to zero (=‘life years’gained) $2,250 (0 %) 0.150 (35 %) $15,000 (−26 %)
f. Exclude improved quality of life impact of CCC $2,250 (0 %) 0.100 (−10 %) $22,400 (11 %)
g. Exclude improved survival due to quicker to surgery $2,240 (0 %) 0.107 (−4 %) $21,000 (4 %)
h. Exclude improved survival due to quicker to chemotherapy $2,130 (−5 %) 0.084 (−24 %) $25,200 (25 %)
i. Exclude increasing % of patients getting chemotherapy $800 (−64 %) 0.061 (−45 %) $13,000 (−36 %)
j. Exclude oxaliplatin $2,020 (−10 %) 0.095 (−14 %) $21,300 (5 %)
Variation to cost parameters
k. Scale all health system costs up 20 % $2330 (4 %) 0.111 (0 %) $20900 (3 %)
l. Scale all health system costs down 20 % $2170 (−4 %) 0.111 (0 %) $19500 (−3 %)
m. Exclude dietician and social worker intervention costs $1730 (−23 %) 0.111 (0 %) $15600 (−23 %)
n. Exclude unrelated health system costs (i.e. include costs up to cure time only) $1780 (−21 %) 0.111 (0 %) $16000 (−21 %)
All models are expected value only; there is no parameter uncertainty
Dollars are NZ$, for the year 2011. Unless stated otherwise, all costs and benefits discounted at 3 % per annum. All values rounded to three meaningful decimal places
pYLDsprevalent years of life lived with disability, which is used as the‘expected’amount of morbidity by sex, age and ethnicity a
abnormal screening to diagnostic follow-up for breast can-cer patients). Unlike our model, one of the CEAs assessed the effect of patient navigators in a specific population (low-income, ethnic minority and 40 years or older) [15]; a strength of our evaluation is the explicit incorporation of heterogeneity by sex, age, ethnicity and deprivation per-mitting evaluations by type of patient (Table 4). Other relative strengths of our evaluation include the systematic reviews for each key input parameter (although the studies found were often poor quality), input obtained from perts where there was a lack of published data, clear ex-planations for assumptions where they were made (Additional file 2), inclusion of both morbidity and
mortality, and probabilistic sensitivity analysis. In con-trast, two of the CEAs [15, 17] were conducted alongside randomised controlled trials with access to raw data for quality of life measures and cost data; we relied on data collected from a resource use sur-vey for our cost data.
We cannot directly generalise our evaluation for stage III colon cancer patients to other settings, but we may be able to extrapolate in terms of principle. For ex-ample, we would expect health gains to be less if there is already good coordination in place through means other than CCC such as well functioning multi-disciplinary meetings and good IT systems for tracking Fig. 3Tornado plot for QALYs gained (top axis) and cost (bottom axis) for 2.5thand 97.5thpercentile values of input parameters. Above values are for single parameter values only. That is, the 2.5th (or 97.5th) percentile value of the parameter itself, and the mean expected value of all remaining parameters in the table, are modelled. There is no modelled parameter uncertainty. The estimates are averaged over heterogeneity and stochastic variation. EMR = excess mortality rate (due to cancer); CCC = cancer care coordinator
Fig. 4Tornado plot for ICER for 2.5thand 97.5thpercentile values of input parameters. EMR = excess mortality rate (due to cancer); CCC = cancer
[image:10.595.60.540.91.295.2] [image:10.595.60.541.524.703.2]patient care. However, costs would also be less, mean-ing the ICER may not be too different. Second, our evaluation demonstrates that increasing receipt of effective treatments and reducing time to effective treatments is the major benefit of a CCC programme, not the quality of life impacts per se.
Whilst decision-makers need information now, and our study responds to that imperative, there is considerable uncertainty in the input parameters (as shown in Figs. 2, 3 and 4). Regarding stage III colon cancer per se, it is the uncertainty in these three intervention effects that matters most: how much the CCC reduces time to chemotherapy, what proportion of those eligible for chemotherapy but not receiving it pre-CCC receive it post-CCC; and the im-provement in survival from getting chemotherapy quicker. Research, such as randomised trials of CCC, to estimate these parameters with greater accuracy would increase the accuracy of modelling such as our study. Second, under-taking similar evaluations for different phases of the can-cer patient journey (e.g. support during remission) and different cancers (e.g. lung cancer where treatment effi-cacy is less, or breast cancer where survival is better and reducing time to treatment is perhaps not so critical) is necessary to have a greater understanding of where CCC should be prioritised within the full range of cancer services.
Conclusions
For stage III colon cancer, we estimate that CCCs do improve health outcomes, and is a cost-effective inter-vention for younger patients at least. It also appears – in the New Zealand context at least–to afford as much if not more benefit to Māori patients who usually have worse outcomes, with approximately the same cost-effectiveness as the general population. Thus, the inter-vention is probably pro-equity. Generalising to CCC for other phases of the cancer patient journey, and other cancers, is difficult due to differing baseline patient journeys, survival rates and treatment efficacy. How-ever, our study suggests that CCCs that increase receipt of, and minimise time to, effective treatments should be prioritised.
Additional files
Additional file 1:Provides additional details on definition of
intervention and comparator.(PDF 419 kb)
Additional file 2:Provides additional details on the model and
input parameters within the model.(PDF 1334 kb)
Additional file 3:Documents the literature search strategies used. (PDF 764 kb)
Additional file 4:Provides additional details on baseline health
system costs by disease state.(PDF 827 kb)
Additional file 5:Contains the event pathway and details of costing
the baseline and intervention.(PDF 752 kb)
Abbreviations
BDS:Burden of Disease Study; BODE3: Burden of Disease Epidemiology, Equity and Cost-Effectiveness Programme; CEA: Cost-effectiveness analyses; CCC: Cancer care coordinators; CNS: Clinical nurse specialist; DES: Discrete event simulation; DT: Diagnosis and treatment; DWs: Disability weights; EMR: Excess mortality rate; HR: Hazard ratio; ICER: Incremental cost-effectiveness ratio; NICE: National Institute for Health and Care Excellence; UIs: Uncertainty intervals; QALY: Quality-adjusted life-year; QALYDW: Quality-adjusted life-year utilising disability weights for health status valuation.
Competing interests
The authors declare that they have no competing interests. The Burden of Disease Epidemiology, Equity and Cost-Effectiveness programme (BODE3) is funded by the Health Research Council of New Zealand (10/248). The funding source had no role in the preparation of this paper.
Authors’contributions
TB obtained funding; conceived and specified the study design and modelling approach; led the interpretation and writing of the main text, and Additional files 2 and 5; and oversaw all aspects of the study. He acts as the guarantor. LC undertook the literature searches; specified the intervention and comparator; led the conceptualisation of the model; led input parameter specification and estimation for the intervention and contributed to other parameter specification; led the resource use surveys and expert knowledge elicitation; assisted with the modelling; led the writing of Additional files 1, 3 and 4; and led initial writing of aspects of the paper and drafting of all other sections of the paper and Additional files. GK contributed to specifying input parameters; led the analyses; and contributed to drafting of all other sections of the paper and Additional files. NN contributed to drafting the paper and parts of the Additional files. RF contributed to specifying the event pathway and costing of the intervention; and contributed to drafting of all other sections of the paper and Additional files. ED contributed clinical and surgical expertise in the model conceptualisation and specifying the event pathway; and contributed to drafting of the paper. DS contributed to the study design; and contributed to drafting of the paper. All authors read and approved the final manuscript.
Acknowledgements
We thank other BODE3team colleagues for comments on early versions of
this work. We also thank members of our Cancer Interventions Advisory Group for their input, in particular Drs Andy Simpson and John Childs. We acknowledge the invaluable input from Maria Stapleton, Catherine Birch, Jenny Keane, Paul Smith, Sue Wolyncewicz, Sarah Kelcher, Anita Frew, and Owen Ashwell for communications and advice on the intervention pathway, and other people who took part in the resource use survey. June Atkinson assisted with specification of health system costs, and Tak Ikeda with regressions of colon cancer patient data. Nick Wilson assisted with general comments. Melissa McLeod contributed to the development of the equity analysis.
Author details
1Burden of Disease Epidemiology, Equity, and Cost-Effectiveness (BODE3)
Programme, Department of Public Health, University of Otago Wellington, PO Box 7343, Wellington, New Zealand.2Department of Surgery, University
of Otago Wellington, PO Box 7343, Wellington, New Zealand.
Received: 30 April 2014 Accepted: 24 July 2015
References
1. Guadagnolo BA, Dohan D, Raich P. Metrics for evaluating patient navigation during cancer diagnosis and treatment : Crafting a policy-relevant research agenda for patient navigation in cancer care. Cancer. 2011;117(15 Suppl):3563–72.
2. Paskett ED, Harrop JP, Wells KJ. Patient navigation: an update on the state of the science. CA Cancer J Clin. 2011;61(4):237–49.
4. Percac-Lima S, Grant RW, Green AR, Ashburner JM, Gamba G, Oo S, et al. A culturally tailored navigator program for colorectal cancer screening in a community health center: a randomized, controlled trial. J Gen Intern Med. 2009;24(2):211–7.
5. Dietrich AJ, Tobin JN, Cassells A, Robinson CM, Greene MA, Sox CH, et al. Telephone care management to improve cancer screening among low-income women. Ann Intern Med. 2006;144:563–71.
6. Gabram SG, Lund MJ, Gardner J, Hatchett N, Bumpers HL, Okoli J, et al. Effects of an outreach and internal navigation program on breast cancer diagnosis in an urban cancer center with a large African-American population. Cancer. 2008;113(3):602–7.
7. Battaglia TA, Roloff K, Posner MA, Freund KM. Improving follow-up to abnormal breast cancer screening in an urban population. A patient navigation intervention. Cancer. 2007;109(2 Suppl):359–67.
8. Ferrante JM, Chen PH, Kim S. The effect of patient navigation on time to diagnosis, anxiety, and satisfaction in urban minority women with abnormal mammograms: a randomized controlled trial. J Urban Health.
2008;85(1):114–24.
9. Schwaderer KA, Proctor JW, Martz EF, Slack RJ, Ricci E. Evaluation of patient navigation in a community radiation oncology center involved in disparities studies: a time-to- completion-of-treatment study. J Oncol Pract. 2008;4(5):220–4.
10. Haideri N, Moormeier J. Impact of patient navigation from diagnosis to treatment in an urban safety Net breast cancer population. J Cancer. 2011;2:467–73.
11. Fillion L, de Serres M, Cook S, Goupil RL, Bairati I, Doll R. Professional patient navigation in head and neck cancer. Semin Oncol Nurs. 2009;25(3):212–21. 12. Ell K, Vourlekis B, Xie B, Nedjat-Haiem FR, Lee PJ, Muderspach L, et al.
Cancer treatment adherence among low-income women with breast or gynecologic cancer: a randomized controlled trial of patient navigation. Cancer. 2009;115(19):4606–15.
13. Petereit DG, Molloy K, Reiner ML, Helbig P, Cina K, Miner R, et al. Establishing a patient navigator program to reduce cancer disparities in the american Indian communities of western south Dakota: initial observations and results. Cancer Control. 2008;15(3):254–9.
14. Sullivan R, Peppercorn J, Sikora K, Zalcberg J, Meropol N, Amir E, et al. Delivering affordable cancer care in high-income countries. Lancet Oncol. 2011;12(10):933–80.
15. Markossian TW, Calhoun EA. Are breast cancer navigation programs cost-effective? Evidence from the Chicago Cancer Navigation Project. Health Policy. 2011;99(1):52–9.
16. Raftery J, Addington-Hall J, Macdonald L, Anderson H, Bland J, Chamberlain J, et al. A randomized controlled trial of the cost-effectiveness of a district co-ordinating service for terminally ill cancer patients. Palliat Med. 1996;10(2):151–61.
17. Ritz L, Nissen M, Swenson K, Farrell J, Sperduto P, Sladek M, et al. Effects of advanced nursing care on quality of life and cost outcomes of women diagnosed with breast cancer. Oncol Nurs Forum. 2000;27(6):923–32.
18. Douglas H, Halliday D, Normand C, Corner J, Bath P, Beech N, et al. Economic evaluation of specialist cancer and palliative nursing: a literature review. Int J Palliat Nurs. 2003;9(10):424–8.
19. Jeffreys M, Stevanovic V, Tobias M, Lewis C, Ellison-Loschmann L, Pearce N, et al. Ethnic inequalities in cancer survival in New Zealand: linkage study. Am J Public Health. 2005;95(5):834–7.
20. Hill S, Sarfati D, Blakely T, Robson B, Purdie G, Chen J, et al. Survival disparities in indigenous and non-indigenous New Zealanders with colon cancer: the role of patient comorbidity, treatment and health service factors. J Epidemiol Community Health. 2010;64(2):117–23.
21. Hill S, Sarfati D, Blakely T, Robson B, Purdie G, Dennett E, et al. Ethnicity and management of colon cancer in New Zealand: do indigenous patients get a worse deal? Cancer. 2010;116(13):3205–14.
22. Costilla R, Atkinson J, Blakely T. Incorporating ethnic and deprivation variation to cancer incidence estimates over 2006–2026 for ABC-CBA. Wellington: Department of Public Health, University of Otago; 2011. 23. Differential Colon Cancer Survival by Ethnicity in New Zealand
[http://www.otago.ac.nz/wellington/departments/publichealth/research/ cancercontrol/projects/otago019908.html]
24. Kvizhinadze G, Blakely T. Projected NZ life tables. In: Burden of Disease Epidemiology, Equity and Cost-Effectiveness Programme (BODE3). Wellington: University of Otago Wellington; 2011.
25. Goodwin JS, Satish S, Anderson ET, Nattinger AB, Freeman JL. Effect of nurse case management on the treatment of older women with breast cancer. J Am Geriatr Soc. 2003;51(9):1252–9.
26. Begg S, Vos T, Barker B, Stevenson C, Stanley L, Lopez A. The burden of disease and injury in Australia 2003. Canberra: AIHW; 2007.
27. Salomon JA, Vos T, Hogan DR, Gagnon M, Naghavi M, Mokdad A, et al. Common values in assessing health outcomes from disease and injury: disability weights measurement study for the Global Burden of Disease Study 2010. Lancet. 2012;380(9859):2129–43.
28. Ministry of Health. Health loss in New Zealand: a report from the New Zealand burden of diseases, injuries, and risk factors study, 2006–2016. Wellington: Ministry of Health; 2013.
29. van Baal P, Feenstra T, Polder J, Hoogenveen R, Brouwer W. Economic evaluation and the postponement of health care costs. Health Econ. 2011;20(4):432–45. 30. Groot Koerkamp B, Stijnen T, Weinstein MC, Hunink MG. The combined analysis of uncertainty and patient heterogeneity in medical decision models. Med Decis Making. 2011;31(4):650–61.
31. Briggs A, Sculpher M, Claxton K. Decision modelling for health economic evaluation. New York: Oxford University Press; 2006.
32. Commission on Social Determinants of Health. Closing the Gap in a Generation: Health equity through action on the social determinants of health. Geneva: The World Health Organization; 2008.
33. Tobias M, Blakely T, Matheson D, Rasanathan M, Atkinson J. Changing trends in indigenous inequalities in mortality: lessons from New Zealand. Int J Epidemiol. 2009;38(6):1711–22.
34. Banham D, Lynch J, Karnon J. An equity-effectiveness framework linking health programs and healthy life expectancy. Aust J Prim Health. 2011;17(4):309–19. 35. Frontier Economics. One to one support for cancer patients: a report
prepared for DH. London: Frontier Economics; 2010.
36. Sargent D, Sobrero A, Grothey A, O’Connell MJ, Buyse M, Andre T, et al. Evidence for cure by adjuvant therapy in colon cancer: observations based on individual patient data from 20,898 patients on 18 randomized trials. J Clin Oncol. 2009;27(6):872–7.
37. De Gramont A, Boni C, Navarro M, Tabernero J, Hickish T, Topham C, et al. Oxaliplatin/5FU/LV in adjuvant colon cancer: Updated efficacy results of the MOSAIC trial, including survival, with a median follow-up of six years. J Clin Oncol. 2007;25:18S.
38. Andre T, Boni C, Mounedji-Boudiaf L, Navarro M, Tabernero J, Hickish T, et al. Oxaliplatin, fluorouracil, and leucovorin as adjuvant treatment for colon cancer. N Engl J Med. 2004;350(23):2343–51.
39. Blakely T, Foster R, Wilson N. Burden of Disease Epidemiology, Equity and Cost-Effectiveness (BODE3) study protocol. In: Burden of disease epidemiology, equity and cost-effectiveness programme. Wellington: University of Otago Wellington; 2012.
40. Whyte S, Walsh C, Chilcott J. Bayesian calibration of a natural history model with application to a population model for colorectal cancer. Med Decis Making. 2011;31:625–41.
41. Tappenden P, Chilcott J, Eggington S, Patnick J, Sakai H, Karnon J. Option appraisal of population-based colorectal cancer screening programmes in England. Gut. 2007;56(5):677–84.
42. Biagi JJ, Raphael MJ, Mackillop WJ, Kong W, King WD, Booth CM. Association between time to initiation of adjuvant chemotherapy and survival in colorectal cancer: a systematic review and meta-analysis. Jama. 2011;305(22):2335–42.
Submit your next manuscript to BioMed Central and take full advantage of:
• Convenient online submission
• Thorough peer review
• No space constraints or color figure charges
• Immediate publication on acceptance
• Inclusion in PubMed, CAS, Scopus and Google Scholar
• Research which is freely available for redistribution