Rochester Institute of Technology
RIT Scholar Works
Theses
Thesis/Dissertation Collections
3-1-1994
Simulation of simultaneous heat and moisture
transfer in a porous media with heated boundries
Kim Thomas
Follow this and additional works at:
http://scholarworks.rit.edu/theses
Recommended Citation
SIMULATION
OF
SIMULTANEOUS HEAT AND MOISTURE TRANSFER IN A POROUS
MEDIA WITH HEATED BOUNDARIES
by
Kim M. Thomas
A Thesis Submitted
In
Partial Fulfillment ofthe
Requirements for the Degree of
MASTER OF SCIENCE
In
Mechanical Engineering
Approved by:
Prof.
Frank Sciremammano, Jr.
(Thesis Advisor)
Gerald Domoto
(Thesis Advisor-Xerox Research)
Prof.
Alan H. Nye
Prof.
Charles Haines
(Department Head)
Department of Mechanical Engineering
College of Engineering
Rochester Institute of Technology
Rochester, New York
Thesis Title
SIMULATION OF SIMULTANEOUS
HEAT AND MOISTURE TRANSFER IN A POROUS MEDIA
WITH HEATED BOUNDARIES
I,
Kim
M. Thomas, hereby grant permission to the Wallace Memorial Library of the
Rochester Institute of Technology to reproduce my thesis in whole or in part. Any
reproduction will not be for commercial use or profit.
Table
ofContents
Page
Nomenclature
lList
ofTables &
Figures
iii
Abstract
iv
Acknowledgements
v1.0
Introduction
1
2.0
Literature
Review
5
3.0
Theory
13
3.1
Model
Formulation
13
3.2
Initial,
Reference
&
Boundary
Conditions
17
3.3
Numerical
Solution
19
4.0
Model Validation
20
4.1
Analytical Solution
20
4.2
Crank-Nicholson
Comparison
21
4.3
Comparison
to
Experimental Data
23
5.0
Discussion
ofResults
26
5.1
Symmetric
Case
28
5.2
Asymmetric
Case
39
6.0
Conclusions
52
Nomenclature
cp
specificheat
D
diffusion
coefficienthfg
latent heat
ofvaporizationper unitmassK
paperpermeability
k
mediumthermal conductivity
L
thickness
of mediumm mass
Psat
saturation pressureP
pressureq
energy
sourceterm
R
ideal
gas constantRH
relativehumidity
t
time
T
temperature
u
velocity
wp
paperthickness
X position
Greek
Symbols
a
thermal
diffusivity
e volume
fraction
0
1
initial
"I
boundary
4>
paperporosity (void
fraction)
V
slopeof%
Moisture Content
vs.RH
curveSubscripts
a solid
a air
eff effective
g
gas1
liquid
V vapor
0 reference
00 environment
Superscripts
List
ofTables
& Figures
Tables
Page
4.1
Crank-Nicholson
Comparison Properties
21
4.2
Numerical
vs.Analytical Results
22
5.1
Baseline
Properties
andComputational
Data
26
Figures
1.1
Basic
Fusing
Configuration
2
1.2
Nip
Geometry
3
3.1
Equilibrium Moisture Content
15
3.2
Computational Domain
18
4.1
Liquid /
Solid
Mass Ratio
vs.Position
25
5.1
Liquid Mass
vs.Time: Symmetric Case
29
5.2
Vapor Mass
vs.Time: Symmetric
Case
30
5.3
Energy
vs.Time:
Symmetric Case
32
5.4
Process
Interaction: Symmetric
Case;
80%
RH
35
5.5a
Temperature / Moisture History:
Symmetric
Case;
50%
RH
.36
5.5b
Temperature
vs.Position:
Symmetric Case
38
5.6
Thermal
Conductivity
andRH:
Symmetric Case
@
14msec
.40
5.7
Liquid Mass
vs.Time: Asymmetric
Case
42
5.8
Vapor Mass
vs.Time:
Asymmetric Case
43
5.9
Energy
vs.Time: Asymmetric Case
45
5.10
Process Interaction: Asymmetric
Case;
80%
RH
46
Abstract
A one-dimensional,
time
transient,
heat
transport
modelis developed
using
the
heat
equationto
solvefor
the
internal
temperature
distribution
withheating
from
both boundaries. The
modelincludes
the
effects of moisture onheat
transfer
within ahomogeneous
porousmedium,
in
this
case paper.The
effects of phasechange,
conduction,
and vaportransport
areincluded.
With
the
input
of system properties-initial
papertemperature,
ambient relativehumidity
(RH),
andtemperature
boundary
conditions-the
model computesthe
spatialdistribution
oftemperature,
saturation and vaporpressure,
andliquid
and vapor moisture content.By
matching temperature
curvesfor
various conditions of relative
humidity
using
atrial
and errormethod,
resultsshowed
that the
effectivethermal
conductivity increased
overthe
base
dry
value with
increasing
relativehumidity.
In
the
symmetric casethe
conductivity
increased
as much as2.4X
underinitial
conditions of80%
RH.
Similar modeling
runs with asymmetrictemperature
boundary
conditionsyieldedan effective
thermal conductivity
increase
of3. IX
for
the
80%
RH
case.Acknowledgements
The
successful completionofthis
workcouldonly have
been
done
withthe
help
of
The Xerox Corporation
along
with acoregroup
ofindividuals.
I
wouldlike
to thank the
Xerox
Corporation
for
making
it
possibleto
pursuethis
degree
and
this
study.Also,
thanks to
Jerry
Domoto for his
help
in
formulating
the
theory
andFrank
Sciremammano,
my thesis
advisor,
for
showing interest
in
this
project andhis
help
in
developing
andapplying
the theory.
And
finally,
thanks to
Francesco
Zirilli for
help
in theoretical
and mathematical1.0
Introduction
The
purposeofthis
study
is
to
determine
whatimpact
water absorbedby
paperhas
onthe
heat
transfer
aspect ofthe
fusing
process.To
accomplishthis,
aone-dimensional
time transient
modelhas been
constructed.The
effect ofwater,
in
liquid
and vaporform,
has
been
addedusing
thermodynamic
andexperimental relationships .
Fusing
is
the
last step
in the
xerographicprocess.If
done
properly the
image-producing toner
is
permanently
attachedto the
substrate ofchoice,
normally
paper.
It is
notedthat the modeling
done
here deals
with paper asthe
substrate.
Several
methods existto
accomplishfusing, including
solvent, radiant,
coldroll,
andhot
rollfusing. The
methodusedby
the majority
of manufacturersin
the copy
industry
today
is
hot
rollfusing. In
hot
rollfusing,
the
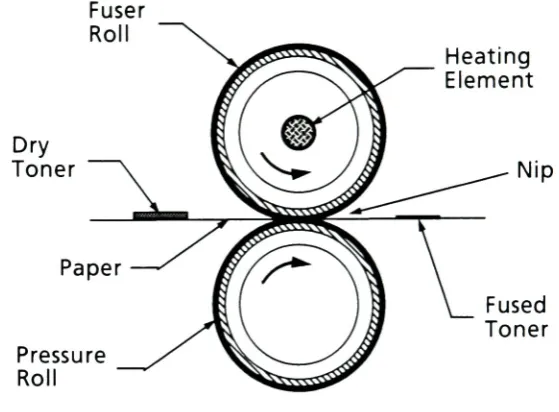
paper withdry
toner
particles,
movesbetween
two
rollers,
the
fuser
roll and pressure roll.The fuser
roll contains aheating
element,
raising it
to
an elevatedtemperature.
The
pressure roll supportsthe
paper againstthe
fuser
roll asit
passes
through the
area wherethe
rollscontact.This
regionis
calledthe
nip.The
resulting
pressureandheat
allowsthe toner to
melt andflow into
the
paper
fibers (see
Figure
1.1).
Upon
completionofthis
processthe
dry
toner
image
has been
melted andFigure 1.1
-Basic Fuser Configuration
Fuser
Roll
Pressure
Roll
Heating
Element
Fused
Toner
Three
parameters are variedto
controlthe
fusing
process:temperature,
load,
and
dwell
time.
The
temperature
referredto
is that
ofthe
fuser
rollsurface andthe
load
is
the
force
per unitarea requiredto
hold
the
fuser
and pressurerolls
in
contactto
create a nip.Dwell
time
is
the
amount oftime that
any
pointresides
in
the
nip.This is
afunction
ofthe
rotational speed ofthe
rolls andthe
length
ofthe nip (dwell time
=nip
width +speed).
In
orderto
understandthe
Figure
1.2
-Nip
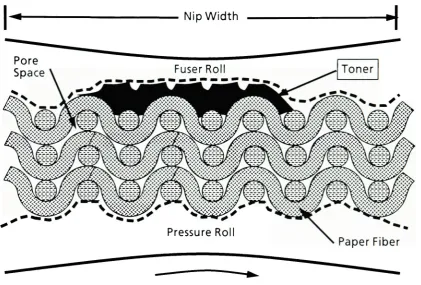
Geometry
Nip
Width
Figure
2.2
shows a generalrelationship
between
the
paper andthe
rollcontactregion
(nip).
The
ratio ofnip
widthto
paperthickness
variesbut
is
onthe
order of
50
:1.
Similarly
the
paperthickness to toner
thickness
ratiovariesand
is roughly 10
:1.
It is important
to transfer the
appropriate amount ofheat from
the
fuser
rollto
[image:12.525.51.473.126.411.2]paper.
The efficiency
oftransferring
the
heat
depends
upon severalvariables.For
example,
many different
materials are usedto
makefuser
andpressurerolls.
These
materials canvary
greatly in
their thermal
propertiessuch asdensity,
thermal
conductivity,
and specificheat.
Likewise,
toner
andpapercan
be
constructed of various materialsintroducing
a wide range ofproperty
values which also affect
heat
transfer.
Paper
is
aninteresting
structurebecause
ofits
porousnature,
whichadds anotherlevel
ofcomplexity
whenevaluating
heat
transfer
characteristics.Paper is
composedofapproximately
one-half pore space
making
it
susceptibleto
environmentalconditions,
mostnotably
hygroexpansivity
(moisture
absorption),
whichcangreatly
affectthe
heat
transfer
process.This
workdeals
withthe
effect of moisturein
the
paper onheat
transfer
during
the
fusing
processby
constructing
aone-dimensional, time transient
model2.0 Literature
Review
Much has been
writtenregarding
heat
and masstransfer
in
porousmediaranging
from
the
generalformulation
ofthe
phenomenon[1-3]
to
more specific applicationssuch asheat
and moisturetransport
in
soils[4-8]
andfood
products
[9].
Work
has
alsobeen done in
the
areas ofcondensationand evaporationin
porous media[10-11]
andthe
numericalsolutions ofheat
and masstransfer
in
porous mediahave been
presented[12-14]
.Much
ofthe
workdone
on capillary-porous materialsis
relatedto
wicks ofheat
pipes,
devices
which allow
heat
to
be
transferred
in
onedirection
andthermostating
to
be
done
in the
presence of a variableheat
source.This
abovebody
of cited worksis
by
no means an exhaustive collection ofthe
available writings on
the subject;
instead it is
anindication
ofthe
enormous amountof work andinterest
in
this
area.A. V. Luikov
[1],
a pioneerin
the study
ofheat
and masstransfer
in
porousmedia,
proposed adirect
interrelation
between liquid
andheat
transfer
in
a capillary-porousbody
reasoning that
liquid
motion causesenthalpy
transfer.
He
also attributedthis interrelation to the
fact
that the
liquid
is transferred
not
only
underthe
actionof a volumetricliquid
concentration gradientbut
is
alsoaffected
by
temperature.
Luikov developed
aformula for
non-isothermal massdiffusion in
a capillary-porousbody
in 1935
andexperimentally
determined
the
coefficients ofdiffusion
andthermodiffusion
of massfor
amass-transfer
potential(which is
similarto
temperature
in heat transfer) is
the
liquid
transfer
mechanismin
capillary-porousbodies.
Eckert
andFaghri
[3]
studied a class ofheat
and masstransfer
processeswhose assumptions relate
to this
work:the
effect ofgravity
is
negligibleandthere
is
no massflow
through
the
boundaries
ofthe
medium.Additionally,
the
porous matrix
is
suchthat the
saturation pressure atthe interface
between
the
liquid
and vaporis
afunction
oftemperature
only.The
poresizeis
sufficiently
small so
that the
vapor pressurethroughout
any
cross-sectionofthe
vapor-gaspassages
differs from
the
saturation pressure atthe interface
by
a negligibleamount.
The
mediumis
alsothought to
be
macroscopically
homogeneous
anddoes
not swell with a changein
moisture content.These
assumptionslead
to
variousconclusions about
the
heat
and masstransfer
characteristics ofthese
media.
Since
the
cross sections ofthe
passagesin
the
porous medium aregenerally
quitesmall, the
partialpressure ofthe
vapor atany
location
is
equalto the
saturation pressure atthe
local
temperature,
which meansthis
pressureis
afunction
oftemperature
and moisture content only.Eckert
andFaghri
studied a slab of porous material wherethe temperature
and moisture content are
initially
uniform andthen the temperature
of onesurface
is suddenly
raised whilethe
other surfaceis
maintained atits
originalvalue.
They
showedthat
the transport
of vaporby
diffusion
is rigidly
coupledthat the
inverse
situationis
true
atthe
cooled surfacenamely,
condensationoccurs and
the
moisturecontentincreases.
Ogniewicz
andTien
[10]
did
similar work on porousinsulation to
find
the
effectof condensation on
thermal
performance.Their
assumptions weresomewhatdifferent
than the previously
discussed
work.They
studiedaone-dimensionalslab,
but
allowedthe
boundaries
to
be
exposedto two
different
environments,
each withdifferent
temperature,
vaporpressure,
and ambient pressure.Additional
assumptionsand restrictions were:1)
local
thermal
equilibriumexists
among
allphases, therefore
all phaseshave
anidentical temperature
ata point
in
space,
andthe
air-vapor mixtureis
at saturation conditionsin the
presence of
liquid,
2)
the
liquid is immobile
andits
effect onthe
propertiesis
negligible,
3)
the
properties ofthe
gas phase aretaken to
be
those
ofdry
airbecause
vapor concentrationis
ratherlow (less
than
5%),
4)
cross-flowvelocitiesare small
therefore the
convective anddiffusive
components ofthe
transport
mechanismsareincluded.
The
solutionto this type
of problemyieldeda
three
zoneddistribution
ofthe
moisturein
the
slab.A
dry
zonedeveloped
nextto the
warmestsurface.In
the
centerofthe
slab a wet zoneemerged
followed
by
a smallerdry
zonenextto the
coolest surface.When
aninsulating
slab with aninitial
moisture content was comparedto
anidentical
dry
slabit
wasfound
that
condensationhas
an effect onthe
overallheat
transfer
coefficient.This
was quantifiedby looking
atthe
ratio ofthe
Nusselt
number
found
withmoisturein
the
insulation
to the
Nusselt
numbergenerated
from
adry
slab.The Nusselt
numberis
defined
asthe
ratioofthe
heat
flux
by
conduction alone.The
higher
the
ratio ofmoistto
dry
Nusselt
numbers, the
more severeis
the
deterioration in
the
insulating
performance ofthe
porous slabdue
to
condensation.They
also concludedthat
in
most casesthis
effectis generally
proportionalto the
rate ofcondensation.They
alsofound
that
even atrelatively
small rates ofcondensation,
asignificanteffectwas observed on
the thermal
performance ofthe insulation
due
to the
latent
heat
withinthe
porous slab.The
condensationrate andthe resulting increase
in
overallheat
transfer
wasfound
to
increase
with externalhumidities,
temperature
levels,
and overalltemperature
differences.
Udell
[11]
carried out similar experiments on a sand-water-steam system.His
device
washeated
atthe
top
and cooled atthe
bottom. The
insulated
system wassaturated withdistilled
waterandthen the temperatures
ofthe
heaters
were set such
that the
axialheat
flux
wasdownward.
The higher
temperature
heater
was setto
exceedthe
saturationtemperature
whilethe
cooled surface was setbelow
the
saturationtemperature.
As
the
water evaporatedthe
steam wasbled
off.Steady-state
conditions weredetermined from
the
stabilization of alltemperature
and pressuredata,
as well asthe
absence of steamflow
in
the
bleed-offline. This
configurationalsopromoted athree
phasezone,
but
in this
casethe
zone nextto the
heated
surface consisted of watervapor, the
center zonedeveloped
into
two phases,
liquid
andvapor,
andthe third
zone adjacentto the
cooled surface remainedin
the
liquid
phase.Udell
wasinterested
in,
among
otherthings,
the thermodynamic
aspects ofthis
arrangement.He
hypothesizes
from
the
Van
der Waal's
equationthat
for
thermodynamic
potentials.
He
also surmisesthat
sincethe
liquid
andvaporphases arein
contact and at
the
sametemperature,
they
co-existatdifferent
pressuresdue
to the
effect ofinterfacial
tension.
This
pressuredifference is
equalto the
capillary
pressure.Thus,
the thermodynamic
state of each phaseis
defined
by
the temperature
andcapillary
pressuredifference. Udell
alsoconcludedthat
the
heat
transfer
in
the
convection zoneis
due
to
the
vaporizationofthe
liquid
at
the
top
ofthe zone, the
downward
flow
of a steam phaseto
the
bottom
due
to
avaporpressure gradient as well as condensation and
the
upwardflow
ofthe
liquid
due
to
capillary
pressure gradients.Studies
moreclosely
relatedto the
work presentedin this
paperhave been
carried out
by
Bruin
[15],
andMikhailov
andShishedjiev [13]. Bruin looked
atthe
contactdrying
of a moist poroussheet underthe
assumptionoriginally
putforth
by
Makavozov
[16,17]
that the
moisture movement causedby
the
moisture potentialgradient
is
negligible.This
assumption, along
withthe
assumption of constant
properties,
linearizes
the the
well-known system ofcoupled partial
differential
equations setforth
by
Luikov. (Luikov's
equationsyield an exact computation of
temperature
and moisturedistribution for
drying
porousbodies
through the
application of numerical methods).Mikhailov
andShishedjiev
claimthat
Bruin's
simplificationis
inadmissible
and
leads
to
notonly
a quantitativebut
qualitatively
untrue picture ofthe
resulting temperature
and moisturefields. The
weakness ofBruin's
approachwas
demonstrated
by
comparing
the
results obtained withoutthe
use ofthe
Biot
numberfor
masstransfer
(Bim),
to
the
results ofMikhailov
andthe inclusion
ofthe
Biot
numberin
their
calculations.The
resultsshowedan"immense
influence"of
Bim
onthe resulting
temperature
andmoisturefields
confirming
the
suspicionthat
moisture movement underthe influence
of amoisture potential gradient
is
significant.Kladias
andDomoto
[14],
in
an unpublishedstudy that influenced the
development
ofthe
workhere,
investigate
moisturetransport
along the
thickness
of a porous medium(paper)
during
and after contactheating
onboth
boundaries.
Their
model considersheat
and masstransfer
withina porousmedium,
withthe
presence of awetting
liquid
(water),
its
vaporand anon-condensible gas
(air).
Considered
in the
solution are: effects ofdiffusion,
phasechange, conduction,
vaporand airtransport.
With
given systemproperties,
temperature
boundary
conditions,
andinitial temperature
and moisturedistributions,
the
model computesthe
spatialdistribution
oftemperature,
liquid
and vapor phasemoisture,
air volumefraction,
andvaporand airpressures.
Their
study
centers onthe
effects ofinitial
moisturecontent,
relative
humidity,
and asymmetrictemperature
boundary
conditions onmoisture reabsorption after
heating. The
simultaneousintegration
ofliquid
phase
continuity,
vapordiffusion,
airdiffusion,
andenergy
conservationequationsprovide
the
solution whenthermodynamically
constrained and withthe
use ofDarcy's law. The first implementation
ofthe
modellooks
atthe
moisture
loss,
reabsorption,
and papertemperature
decay
afterheating.
Comparisons
to
data
gatheredfor
moisturereabsorption andpapertemperature
decay
agree quitenicely to
computergenerated results.Moisture
content
decreases
closeto the
heated
sides, creating
vapor.As
the
vapor movesto the
center ofthe paper,
whereit
is
cooler,
some condenses andincreases the
liquid
contentin
this
region.The
modelalso predictsthat
for
aheating
time
of80ms
the total
gas pressuredoubles
in
the
paper.When
the
paperis
releasedfrom
the
heating
surfacesthe
vaporescapesdue
to the
elevated pressureinside
the medium, continuing
untilthe
pressurecomesinto
equilibriumwiththe
atmosphere.
Moisture
then
gets reabsorbedfrom
the
environmentinto the
paper
due
to
diffusion.
This
work alsoincluded
the
construction of adetailed
mathematical modelfor
simulating
heat
transfer
and moisturetransport through
a porous medium.This
model,
one-dimensionaltransient
in
nature,
considersheat
and masstransfer
withinahomogeneous
porousmedium,
with awetting
liquid,
its
vapor,
and a non-condensible gas present.The
effectsof gasdiffusion,
phasechange, conduction,
vaporand airtransport
areincluded.
The
following
equationsare
simultaneously
solvedto
find
temperature,
moisture and pressuredistributions
through
the
medium:Liquid
Phase
Continuity
a
,
(2.1)
(e o
)
+ m =0dt ll v
Vapor Diffusion Equation
P
d d d
(e
p)
H(p
u)
-m'=
dt s >> dx v 8 v dx
v
d
S effQX p g
(2.2)
Air Diffusion
Equation
d d d
(e
p)
H(p
u)
= dt e a dx e dx PD
-{) S effdxp
g
(2.3)
Gas
Phase
Equation
ofMotion
u
K
!!f
g
g
dx(2.4)
Energy
Conservation
dT dT d
(pc
)
,, h(p
c )u\- rh'
/i
= p eff dt g p gdx vfg
dxg
dT
keff~d~x~
(2.5)
Since
the
development
ofthis
modelis
quite completein its
formulation,
the
computing
time
necessary
to
execute a simulationis
protracted.The
lengthy
run
time
for
this
model makesit
unsuitablefor
routine usein
the
engineering
design
environment.For
these reasons,
asimpler,
moreflexible
modelis
desired
to
shortencomputing time
while stillyielding
accurate results.The
focus
ofthis
paperis
to
detail
such a modelintended
to
include many
ofthe
important
concepts whilesimplifying
the
equationsto
reducecomplexity
and3.0
Theory
The
mathematicalsolutiondeveloped here
is
based
onthe
parabolicform
ofthe
heat
equation.Additional
thermodynamic
and empirical system ofequationswere combined with
the
heat
equationto
form
arelatively
simplerelationship
governing
the
heat
transfer
and moisture movement within a porousmedium.The
core ofthe
simplified methodis
the
solution ofthe
heat
equation withthe
addition of a source
term to
accountfor
heat
absorbed or releasedthrough
evaporation and condensation.
The
heat
equationis
solvedusing
afinite
difference
scheme(Crank-Nicholson).
This
is
followed
by
the
solutionfor
the
liquid
and vapor massdistribution
from
thermodynamic
equations of state andempirical moisture
data,
tabulated
as afunction
of relativehumidity
(RH)
andtemperature
for
the
porous media ofinterest.
3.1 Model Formulation
The
problem consistsof aone-dimensional, time-transient
heat
and masstransfer
analysis ofa porous mediumin the
presence of awetting
liquid
andits
vapor.
Included
arethe
effectsof conduction and phase change.The
assumptions applied
in this
analysis are asfollows:
1.
The
porous mediumis
homogeneous
andincompressible.
2. The
condensable vaporbehaves
as anideal
gas.3. Variation in
the
liquid
density
due
to temperature
changeis
negligible.4.
The
vaporpressurethroughout
the
porous mediumis
assumed uniformat each
time
step.5.
Convective
terms
are negligible comparedto
evaporation andcondensation.
6.
No
moisturetransport through the
materialboundaries.
The first
three
assumptionsarecommonly
madein
the
analysis ofheat
transfer
in
porous media and are applicablein
this
study.Assumption
four,
onthe
otherhand,
is
somewhat more nebulousin its
origin.This
assumptionis
valid
if
the
mediumin
questionis
composed ofa structurethat
allows afree
flow
of well mixed gas and vaporfrom
one poreto the
next.This
is
areasonableassumption
for
the
mediumofinterest in
this
investigation,
paper.The fourth
assumptionis
critical,
as willbe
shown,
andalong
withfive
and sixfacilitate
the
simplifiedsolution presentedhere.
With
these
assumptionsin
mind,
the
heat
equationis
ofthe
form,
dT d
(Pc
)
~ = ~ P eff dt dxdT
eff dx
+ 9
(3.1)
The
additionalterm,
q,
in this
equationis
the
sourceterm arising
from
the
evaporationandcondensation of moisture.
Mathematically
this term
is
calculated
by,
dm1
(3.2)
h
dt
fg
The
mass conversion rate ofliquid
per unit volume ofpaper,
m'z
,is
c CD -M c o u -t-1 o
E
3 3 cr no cd an -erg-- o* ^^^^^^
1
H
1
oiL2
r-vSi\\nVi
\r o o o cn o oo o r^ o to o in O o no o CM X cn "DE
13 X CD > CD rsi00 LO rvj
cn ^D no
o/0
im
_the time step,
for
each node.Therefore,
q =
Am'
-m'
)
,..,
(3-3)
fat
currenttime previoustime liquidIn
orderto
find
the
average mass ofthe
liquid
per unitvolume,
the
empiricaldata
shownin
Figure
3.1 is
used.These
curvesarea plot ofthe
%
Moisture
Content (equilibrium
valueby
weight)vs.the
ambient relativehumidity
(RH)
surrounding
the
medium.A
set of curvesis
developed
for
a materialby
repeating the
measurements atdifferent
temperatures.
The
combination ofthese
curves yieldsthe relationship,
m,
ho p
2 v
m'
=
p ,
=
W(T)
p
, /o A\I jfi medium n
(T)
mediumI
J-^7total sat
Where
W(T)
is
alinear
regressionof allthe
slopes ofthe
%
Moisture
Content
vs.
RH
curves,
yielding the
approximation,
W(T)
=0.21514-4.026X10
"6T
(3.5)
psat
is
the
saturation vaporpressure givenby
the
Clapeyron
equation,
sat 0
1 1
hfg\
( ~~)^^~ro
T RV(3.6)
p =p
R
T
(3.7)
V rV Vand
mtotal
is
the
combinedmass ofthe
liquid,
vapor,
and medium.The
relationship
developed
in
Equation
3.4 is
avery
good estimate ofthe
mass ofthe
liquid because
the
mass ofthe
vaporis
negligible at ambient conditions.The
average mass ofthe
vapor per unit volume can nowbe found
by
utilizing
Equation
3.7
andthe
porosity
ofthe material,
<J>, yielding,
Pv
m'
=!Lq
(3.8)
v
R
T
With
the
use ofthe
equations outlinedabove,
a numerical solution canbe
obtained
for
temperature,
liquid
content,
and saturation pressuredistributions
along
with a uniform vapor pressure atany
time through the thickness
ofthe
medium.
3.2
Initial,
Reference &
Boundary
Conditions
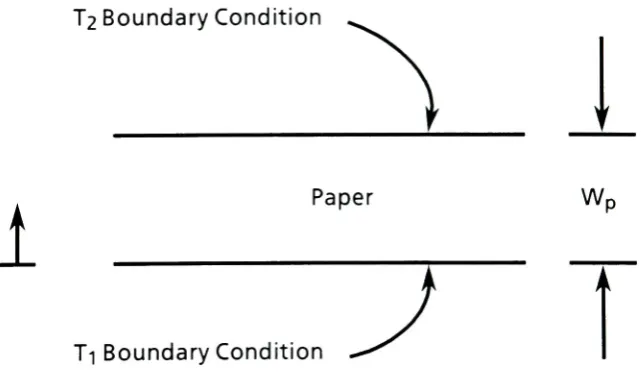
Two
boundary
conditionsare usedto
describe
the
problem.Both
ofthese
conditions correspond
to
the temperatures
prescribed atsurfacesofthe
mediumand can
be
summarizedby
* =
0,
T=T1
(3.9)
*=W
T=T2
(3.10)
P'
2
where,
Wp
= paperthickness
The
initial
conditionsfor
the
problemareestablishedfrom
the
environmentalconditions.
It
is
assumedthat the
paperis
initially
in
equilibriumwiththe
environment which governs
the
initial
moisture content andtemperature.
It
is
also assumedthat the temperature
distribution
attime
zerois
uniform,
which
leads
to
uniforminitial
vaporandliquid
massdistributions
through
the
[image:27.525.110.432.373.568.2]medium.
Figure 3.2
-Computational Domain
T2 Boundary
Condition
1
Paper
Wr
3.3
Numerical
Solution
The
temperature
distribution
in
the
mediumis
found
by
using the
Crank-Nicholson
[9]
finite difference
algorithmto
solvethe
heat
equation.Initial
temperature
andRH
conditionsarespecified,
allowing
the
calculationofthe
initial
moisturedistribution. With
these
initial
conditions,
the
temperature
atthe
nexttime step
is
found
by
first
ignoring
the
moisture phase change.With
this
newtemperature
distribution,
saturation pressure and equilibriumslope(see Equation
3.5)
canbe
obtained.An
additionalrelationship
m ,
= m
, + m
(3.1
1)
2 total total total
allows
for
the
solution ofthe
remaining
unknown,
vaporpressure,
by
combining
Equations
3.4, 3.5, 3.7,
and3.10
suchthat,
p V
m
u 2 total
L
ip(T) Q> fL
dx
p
"
J
p
(T)
R
J
rmedium
J
p
(T)
R
J
nT(x)
u
sat v u
(3.12)
where
L is
the
thickness
ofthe
porous medium.The
use ofEquation
3.12
allows
the
new vapor pressureto
be
obtained.Since
the
vapor pressureis
assumeduniform
through
the
mediumatany
pointin
time,
Equations
3.4
and3.7
cansubsequently
be
usedto
obtain a new moisturedistribution. This
process
is
iterated
by
re-solving the
heat
equation, this time
withthe
phasechange source
term
included,
withoutadvancing the time
step
untilthe
difference in
the total
mass ofthe
currentandthe
previoustime
step
converges.
The
time
step
then
advances andthe
processis
repeateduntilthe
desired
maximumtime interval
is
reached.4.0
Model
Validation
Due
to the
shorttime
intervals
andthe
small control volume studiedin
this
work,
experimental verification ofthe
results was notphysically
orfinancially
feasible.
Instead,
the
model wasvalidatedontwo
levels: 1)
the
Crank-Nicholson
routineused asthe
core solution module was comparedto
ananalytical solution and
2)
a run was completedcomparing the
results ofthis
model
to
publishedexperimental results.4.1
Analytical
Solution
The
core computational module ofthe
program utilizesthe
heat
equationto
solve
for
the temperature
profile.The
numericalaccuracy
ofthis
subroutinewas verified
by
comparisonto the
analyticalheat
transfer solution,
whichis
well
documented.
The
case ofinterest for
comparisonis
that
of uniforminitial
temperature through
the thickness
ofthe
mediumand,
att
=0,
the
temperatures
atthe
two
boundaries
are raised orlowered
to the
same value.The
exact solutionfor
these
conditions[18]
is
ofthe
form,
4 1
2 2
an n
1
L2
nnx
T(x,t)
= -6V
J
sin
(
-7-)
+T
n
(4.1)
where,
0
=t.
. .,
-
T
k
a =
pc
T
=boundary
temperature4.2
Crank-Nicholson Comparison
The Crank
-Nicholsonroutine[19],
withoutthe
affects ofmoisture,
wascompared
directly
to this
analytical solutionto verify the accuracy
ofthe
numerical algorithm.
A
simplecase,
with material properties onthe
sameorder of magnitude as
that
ofpaper,
was chosenfor
this
comparison .A
compilationof
the
relevant values usedin
the
computationarelisted
in
Table
4.1.
Table 4.1
-Crank-Nicholson
Comparison: Properties
&
Computational Data
Material Properties
w
k
=0.20
m
K
kg
p
=900.0
3 mJ
c =
1300.0-kgK
Dimensions
andNumerical
Data
L
=0.10
mM
=0.10
sectoe
=0.0010
mInitial
andBoundary
Conditions
T
,=
100.0
C
initial
T.
,=
0
C
boundaryThe
model wasexercisedin
orderto
comparethe
numerical resultsto
the
analyticalsolution.
They
were comparedafter a runlength
of50
sec and asummation
term
of n =201
for
the
exact solution series.The
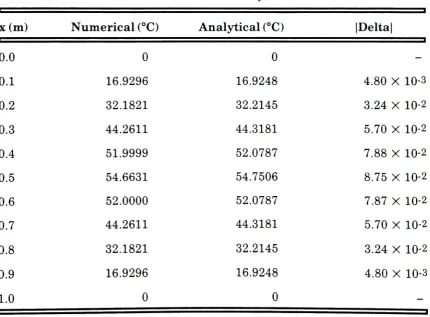
results arefound
in
Table
4.2.
Table
4.2
-Numerical
vs.Analytical
Results
x(m)
Numerical
(C)
Analytical
(C)
|Delta|
0.0
0
0
-0.1
16.9296
16.9248
4.80
X
10-30.2
32.1821
32.2145
3.24
X
10-20.3
44.2611
44.3181
5.70
X
10-20.4
51.9999
52.0787
7.88
X
10-20.5
54.6631
54.7506
8.75
X
10-20.6
52.0000
52.0787
7.87
X
10-20.7
44.2611
44.3181
5.70
X
10-20.8
32.1821
32.2145
3.24
X
10-20.9
16.9296
16.9248
4.80
X
10-3 [image:31.525.49.480.313.630.2]-It is
obviousfrom
Table
4.2 that there
is
very
goodagreementbetween
the
numerical andanalyticalresults.
This
comparisonshowsthat the
difference
in
order of magnitudebetween
the
numericalsolutiondelta
andthe
maximumtemperature
differnce
(10D
is
10-3to
10-4whichtranslates to
within0.16%
agreement.
4.3
Comparison
to
Experimental
Data
Eckert
andFaghri
[3]
studied moisture migrationin
a slab of unsaturatedporous material with
the
conditionthat the temperature
of one surfaceis
suddenly increased
to
ahigher
value whilemaintaining
the
other surface at aconstant
temperature.
The
two
surfaces are assumedimpermeable
to
massflow.
Also,
the
properties usedin
the thermodynamic
andtransport
equationsdescribing
the temperature
and moisturetransport
are assumed constant.These
assumptions areidentical to those
setforth
in this
study.Therefore,
acomparisonwas made
to the
published results ofKrischer
andRohnalter (as
cited
by
Eckert
andFaghri)
to
the
results of a run ofthe
modeldeveloped
here.
The
measurementsby
Krischer
andRohnalter
were madeby filling
ahorizontal
tube 50cm
long
with moist sandhaving
an average graindiameter
of
0.2mm. The
two
ends ofthe tube
were sealed andkept
at constanttemperatures
of70
C
and20
C
for
a period of5
months.The
asymmetricboundary
temperatures
rearrangedthe
initially
uniform moisturefield
untilsteady
state was established.The
tube
wasopened andthe
local
moisturecontent was measured
along
the
axis ofthe tube.
Using
the
resultsfrom
this
experiment,
a moisturediffusivity
constantwasfound
whichallowedthe
time
to steady
stateto
be
calculatedusing the
moisturetransfer
Fourier
number.The
time
at whichsteady
statewasapproachedwasfound
to
be
approximately
1.05
x 107 seconds (=4
months).
The
valueW
plottedonthe
vertical axis ofFigure
4.1
(taken
from
ref.[3] )
is
the
moisture contentfound from
the
ratio ofthe
mass ofthe
liquid
to the
massof
the
dry
sand.This
value was plottedalong
the
length
ofthe tube.
The
initial
moisturecondition was set atWi
=0.1 along
the
entiretube.
Results
from
experimentaldata
andthe
computational modeldeveloped here
areplotted
together
for
comparisonin
Figure
4.1.
The
assumptions usedin
the
formulation
ofthe two
works arethe
same.Common
properties of sand were used usedfor
the
model.The
results shownin
Figure
4.1
indicate
that the
basis
ofthe
modelis
groundedin
reality.The
trends
ofthe
modeling data
matchthat
ofthe
empirical resultsin that the
moisture ratio
increases from left
to
rightandthe
ratio values(W)
fall roughly
in the
sameregion.The
obvious shapedifferences
in the two
curvesis
probably
due
to the
fact
that the
Equilibrium
Moisture
Curves for
paper wereused
for
the modeling
run.These
curves governthe
movement of moisturein
the
mediumand are mostlikely
responsiblefor
mismatchin
the
shapesofthe
o
"w
o
Q.
>
crj
DC
co
w
crj
O
C/)
5.0
Discussion
ofResults
It
wasdesirable
to
look
at several ofthe
output variables calculated withthe
use of
the
modelin
orderto
better
understand andquantify
the
physicalprocesses
occurring
during
fusing.
Again,
the
purpose ofthe
programis
to
model
in
a simpleway
whathappens
physically
during
the
period oftime the
paper
is in
the
nip
and,
if
possible, to
find
andrepresenthow
the thermal
conductivity
changesin
the
paperdue
to the
amountof moisturepresent,
which
is usually
an uncontrollablefunction
ofthe
environment.Table
5.1
lists
the
parameters usedto
generatebaseline
results.Table
5.1
-Baseline
Properties
&
Computational Data
Material
Properties
w
fe
=0.18
m
K
kg
p =
930.0
3
m
J
c = 1340.0
p
kg
K
$
=0.4
Dimensions
andNumerical Data
L
=0.102
mmAt
=0.010
msecInitial,
Reference &
Boundary
Conditions
T.
.,. . =20.0
C
initial
TQ
=343.16
K
kJ
hr
=2334.0
f*
kg
R
=461.88
P
=31.16X10
3kgK
N
2 m
T
j
= 180
/ 180C
-Symmetric Case
boundary
1/2T,
,= 180 /
90C
-Asymmetric Case
boundary
1/2Two
cases were examined:1)
a symmetric case wherethe
boundary
conditionswere
identically
fixed
at atemperature
abovethe
initial
conditiontemperature
and2)
an asymmetric case where oneboundary
is
at alower
value
than
the other,
but
both
are abovethe
initial
temperature
ofthe
paper(this
moreclosely
resemblesfusing
conditions).In
each casethe thermal
conductivity
is
fixed
andthe
relativehumidity
is
varied.Then
the
relativehumidity
is
setto
zeroandthe conductivity
is
varieduntilthe
temperature
profile matches a profile generated
in
one ofthe
previousrelativehumidity
cases.
The
values used are common properties usedfor
paper[18],
water andvapor
[13].
5.1
Symmetric Case
Figure
5.1
showsthe
liquid
mass per unit volume of paper as afunction
oftime.
Results for
three
initial
relativehumidity
values are plotted(20,
50,
and80%)
to
allow comparison.The
runduration
was50
milliseconds.The
relevant calculated parameters ofthe
modelthat
act asthe
sourceterm
in
the
conduction equation arethe
liquid
and vapormass,
shownin
Figures 5.1
and
5.2
respectively.The
liquid
mass shownin
Figure
5.1
decreases
slightly
from
the
beginning
to
the
end ofthe
run.The
magnitude ofthe
changein
liquid
content overthe
runtime
variesdepending
onthe initial
RH. In
the
case of
80%
RH,
the
large decrease
in
total
liquid
mass occursbetween 5
and10
msec.
The
drop
overthis
period of4
kg/m3
accountsfor
virtually
all ofthe
change
in
the
liquid
contentoverthe
entire run.A
similar phenomenon occursfor
50%
RH
withthe
total
drop
in
liquid
contentreaching
about3
kg/m3,
the
majority occurring
from
7.5
-10
msec.
The 20% RH
plot shows aslightly
different
shape.While
in
this
casethe
liquid
stilldrops
overthe
run about1
kg/m3,
the
decrease is
gradual overthe
entire50
msec.This
resultis
the
first
analysis(of
whichthe
authoris
aware)indicating
that
the majority
ofthe
phase change occurs over a short period oftime
and notgradually
throughout
the
heating
process.Similar
to the
plotofthe
mass ofliquid
vs.time,
Figure
5.2
showsthe
relationship
ofthe
vapor mass per unit volume of paper as afunction
oftime
CD
E
CDCO03
h-
o
CJ
CO CD
E
>
CO
E
(n
>-Ctf
U)^
T-m
"D
<d13
3CX
o>Ll
0
E
CDCOCO
h-
O
o
co
*CD
>
E
CO
E
CO >N
CTJ
U)^
OJ1_ LO
o
CDO.
303
>
CC
x: xr ^ o^ o^ o^ O O O CM LO CO
O
ID
o
o
o
o
the
three
RH
conditions,
20, 50,
and80%
appearto
begin
at0
kg/m3,
in reality
the initial
conditionsvary
and are1.49
x10-3,
3.74
x 10-3and5.97
x 10-3 [image:40.525.86.481.570.619.2]kg/m3paper
,respectively.Figure 5.2
supportsthe
findings
ofFigure
5.1.
As
one wouldexpect,
the
vapormass
increases
mostdramatically
for 80% RH
sincethere
is
moreinitial
liquid
available
for
phase change.The
moststriking
feature
in
Figures
5.1
and5.2
are
the
changesin
the
liquid
and vapormass,
whichcorrespondboth
in
time
and magnitude.
For
example,
the
vapormass,
for
the 80%
RH
case,
plottedin
Figure
5.2
risesgently
about0.3
kg/m3for
the
first
5
msec andthen
for
the
following
5
msecincreases
about4
kg/m3.
In
the
last
40
msecthe
vapor massonly increases
about0.5
kg/m3. The
overallincrease
correspondsvery
wellto
decrease
in
liquid
massin
Figure
5.1
illustrating
conservation of massin
the
system.
The
times
that these
two
events occur also coincide.This
samecomparison can
be
madefor
50%
RH. With
a relativehumidity
of20%,
the
increase happens
gradually
overthe
run,
withapproximately
90%
ofthe
riseoccurring
in
the
first
30
msec.Figure
5.3,
by
comparison,
is
a plot ofenergy
per unit areainto
the
paper as afunction
oftime
and relativehumidity.
The
total energy
changeinto
the
paperis
estimatedby,
total
pc
Y<(T
-T
.
^ )toc +
h
(m
-m * L-, 1
node initial
fg
v v. . . ,P
nodes
I
'""k lmtlal(5.1)
1
!
;
i 1 X X
-r-1
CC CC CC x
^o ^o ^o
-5s o^ o~-0
O O O o^
CD
CO LO CM OThis
equationis
essentially the
heat
addedto the
paperdue
to
the
elevatedboundary
temperature
plusthe
evaporation/
condensationterm
generatedfrom
the
phasechange.As
the
legend
ofFigure
5.3 shows, 0%
RH is
a greencurve,
while20%
RH
is
black.
Interestingly,
these two
curves appearto
be
coincidentinitially,
but
the
moistureeffects
gradually
draw
moreenergy into
the
paper overthe
duration
of
the
run.The
redandblue
curves,
50
and80%
RH
respectively,
showlarge
increases in energy between 5
and10
msec, corresponding to the time
whenthe majority
ofthe
phase change wasfound.
The
energy difference
at50
msec representsthe
additionalenergy
requiredto
changethe
liquid
to
vapor
during
the
fusing
process representedby
the
secondterm
in
Equation 5.1.
Combining
the
behavior
ofthe
liquid
and vapor mass withFigure
5.3
offersadditional
insight
into
whatis
taking
placein the
nip.As
the
RH
increases,
the
behavior
ofthe
curves changesgreatly
from
the
smoothrising
curves of0
and
20%
RH.
Both
the
50%
and80% RH
curvesrisesmoothly
for
the
first 7-9
msec,
following
the
same path asthe
lower
RH
value.Suddenly,
at about8.5
msec,
the
50% RH
curveincreases
its
energy into the
paperradically,
rising
from
about13
kJ/m2to 19.5
kJ/m2in scarcely
3
msec.This
accountsfor
33%
ofthe total energy
into
the
paperin
only
6%
ofthe time.
The
80% RH
casealso
follows
this
kind
oftrend,
withit's
suddenrisebeginning
at5.5
msec andincreasing
in
energy
from
12
kJ/m2to 19.5
kJ/m2 over a4
msecperiod.Similarly
this
accountsfor
38%
ofthe
total
energy
into
the
paperin 11%
ofthe
time.
In both
ofthese
cases avery
significant portion ofthe energy
is
being
delivered
into
the
paper overrelatively
short periods oftime.
To
better
illustrate
the
interaction
ofthe
mass ofthe
liquid
andvaporandthe
energy into
the substrate,
Figure
5.4
was constructed.The
ordinate serves asthe
measure ofboth
the
mass per unit volume andthe
energy
per unit area.In
the
case ofthe
latter,
the
valueshave
been
scaleddown
by
afactor
of onethousand.
As
an examplecase, only the 80%
RH
caseis
shown.The
interactions
between
the
liquid
and vapor masses andthe
energy
areeasily
seen.This
figure
showsthat
for
the
first
5.5
msecvery
little
phase changehas
occurred andthe
rate ofenergy
per unit areainto
the
paperis
asymptoting.As
waspreviously
discussed,
atthis
pointthe
rate ofenergy
increases
dramatically.
The
mostinteresting
aspect ofthis
periodis
the
simultaneous rapiddecrease
in
liquid
mass,
while atthe
sametime
acorresponding increase in
vapor massoccurs,
linking
in
time,
the
energy into
the
substrateto
the
phase change.Figure 5.5a is
a plot ofthe
liquid
massdistribution
as afunction
oftime
andtemperature.
Height
onthe
verticalaxisindicates
temperature
andthe
massdistribution is
plottedby
color.Contour
lines
signify
moisture gradients andcorrespond
to
a0.22
kg/m3liquid
masschange.Time
is
shown onthe
axismoving
back into
the
cube and2
msectime
intervals
aredelineated
by
the
I
DC ^S C> O 00 CD C/5 COO
o ~E
E
>^ coc
o
o
CTJ
CD
cn <"It
EJ^
>,_! >a & 52
r-CO CTJ iu55
CO
CO
CD
o
O
Q_
o> LO 0 3 O LO od
o od
o oo od
o CD CDE
o CM O O 00 o CO od
o
in
in
O
13
ft
i_
OJ
CL
E
r-I
i_n
tn
a;
CM
-sL
03 i~i ca
i rn
rn
in
CM
6
CD
E
Figure
5.5a
showsthat
the
liquid
is
initially
distributed
evenly
through
the
paper.
Suddenly
the
boundary
temperatures
are raised.As
the
papertemperature
risesfrom
the
boundaries
toward the center,
liquid
convertsto
vapor and
is
transported to the
center ofthe
paper wherethe
temperature
is
still cool enough
to
condensethe
vaporto
liquid. Liquid
collectsin
the
coolarea of
the paper,
whichis
shownby
the red,
untilthe temperature
ofthis
liquid
risesto
a point where a significant portion changes phaseto
vapor.As
the
paperclimbstoward
asteady
statetemperature profile, the
vaporbegins
to
redistributeback
through the
entire cross section.Very
little
phasechangeoccurs
during
the
remainder ofthe
run.Figure
5.5b
showsthe
effect of moisture onthe
speed at whichthe
paperincreases in
temperature,
orthe
heat
transfer
rate.The
temperature
distribution is
plotted versus nodal position attwo
different
times,
6
and10
milliseconds and as a
function
of relativehumidity.
After
only
6
msecthere
is
very
little difference between
the the
four
cases(0,
20%, 50%,
80%
RH). But
astime
increases,
the
moisture effects manifestthemselves.
By
10
msecthere
is
quite adifference
between
the
four
moisturecontent cases.
In
the
center ofthe
paper(the
coolestpoint)
the
dry
paperis
at112
C
whilethe
20% RH
caseis
at about115
C
andthe 50%
RH
caseis
22C
higher
at137
C. The
paperinitially
subjectedto
80%
RH is
stillhigher
at163
C,
51
C
abovedry
paper.This demonstrates
the
rapidtemperature
increase
due
to increased
heat
transfer
ratesresulting
from
phasechangesduring
the
process.c
o
l~". CD V)CO
COo
U
Q-
o Mm) CDCO
F
>
E
CD
rn s13
#>Cfl
JO LO i_ 10CD
CL
CD 3E
Ll
CD
h-CD OC^
C o"c/5
O Q_o o o O o o o o
o o o
Figures
5.5a
and5.5b
showthe
dramatic
effectofmoistureonthe
temperature
profile.
The
desired
outcomeis
to
quantify
this
changein
terms
of an effectivethermal
conductivity.The
effectivethermal
conductivity
accountsfor
the
conductive
heat
transfer through the solid,
in
additionto the
effect ofthe
liquid
on
the
heat
transfer
mechanism.The
results shownin
Figure
5.6 illustrate
this.
A base
thermal conductivity
is
used(0.18
W/m
K)
to
calculateatemperature
distribution
with various moisture contentsfor
a14
msec run.Comparison
casesare plotted with zero moisture contentin
the
paper whilethe
conductivity
is
varied untilthe
curves match.In
this way the
modelcandemonstrate
whatthe
effective changein thermal conductivity
is
due
to
moisture
in
the
paper.Figure
5.6
showsthat
with aninitial 20%
RH,
there is
essentially
no effect onthermal
conductivity.By
comparison,
the
50%
RH
casehad
an effectiveconductivity
of0.348 W/m-K
comparedto the
dry
0.18
W/m-K.
At 80% RH
the
effectiveconductivity jumped to
0.425 W/m-K. These
effectiveconductivity
changes are significant and willhave
adramatic
effect onthe
fusing
process.5.2
Asymmetric
Case
Figures
5.7-5.12
aredirectly
analogousto
Figures
5.1-5.6
previously
described
with
the
exceptionthat only
a singleboundary
conditiontemperature
is
altered.
The
samelength modeling
runs were performed aspreviously
discussed
with one ofthe
boundary
temperatures
lowered
from
180
C
to
90
C.
This
asymmetricconfigurationmoreclosely
resembles a normalfusing
set up.The
lower
boundary
temperature
usually
coincides withthe
pressure rollwhich
is
raised abovethe
ambienttemperature
by
one oftwo
methods:1)
transient
heat
conductionfrom
the
heated
fuser
rollor,
2)
aheating
elementplaced
in
the
pressurerollin
orderto
moreprecisely
controlthe
pressurerollsurface
temperature.
The
asymmetriccase produces similar resultsto the
previous symmetriccases,
with several small
differences. Figure
5.7
demonstrates
one ofthose
differences.
The
decrease
in the
liquid
mass overthe
runis
much smallerin
this
case comparedto the
symmetric case.Figure
5.8
gives moreinsight
into
just
how
much phase changeactually
occurs.Again,
mostofthe
phase changeis
happening during
the
first
15-20
msec.In
this case,
for
allRH
conditions,
arange of
0.2-0.7
kg/m3
changesfrom
liquid
to
vapor.The
vapor mass curvecoincides
in
time
but
withinverse
magnitudeto
the
liquid
mass curve.The
curves are of a similar shape as
the
symmetric case withthe
exceptionof anadditional gradual
sloping increase in
the
vapor mass abouthalfway
through
the
significant portion ofthe
phase change.For
example,
the
50%
RH
caserises
gently
to
about0.05
kg/m3for
approximately 3.5
msec whereit suddenly
rises
steeply 0.17 in only 1.5
msec.This
is the trend
followed
in the
symmetriccase,
but
the similarity
endshere.
At
the
5
msecpoint, the
vapor mass makesanother slope change and now rises
0.08
kg/m3
in 3.5
msec.This
gradientis
close
to that
encounteredin
the
first
3.5
msec ofthe
run.However,
afourth
slopechange
is
experienced,back
to
a moreradically
increasing
slope of0.125
kg/m3
in
about2.5
msec.This
sharp
ascent asymptotesto
0.33
kg/m3
by
15
msec.
Compared to the
symmetriccase, there
is
an additional"flat
spot"in
the
phase change region.
The
80%
RH
casedo