Open Access
Research
Three different Plasmodium species show similar patterns of
clinical tolerance of malaria infection
Ivo Müller
1,2, Blaise Genton
1, Lawrence Rare
2, Benson Kiniboro
2,
Will Kastens
3, Peter Zimmerman
3, James Kazura
3, Michael Alpers
2and
Thomas A Smith*
1Address: 1Department of Public Health & Epidemiology, Swiss Tropical Institute, Socinstrasse 57, Postfach CH-4002, Basel, Switzerland, 2Papua New Guinea Institute of Medical Research, PO Box 60, Goroka, Papua New Guinea and 3Center for Global Health & Diseases, Case Western Reserve University, Cleveland, OH, USA
Email: Ivo Müller - ivomueller@fastmail.fm; Blaise Genton - Blaise.Genton@unibas.ch; Lawrence Rare - pngimr_lrare@datec.net.pg; Benson Kiniboro - pngimr_en@datec.net.pg; Will Kastens - wkastens@datec.net.pg; Peter Zimmerman - Peter.Zimmerman@case.edu; James Kazura - James.Kazura@case.edu; Michael Alpers - M.Alpers@curtin.edu.au; Thomas A Smith* - Thomas-A.Smith@unibas.ch * Corresponding author
Abstract
Background: In areas where malaria endemicity is high, many people harbour blood stage parasites without acute febrile illness, complicating the estimation of disease burden from infection data. For Plasmodium falciparum the density of parasitaemia that can be tolerated is low in the youngest children, but reaches a maximum in the age groups at highest risk of infection. There is little data on the age dependence of tolerance in other species of human malaria.
Methods: Parasite densities measured in 24,386 presumptive malaria cases at two local health centres in the Wosera area of Papua New Guinea were compared with the distributions of parasite densities recorded in community surveys in the same area. We then analyse the proportions of cases attributable to each of Plasmodium falciparum, P. vivax, and P. malariae as functions of parasite density and age using a latent class model. These attributable fractions are then used to compute the incidence of attributable disease.
Results: Overall 33.3%, 6.1%, and 0.1% of the presumptive cases were attributable to P. falciparum, P. vivax, and P. malariae respectively. The incidence of attributable disease and parasite density broadly follow similar age patterns. The logarithm of the incidence of acute illness is approximately proportion to the logarithm of the parasite density for all three malaria species, with little age variation in the relationship for P. vivax or P. malariae. P. falciparum shows more age variation in disease incidence at given levels of parasitaemia than the other species.
Conclusion: The similarities between Plasmodium species in the relationships between parasite density and risk of attributable disease are compatible with the hypothesis that pan-specific mechanisms may regulate tolerance to different human Plasmodia. A straightforward mathematical expression might be used to project disease burden from parasite density distributions assessed in community-based parasitological surveys.
Published: 14 July 2009
Malaria Journal 2009, 8:158 doi:10.1186/1475-2875-8-158
Received: 7 April 2009 Accepted: 14 July 2009
This article is available from: http://www.malariajournal.com/content/8/1/158
© 2009 Müller et al; licensee BioMed Central Ltd.
Background
Residents of malaria endemic areas frequently harbour asexual blood stage parasites without developing symp-toms or signs of acute febrile illness, implying that some degree of clinical tolerance to parasitaemia is acquired through repeated exposure to and experience with chronic blood stage infection. Epidemiological studies of this phe-nomenon have focused mainly on Plasmodium falciparum, the dominant malaria species world wide, and attempted to quantify this complex clinical phenotype at a popula-tion level by estimating the peripheral parasite density at which body temperature exceeds a specific level or cut off value, i.e. the pyrogenic threshold [1]) or the probability of acute febrile illness as a function of parasite density [2-4]. In contrast, similar analyses of clinical tolerance to other major malaria species that infect humans, Plasmo-dium vivax, Plasmodium malariae and Plasmodium ovale, are limited to one study of P. vivax from Punjab [5] and another of P. ovale from Senegal [6].
Understanding the differences in clinical tolerance to par-asitaemia among various malaria species may be impor-tant in areas of the world where P. vivax and P. falciparum
are co-endemic such as in Asia, the Pacific and South America. Anti-malarial drug resistance or deployment of vaccines that preferentially affects one species may alter innate and adaptive immunity and clinical tolerance to the other.
In highly endemic areas for P. falciparum, the fever thresh-old expressed in terms of the density of parasitaemia in peripheral blood at which a given body temperature is exceeded declines progressively after the age of one year [1,2,7]. Thus, children with high parasite densities tend to be asymptomatic compared with adults or adolescents with similar levels of peripheral parasitaemia. Neverthe-less adults have a lower incidence of clinical malaria attacks than children. because P. falciparum density is on average controlled at a lower level in adults than children
This is consistent with the idea that tolerance is the conse-quence of an immunological response with little memory, stimulated by toxins released during schizogony, and sev-eral possible mediators of tolerance have been proposed with this in mind, notably the anti-inflammatory mole-cule nitric oxide (NO) [8] and antibodies to GPI [1]. How-ever recent studies in Papua New Guinea suggest that cytokine responses to GPI can better account for both immunological and epidemiological patterns [9].
Variations in tolerance are only one possible explanation for differences in the operating characteristics of diagnos-tic thresholds of peripheral parasitaemia in P. falciparum. Changes in pyrogenic threshold could also be explained in terms of differences in the ratio of circulating to
seques-tered parasites. Pyrogens or putative malaria toxins are released when sequestered P. falciparum-infected erythro-cytes burst during schizogony. Hence pyrogen concentra-tions may reflect more directly the density of sequestered parasites than that of trophozoites in the peripheral circu-lation. At present, approaches for assessing the number of sequestered P. falciparum parasites in the living human host remain controversial [10,11], and there is no means of reliably quantifying circulating toxix(s) until their molecular nature is better understood. In contrast, the rate of schizogony and level of malaria toxin release should be approximately proportional to the peripheral blood para-site density in P. vivax and P. malariae infection since these species are not thought to sequester in deep vascular beds.
In population based studies, it is possible to estimate the apparent degree of clinical tolerance relative to the proba-bility of an individual experiencing a given peripheral density. This approach may be a better way of assessing tolerance than using specific diagnostic cut-off values since the latter depends on the extent of incidental parasi-taemia in a population as well as the pathogenic effect of a given parasite density. We have carried out an analysis of the relationships between the incidence of acute illness attributable to P. vivax and P. malariae and the densities of circulating parasites in an area of Papua New Guinea where these two malaria species as well as P. falciparum are highly endemic, over the period 1991–2003. The results for P. vivax and P. malariae are compared with those for P.
falciparum, with consideration of the age dependence of
apparent tolerance for each malaria species and implica-tions for models of malaria pathogenesis and disease bur-den.
Methods
Study area and population
The study involved residents of 29 villages in the Wosera area of East Sepik Province, Papua New Guinea. The aver-age population over the study period was 11,627 persons. Transmission is perennial with estimated inoculation rates for P. falciparum, P. vivax and P. malariae averaging 35, 12, and 10 infectious bites per annum respectively during the period of 1990–1992 [12].
A detailed description of malaria species infection rates has been presented elsewhere [13,14]. Malariometric sur-veys showed an overall decrease in overall Plasmodium
spp. prevalence rate from 60% in the early 1990s to 35% by 2002. The reduction was from 38% to 22% for P.
falci-parum, 20% to 10% for P. vivax, and 16% to 4% for P.
malariae [15]. This was probably related to gradual
Case detection and investigation
The area is serviced by two local health centers located in the villages of Kunjingini and Kaugia and the health records of 24,386 presumptive malaria cases diagnosed at these health centres during the study period. A presump-tive case of malaria was defined as an outpatient with a clinical diagnosis of malaria made by nurses staffing one or other of these health centers. The diagnostic procedures used followed the guidelines of the Papua New Guinea Department of Health [16], and usually the diagnosis of malaria was based on a history of fever without obvious symptoms or signs of another disease [17]. Malaria was the most frequent clinical diagnosis, followed by acute respiratory infections and skin conditions [18].
Treatment procedures at the health centres also followed the guidelines of the PNG Department of Health, which recommended malaria treatment for all patients with fever [16] with various changes in drug regimens during the course of the study. All individuals with a presumptive diagnosis of malaria had a blood film prepared to detect malaria parasites.
A research nurse from the Papua New Guinea Institute of Medical Research attended the outpatient clinics from 8 AM to 2 PM Monday through Friday and further investi-gated all presumptive malaria cases reporting on those days. After recording demographic information a perti-nent history of illness was taken, e.g. duration of self-appraised fever before reporting to the health center, a standardized physical examination that included auscul-tation of the chest and heart and abdominal palpation to detect pain and enlargement of the spleen and liver was performed followed by a finger prick blood sample col-lected for microscopic detection of malaria by microscopy and haemoglobin measurement (for details see [14,19]).
Cross-sectional surveys
Blood films from control subjects were collected in three series of cross-sectional community surveys conducted in 1991/92 [13], 1998/99 [20] and 2001–03[15]. Only par-asitological data from participants, who had no signs of concurrent febrile illness and did not report illness during the previous week were included. Blood film results from 31,455 participants were included in the analysis of the controls.
Laboratory examination for malaria
Blood films were stained with 4% Giemsa; 100 micro-scopic thick film fields were inspected before a slide was being declared malaria-negative. For malaria-positive blood films, parasite species were identified and densities recorded as the number of parasites per 200 WBC. This procedure was followed for each species. Densities were converted to asexual parasites per μl of blood assuming
8000 WBC per μl. Routine quality control procedures were performed [19]. Briefly, a 10% random sample of slides and all those that had a density between one and five asexual stage P. falciparum, P. vivax, P. malariae, or P. ovale were re-read by a supervisor microscopist blinded to the first reading. When the results on a batch of ~1,000 slides did not reach 75% agreement on positivity/negativ-ity, species and density (including a margin of error that increased with increasing density), the entire batch was re-read and the same quality control applied again. Clinical cases observed to be infected with more than one malaria species were included only in the analyses of the domi-nant species on the assumption that this was the most likely to be the cause of the febrile illness.
Model for dependence of fever risk on parasite density Cases corresponded to the presumptive malaria cases detected by passive case detection of persons reporting to local health centers plus a positive blood smear for malaria. Control slides were collected from asymptomatic individuals who donated during the cross-sectional sur-veys. Our analysis resolved the distribution of parasite densities in the presumptive malaria cases into two com-ponents, corresponding to non-malaria illness and to epi-sodes of clinical malaria.
The parasite densities of controls and cases were divided into K ordered categories, k = 1, 2,.., K. We define n(k) to be the number of presumptive malaria cases in parasite density category k, and θs(k) to be the corresponding pro-portion of all presumptive cases (Figure 1a). We define θc(k) to be the proportion of control individuals in cate-gory k (Figure 1b), and θm(k) to be the proportion of true clinical malaria patients in the same category (Figure 1e). θs(k) then arises as the mixture:
on the assumption that θc(k) also gives the distribution of
parasite densities in those presumptive cases that in reality have non-malaria aetiology, and where Λ is the overall proportion of cases whose illness is attributable to malaria (the malaria-attributable fraction). A latent class model was then fitted to the counts of cases and controls, using the simulation-based Bayesian approach described in detail previously[21], implemented in WinBUGS [22] (code available at http://www.sti.ch/en/research/pub altand-epidemiology/biostatistics/down loads.html)., This provided estimates both of Λand of λ(k), the mixing proportion among the cases in each category k, where:
θs( )k =Λθm( )k + −(1 Λ) ( ),θc k (1)
λ θ
θ
( ) ( )
( ) ,
k m k
s k
subject to the constraint that λ(k) is an increasing func-tion of k [21]. These were then used to obtain estimates of the number of malaria attributable cases in the category, λ (k)n(k) (Figure 1c). The effects of age and Plasmodium spe-cies were summarized by carrying out this analysis sepa-rately for each age group of host and each of the three malaria species considered.
Operating characteristics of case definitions
In epidemiological studies, clinical malaria is frequently defined to correspond to all febrile episodes with parasite densities exceeding a given cut-off value (e.g. [23-25]). Following [26], the sensitivity of the cut-off that corre-sponds to the lower bound of category C, is given by:
the positive predictive value by:
and the specificity is:
Pr(k C| ) m( )k
k C K
≥ =
=
∑
malaria episode θ (3)
Pr( | )
( ) ( )
( )
malaria episode k C
k s k
k C K s k k C K ≥ = = ∑ = ∑ λ θ θ (4)
Pr( | ( )
( ( )) ( )
( (
k C C
k s
k C
k
k
< = =
− =
− ∑
−
non-malaria illness Ψ
1 0 1
1
λ θ
λ ))) ( )
.
θs k
[image:4.612.90.470.99.418.2]k K = ∑ 0 (5) Age-, species-, and parasite density-specific data and results
Figure 1
Age-, species-, and parasite density-specific data and results. A: numbers of cases included in the analysis. B: numbers of controls included in the analysis. C: estimated numbers of malaria attributable cases. D: proportions of all cases. E: propor-tions of malaria specific cases.
P ro p o rt io n o f a ll c a s e s P ro p o rt i o n o f m a la ri a a tt ri b u ta b le c a s e s N u m b e r o f c a s e s N u m b e r o f m a la ri a a tt ri b u ta b le c a s e s N u m b e r o f c o n tr o ls
Plasmodium vivax Plasmodium malariae
Parasite density (parasites per microliter)
A B C D E 0-1yrs 1-2yrs 2-3yrs 4-6yrs 7-9yrs 10-19yrs 20+ 0 500 1000 1500 2000 2500 3000 Plasmodium falciparum <5yrs 5-9yrs 10-19yrs 20+ 0 1000 2000 3000 4000 5000 6000 0 2000 4000 6000 8000 10000 14000 12000 0 2000 4000 6000 8000 10000 14000 12000 0 2000 4000 6000 8000 10000 12000 0 200 400 600 800 1000 1200 1400 0 20 40 60 80 100 120 140 160 0 5 10 15 20 25 30 35 1 0 0.2 0.4 0.6 0.8 0 0.2 0.4 0.6 0.8 1 25600
Calculation of clinical malaria incidence
To compare malaria incidence between species and age groups at different parasite densities we estimated the approximate person-time at risk in each category, using population sizes and age distributions from the Wosera demographic surveillance system [27] and the distribu-tions of parasite densities in the control samples. The overall incidence of clinical malaria in each parasite den-sity class was then computed by dividing the total number of episodes by this overall person-time-at-risk. The esti-mated incidence was then re-scaled to give an adjusted overall incidence of presumptive malaria attending health facilities equal to our previously published estimate of 0.49 episodes per person-year [18] for outpatient visits to Kunjingini.
Results
Age patterns of infection
27.3% of blood smears from control subjects were posi-tive by blood slide for P. falciparum, 14.1% for P. vivax, 7.0% for P. malariae, and nil for P. ovale. 5.5% of slides
were positive for more than one species. Infection reached a peak prevalence in children between four and six years of age (P. vivax) and between seven and nine years of age (P. falciparum) (Figure 2)) [12,13,15]. Plasmodium malar-iae infection is much less frequent than either of the other two species and reaches a maximum prevalence of 10.3% in the 7–9 year age group. Average parasite densities in infected persons are also strongly age dependent in both cases and controls and peak at lower ages than the preva-lence of infection (Table 1).
Age patterns of presumptive malaria episodes and attributable fractions
The incidence of presumptive malaria morbidity is high-est in younger children, peaking in one year-old children (Figure 2b). The latent class model provides estimates of the proportions of these clinical attacks attributable to each of the three malaria species, in each age group, and parasite density class (Figure 1c to 1e).
Prevalence of infection and incidence of disease by age
Figure 2
Prevalence of infection and incidence of disease by age. A: prevalence of infection in controls. B: Incidence of presump-tive and attributable malaria cases.
0.0 2.0 4.0 6.0
0
20
40
60
Age (years)
In
c
id
e
n
c
e
o
f
d
is
e
a
s
e
P
re
v
a
le
n
c
e
o
f
in
fe
c
ti
o
n
(p
e
r
p
e
rs
o
n
-y
e
a
r)
(%
)
0
1
2-3
4-6
7-9
10-19 20+
A
Figure 3a gives values of λ(k) for each of the Plasmodium
species, host age groups, and parasite density categories. For each species, the youngest age group has the lowest attributable fraction at any given density (Figure 3a). For
P. vivax and P. malariae, there is a very steep increase in the attributable fraction with parasite density at around 800 parasites per μl for all age groups except the youngest, with little age variation in the curve. Plasmodium
falci-parum shows a greater difference between age groups in
attributable fractions at a given level of parasitaemia, with a general tendency (as previously reported [2]) for the older age groups to have higher attributable fractions at any given parasite density.
Operating characteristics of case definitions
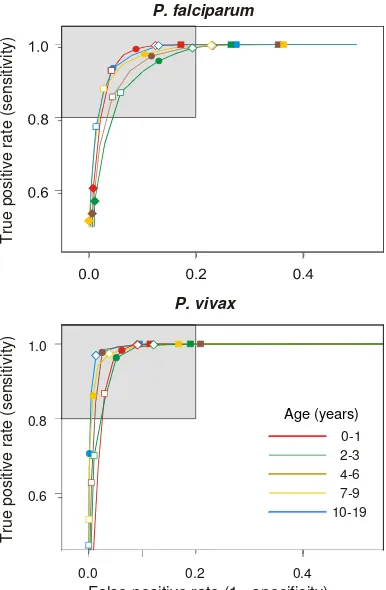
The estimates of the sensitivity of diagnostic cut-offs by age and parasite density show the inverse pattern to the corresponding attributable fractions (Figure 4 and Addi-tional file 1), indicating that a low cut-off is needed to ensure high sensitivity in older individuals, while in younger children, a higher cut-off can be used. The pat-terns are broadly similar for all three species. A high spe-cificity is achieved, even with very low cut-offs for all age groups, and for all species, but particularly for P. malariae
in which the presence of any patent parasitaemia in a
clin-ical case has an estimated specificity of over 90% in all age groups.
Age- and parasite density patterns of attributable disease The estimates of incidence of attributable disease by age and parasite density (Figure 3b) show very different pat-terns to those for the attributable fractions. Plasmodium
falciparum does indeed show some age variations (as
pre-viously reported[2]), but these are most evident at rela-tively low parasite densities. At the high parasite densities found in most P. falciparum-attributable cases, there is lit-tle difference between most of the age groups in incidence of attributable disease (Figure 3b). Children in their first year of life, however, stand out as having lower incidence than other age-groups at relatively high parasite density levels (≥ 800 parasites per μl).
P. vivax and P. malariae share a different pattern. After adjustment for the time at risk in the different density cat-egories, there seems to be almost no difference by age in parasite density specific incidence of attributable disease in the lower density classes (Figure 3b). At high parasite densities in which the data for these species are sparse, there is more variation between age groups in incidence. In contrast to P. falciparum, there is a suggestion of a
pla-Table 1: Parasites densities in clinical cases and community controls
CASES CONTROLS
Median IQR Median IQR
P. falciparum
<1 9,480 [640, 39,800] 3000 [740, 14,800]
1 19,880 [4,640, >40,000] 1,200 [160, 5,360]
2–3 21,100 [5,600, >40,000] 1,600 [320, 6,550]
4–6 17,220 [3,520, >40,000] 680 [200, 2,560]
7–9 14,840 [2,440, >40,000] 480 [160, 1,680]
10–19 9,080 [1,100, 31,460] 240 [80, 720]
20+ 1,600 [320, 9,610] 160 [80, 440]
P. vivax
<1 4,480 [240, 15,260] 120 [70, 1,520]
1 5,540 [1,360, 12,870] 480 [130, 2,960]
2–3 4,500 [920, 12,820] 440 [120, 1,600]
4–6 2,440 [320, 9,120] 200 [120, 640]
7–9 1,280 [200, 7,480] 160 [80, 280]
10–19 300 [80, 3,380] 80 [40, 200]
20+ 120 [80, 280] 80 [40, 160]
P. malariae
<1 220 [90, 350] 80 [40, 740]
1 420 [120, 1,910] 200 [40, 360]
2–3 1380 [210, 3,360] 320 [120, 800]
4–6 1160 [450, 3,240] 320 [120, 680]
7–9 960 [280, 2,400] 160 [80, 360]
10–19 440 [120, 1760] 120 [60, 200]
[image:6.612.56.549.100.419.2]teau in incidence as densities increase but this is based on very little data, as high density infections with these spe-cies are very unusual. The data for high density P. vivax
and P. malariae are rather sparse.
To translate the parasite density specific values into over-all age- and species specific incidence of disease (Figure 2b), we sum both the estimated time at risk and the number of attributable episodes across all parasite density classes. P. vivax attributable morbidity peaks in 1 year-olds, and P. falciparum morbidity peaks in 2–3 year olds (Figure 2b). P. malariae attributable clinical disease is restricted almost entirely to the 5–9 year age group, but even in this age group the incidence of 0.031 episodes per-person-year is small in comparison with that of acute ill-ness attributable to the other species.
A simple empirical relationship between parasite density and incidence of attributable disease seems to approxi-mately hold across most age-groups and all three Plasmo-dium species (ascending straight lines in Figure 3b):
where Iy is the incidence of disease episodes per person-year experienced at parasite density y parasites per μl blood. This relationship lends itself to a simple formula for estimating burden of disease from community-based parasite density distributions:
where Itotal is the incidence per person-year, which can be calculated separately for each Plasmodium species. The log ( )10 Iy =β0+β1log ( )10 y (6)
Itotal c y y dy
y
=
= ∞
∫
10 0 1
0
β θ β
( ) (7)
Attributable fractions and incidence of disease
Figure 3
Attributable fractions and incidence of disease. A: attributable fractions by age, species and parasite density. B: incidence of attributable illness by age, species and parasite density. Dashed lines correspond to the regressions given in Table 2 with the line for P. falciparum corresponding to the analysis that excludes children < 1 year old.
0.0001 0.001 0.01 0.1 1 10 100 1000
Plasmodium vivax
Plasmodium falciparum Plasmodium malariae
Parasite density (parasites per microliter)
In
c
ide
nc
e
o
f
d
ise
a
s
e
(p
er
p
e
rs
o
n
-y
ear
)
A
B
0 0.2 0.4 0.6 0.8 1
Attr
ib
u
ta
b
lef
rac
ti
o
n
200 800 6.4k 25.6k 200 800 6.4k 25.6k
0-1yrs 1-2yrs 2-3yrs 4-6yrs 7-9yrs 10-19yrs 20+
<5yrs 5-9yrs 10-19yrs 20+
estimates of β0 and β1obtained for each species by a linear regression through the datapoints in Figure 3 are remark-ably similar to each other (Table 2).
Discussion
Previous studies of malaria tolerance by age have gener-ally concentrated on the age patterns in the attributable
fractions (Figure 3a). By focusing on the diagnostic per-formance of different cut-offs and the identification of pyrogenic thresholds, such studies conclude that the age distribution of the pyrogenic threshold is similar to that of parasite densities, with high diagnostic cut-offs required in young children, who thus appear more tolerant. How-ever the diagnostic performance of these cutoffs depend not only on pyrogenic thresholds, but also on age patterns of non-malaria fevers. The present analyses allow for age-variations in overall fever incidence in reporting incidence of attributable disease and suggests different age-patterns of tolerance.
Highly relevant to the mechanism of tolerance is the ques-tion of whether it is specific for a given species of Plasmo-dium, or whether it is common to all malaria species. There may even be cross-tolerance with bacteria [9], since malariatherapy studies found that Plasmodium infection can reduce the response to bacterial endotoxins [28,29].
Prior to our study there was little epidemiological evi-dence of whether tolerance to different Plasmodium spe-cies follow similar dynamics. In the Punjab, the relationship between morbidity and parasite densities was found to be age-dependent in P. falciparum, but not so in
P. vivax [5]; however, unlike the situation in Papua New
Guinea, this was observed in an area of relatively low malaria transmission where repeated infections with dif-ferent malaria species are infrequent.
In Wosera, there are substantial differences between spe-cies in the prevalence and density of infections and in clin-ical incidence. P. falciparum is clearly the most important cause of malaria morbidity (82.9%), followed by P. vivax
(15.1%), with P. malariae accounts for only 2.1% of attrib-utable cases. However, across most densities and age groups the incidence of disease at a given parasite density is similar for all three species, and much of the variation between the lines for different age groups in Figure 3b is in the less frequent density classes (i.e. the low density classes for P. falciparum, and the higher ones for P. vivax
[image:8.612.75.268.101.396.2]and P. malariae), where sampling variation clearly plays a role. For all three species, the lowest attributable fractions at any given parasite density occur in the youngest age group (Figure 3a), but tolerance is achieved with similar age dynamics, even though infection with the different Estimated operating characteristics of cutoffs
Figure 4
Estimated operating characteristics of cutoffs. Receiver Operating Characteristic (ROC) curves of density cut-offs for the definition of P. falciparum and P. vivax clinical episodes. Shaded area: Sensitivity and Specificity > 80%. Den-sity cutoffs: filled squares: 200/μl; open diamonds: 800/μl; filled circles: 3,200/μl; open squares 12,800/μl; filled dia-monds: 40,000/μl.
P. falciparum
P. vivax
0.0 0.2 0.4
0.6 0.8 1.0
False positive rate (1 - specificity)
True po
sitiv
e
rat
e
(se
n
sitiv
ity
)
True po
sitiv
e
rat
e
(se
n
sitiv
ity
)
0-1 2-3 4-6 7-9 10-19
Age (years)
Table 2: Regression parameters for relationship of incidence of attributable disease with parasites density
Intercept β0,, [95% CI] Slope, β1, [95% CI]
[image:8.612.61.554.656.730.2]species occurs at different rates, and the age patterns of attributable morbidity are very different (Figures 3 and 2b).
The most important difference in age patterns of morbid-ity is the relatively high incidence of P. vivax morbidity compared with P. falciparum in the youngest age groups (Figure 2b). This contrasts with the higher prevalence of P. falciparum in the same age groups (Figure 2a) and with the higher entomological inoculation rate of the latter para-site[12]. This seems to mainly reflect better control of P. falciparum densities in infants than of P. vivax densities, and could reflect better protection for the former by maternal antibodies [30] or/and active sensitization in
utero [31]. Pregnant women in the Wosera are more likely
to be infected with P. falciparum than with P. vivax [32], which might lead to more acquired protection against high density parasitaemia in the former case. However it also appears to be the case that, at any given peripheral parasite density, P. falciparum is less likely to cause disease in infants than it would in older age groups.
Systematic variation in the ratio of circulating to seques-tered parasites with age has previously been suggested as explanation for patterns of age- and seasonal variation in apparent tolerance of P. falciparum in infants[33]. An important biologic difference between P. falciparum and the other species is sequestration of late trophozoites in the former, which means that the density of P. falciparum
in peripheral blood is an indirect and possibly imprecise measure of the rate of pyrogen release at schizogony. Var-iation in the ratio of circulating to sequestered parasites presumably contributes imprecision to our analyses and also lends itself as a possible explanation of why there seems to be more age variation in levels of tolerance for P. falciparum than for the other species (Figures 3), despite the greater sample size.
The interpretation of such variations also needs to take into consideration the logarithmic scales used on the axes of Figure 3b, so small differences, notably the rather higher incidence at given densities for P. vivax, are not very obvious. Even if the mechanisms of tolerance are related, equivalence cannot be assumed in the pyrogenic potential of equal parasite counts of different species, with different biochemistry. The absence of sequestration in P. vivax and
P. malariae means that the rate of schizogony relative to the circulating density must be much lower than for P. fal-ciparum, and the longer erythrocytic cycle of P. malariae
must also mean that it has an even lower rate of schizog-ony relative to the circulating density.
Variation in age-incidence patterns may also arise because of biases in the available data. Most obviously, not all epi-sodes report to a health facility, so incidence estimates
need to be adjusted for imperfect access if they are to be translated into disease burden. Age patterns in illness per-ception and help-seeking could bias the clinical incidence data, but there is no clear evidence that such biases are important in Wosera. For instance the effect of distance from health facility on help-seeking for febrile illnesses is independent of age group [18]. The control surveys were based on sampling from a complete demographic data-base representative of the population and so do not repre-sent a substantial source of bias.
Despite the effects of all these other factors, it appears that age variation in clinical incidence mainly arises because of differences in the ability to control parasitaemia, and both age- and species-variation in tolerance are secondary phe-nomena. Since tolerance may arise in tandem for the dif-ferent parasite species, this suggests there may be cross-species mechanisms of tolerance, and leads to a similar empirical relationship between parasite density and inci-dence of attributable disease for all species.
This potentially provides a practical approach for burden of disease assessments in areas with high malaria ende-micity, since it could provide a straightforward way of using representative community-based data to avoid the limitations of health management information systems. There is a clear need to evaluate the generalizability of this relationship to other settings, both to evaluate its practical utility for estimating disease burden from survey data, and for further understanding the biology of malaria toler-ance.
Conclusion
In the Wosera area of Papua New Guinea, different human malaria species show similar incidence of attribut-able disease at the same parasite densities, compatible with the hypotheses that there are pan-specific mecha-nisms of tolerance. P. falciparum shows rather greater dif-ferences in apparent tolerance between age groups than P. vivax and P. malariae, which may in part reflect differences in the ratio of circulating:sequestered parasites, rather than in levels of tolerance. The implication that variations in level of tolerance are of secondary importance in deter-mining overall disease risk and the straightforward math-ematical form that can be used to approximate the relationship between parasite density and disease risk, suggest that the latter might be useful for projecting dis-ease burden from parasite density distributions assessed in community-based parasitological surveys.
Competing interests
Authors' contributions
IM & TAS designed the study, conducted the analyses and wrote the initial draft of the paper. BG assisted in study design and with TAS and MA established the surveillance of clinical cases. LR, BK, and WK led field work and organ-ised cross-sectional surveys. PZ, JK, MA were responsible for conduct of the 1998/99 and 2001–03 surveys. All authors participated in writing of the manuscript and approved the final version.
Additional material
Acknowledgements
We are indebted to the population of the Wosera area for their commit-ment to participate in this study. We thank also the nurses at the Kunjingini health centre and all the staff at the PNG Institute of Medical Research (IMR) who contributed to the collection of morbidity surveillance data. We are also indebted to the field and laboratory assistants who carried out the field surveys and read the microscopy slides. The authors are grateful to Chris Newbold, Louis Molineaux and Allan Schapira for useful discussions and comments on earlier versions of this manuscript. This work was sup-port by the Swiss National Science Foundation (SNF project 31-52984.97), the National Institutes of Health (NIAID/NIH Grants AI063135, AI46919, and AI52312), USAID and AusAID.
References
1. Rogier C, Commenges D, Trape JF: Evidence for an age-depend-ent pyrogenic threshold of Plasmodium falciparum para-sitemia in highly endemic populations. Am J Trop Med Hyg 1996,
54:613-619.
2. Smith T, Genton B, Baea K, Gibson N, Taime J, Narara A, Al Yaman F, Beck HP, Hii J, Alpers M: Relationships between Plasmodium falciparum infection and morbidity in a highly endemic area.
Parasitology 1994, 109(Pt 5):539-549.
3. Dicko A, Mantel C, Kouriba B, Sagara I, Thera MA, Doumbia S, Diallo M, Poudiougou B, Diakite M, Doumbo OK: Season, fever preva-lence and pyrogenic threshold for malaria disease definition in an endemic area of Mali. Trop Med Int Health 2005, 10:550-556. 4. Mwangi TW, Ross A, Snow RW, Marsh K: Case definitions of clin-ical malaria under different transmission conditions in Kilifi district, Kenya. J Infect Dis 2005, 191:1932-1939.
5. Prybylski D, Khaliq A, Fox E, Sarwari AR, Strickland GT: Parasite density and malaria morbidity in the Pakistani Punjab. Am J Trop Med Hyg. 1999, 61(5):791-801.
6. Faye FB, Spiegel A, Tall A, Sokhna C, Fontenille D, Rogier C, Trape JF:
Diagnostic criteria and risk factors for Plasmodium ovale malaria. J Infect Dis 2002, 186(5):690-695.
7. Miller MJ: Observations on the natural history of malaria in the semi-resistant West African. Trans R Soc Trop Med Hyg 1958,
52:152-168.
8. Clark IA, Al-Yaman FM, Cowden WB, Rockett KA: Does malarial tolerance, through nitric oxide, explain the low incidence of autoimmune disease in tropical Africa? Lancet 1996,
348:1492-1494.
9. Boutlis CS, Yeo TW, Anstey NM: Malaria tolerance – for whom the cell tolls? Trends in Parasitology 2006, 22:371-377.
10. Dondorp AM, Desakorn V, Pongtavornpinyo W, Sahassananda D, Sil-amut K, Chotivanich K, Newton PN, Pitisuttithum P, Smithyman AM, White NJ, Day NP: Estimation of the total parasite biomass in acute falciparum malaria from plasma PfHRP2. PLoS Medicine
2005, 2:e204.
11. Ochola LB, Marsh K, Lowe B, Gal S, Pluschke G, Smith T: Estimation of the sequestered parasite load in severe malaria patients using both host and parasite markers. Parasitology 2005,
131:449-458.
12. Smith T, Hii JL, Genton B, Muller I, Booth M, Gibson N, Narara A, Alpers MP: Associations of peak shifts in age – prevalence for human malarias with bednet coverage. Trans R Soc Trop Med Hyg 2001, 95(1):1-6.
13. Genton B, Al Yaman F, Beck HP, Hii J, Mellor S, Narara A, Gibson N, Smith T, Alpers MP: The epidemiology of malaria in the Wos-era area, East Sepik Province, Papua New Guinea, in prepa-ration for vaccine trials. I. Malariometric indices and immunity. Ann Trop Med Parasitol 1995, 89(4):359-376.
14. Genton B, Al Yaman F, Beck HP, Hii J, Mellor S, Rare L, Ginny M, Smith T, Alpers MP: The epidemiology of malaria in the Wos-era area, East Sepik Province, Papua New Guinea, in prepa-ration for vaccine trials. II. Mortality and morbidity. Ann Trop Med Parasitol 1995, 89(4):377-390.
15. Kasehagen LJ, Mueller I, McNamara DT, Bockarie MJ, Kiniboro B, Rare L, Lorry K, Kastens W, Reeder JC, Kazura JW, et al.: Changing patterns of Plasmodium blood-stage infections in the Wos-era region of Papua New Guinea monitored by light micros-copy and high throughput PCR diagnosis. Am J Trop Med Hyg
2006, 75(4):588-596.
16. Health PNGDoP: Standard Treatment for Common Illnesses of Children in Papua New Guinea. Port Moresby: Department of Health; 1993.
17. Genton B, Smith T, Baea K, Narara A, Al Yaman F, Beck HP, Hii J, Alp-ers M: Malaria: how useful are clinical criteria for improving the diagnosis in a highly endemic area? Trans R Soc Trop Med Hyg 1994, 88(5):537-541.
18. Muller I, Smith T, Mellor S, Rare L, Genton B: The effect of dis-tance from home on attendance at a small rural health cen-tre in Papua New Guinea. Int J Epidemiol 1998, 27(5):878-884. 19. Genton B, D'Acremont V, Rare L, Baea K, Reeder JC, Alpers M,
Muller I: Plasmodium vivax and Misex Infections Are Associ-ated with Severe Malaria in Children: A Prospective Study from Papua New Guinea. PLOS Medicine 2008, 5:e127. 20. Kasehagen LJ, Mueller I, Kiniboro B, Bockarie MJ, Reeder JC, Kazura
JW, Kastens W, McNamara DT, King CH, Whalen CC, et al.:
Reduced Plasmodium vivax erythrocyte infection in PNG Duffy-negative heterozygotes. PLoS ONE 2007, 2(3):e336. 21. Vounatsou P, Smith T, Smith AF: Bayesian analysis of
two-com-ponent mixture distributions applied to estimating malaria attributable fractions. J Roy Stat Soc C-Applied Statistics 1998,
47(4):575-587.
22. Spiegelhalter DJ, Thomas A, Best N, Lunn D: Winbugs Version 1.4.
Cambridge, England: MRC-BSU; 2003.
23. Trape JF, Peelman P, Morault-Peelman B: Criteria for diagnosing clinical malaria among a semi-immune population exposed to intense and perennial transmission. Trans R Soc Trop Med Hyg
1985, 79:435-442.
24. Greenwood BM, Bradley AK, Greenwood AM, Byass P, Jammeh K, Marsh K, Tulloch S, Oldfield FS, Hayes R: Mortality and morbidity from malaria among children in a rural area of The Gambia, West Africa. Trans R Soc Trop Med Hyg 1987, 81:478-486. 25. Snow RW, Lindsay SW, Hayes RJ, Greenwood BM:
Permethrin-treated bed nets (mosquito nets) prevent malaria in Gam-bian children. Trans R Soc Trop Med Hyg 1988, 82(6):838-842. 26. Smith T, Schellenberg JA, Hayes R: Attributable fraction
esti-mates and case definitions for malaria in endemic areas. Stat Med. 1994, 13(22):2345-2358.
27. NETWORK I: Population, Health and Survival at INDEPTH Sites. Ottawa: IDRC; 2002.
28. Heyman A, Beeson PB: Influence of various disease states upon the febrile response to intravenous injection of typhoid bac-terial pyrogen; with particular reference to malaria and cir-rhosis of the liver. J Lab Clin Med 1949, 34(10):1400-1403.
Additional file 1
Operational characteristics of parasite cut-offs. The additional figure gives age specific values of A: Attributable fractions; B: Sensitivities; C: Specificities for each of the three Plasmodium species.
Click here for file
Publish with BioMed Central and every scientist can read your work free of charge
"BioMed Central will be the most significant development for disseminating the results of biomedical researc h in our lifetime."
Sir Paul Nurse, Cancer Research UK
Your research papers will be:
available free of charge to the entire biomedical community peer reviewed and published immediately upon acceptance cited in PubMed and archived on PubMed Central yours — you keep the copyright
Submit your manuscript here:
http://www.biomedcentral.com/info/publishing_adv.asp
BioMedcentral
29. Rubenstein M, Mulholland JH, Jeffery GM, Wolff SM: Malaria Induced Endotoxin Tolerance. Proc Soc Exp Biol Med 1965,
118:283-287.
30. Sehgal VM, Siddjiqui WA, Alpers MP: A seroepidemiological study to evaluate the role of passive maternal immunity to malaria in infants. Trans R Soc Trop Med Hyg 1989, 83(Suppl):105-106. 31. Desowitz RS: Prenatal immune priming in malaria:
antigen-specific blastogenesis of cord blood lymphocytes from neonates born in a setting of holoendemic malaria. Ann Trop Med Parasitol 1988, 82(2):121-125.
32. Garner PA: The epidemiology of maternal and neonatal health in Papua New Guinea. In MD thesis University of London; 1989.