Open Access
Research
Lutzomyia longipalpis s.l
. in Brazil and the impact of the Sao
Francisco River in the speciation of this sand fly vector
Iliano V Coutinho-Abreu
†1,4, Ivan V Sonoda
†1, Jose A Fonseca
2,
Marcia A Melo
1, Valdir Q Balbino
†1and Marcelo Ramalho-Ortigão*
†3Address: 1Departamento de Genética, Centro de Ciências Biológicas, Universidade Federal de Pernambuco, Recife, Brazil, 2Universidade Federal
do Piauí, Teresina, Brazil; Universidade Federal de Campina Grande, Campina Grande, Brazil, 3Department of Biological Sciences, University of
Notre Dame, Notre Dame, IN 46556, USA and 4Department of Biological Sciences, University of Notre Dame, Notre Dame, IN 46556, USA
Email: Iliano V Coutinho-Abreu - ivieirac@nd.edu; Ivan V Sonoda - sonodai@cpqrr.fiocruz.br; Jose A Fonseca - castro@ufpi.br; Marcia A Melo - melo@pesquisador.cnpq.br; Valdir Q Balbino - valdir@ufpe.br; Marcelo Ramalho-Ortigão* - mortigao@nd.edu * Corresponding author †Equal contributors
Abstract
Lutzomyia longipalpis s.l. (Diptera: Psychodidae) is the principal vector of Leishmania infantum chagasi
in the Americas, and constitutes a complex of species. Various studies have suggested an incipient speciation process based on behavioral isolation driven by the chemotype of male sexual pheromones. It is well known that natural barriers, such as mountains and rivers can directly influence population divergence in several organisms, including insects. In this work we investigated the potential role played by the Sao Francisco River in eastern Brazil in defining the current distribution of Lu. longipalpis s.l. Our studies were based on analyses of polymorphisms of the
cytochrome b gene (cyt b) sequences from Lu. longipalpis s.l. available in public databases, and from additional field-caught individuals. Altogether, 9 distinct populations and 89 haplotypes were represented in the analyses. Lu. longipalpis s.l. populations were grouped according to their distribution in regards to the 10°S parallel: north of 10°S (<10°S); and south of 10°S (>10°S). Our results suggest that although no polymorphisms were fixed, moderate genetic divergences were observed between the groups analyzed (i.e., FST = 0.184; and Nm = 2.22), and were mostly driven by genetic drift. The population divergence time estimated between the sand fly groups was about 0.45 million years (MY), coinciding with the time of the change in the course of the Sao Francisco River, during the Mindel glaciation. Overall, the polymorphisms on the cyt b haplotypes and the current speciation process detected in Lu. longipalpis s.l. with regards to the distribution of male sexual pheromones suggest a role of the Sao Francisco River as a significant geographical barrier in this process.
Background
Lutzomyia longipalpis s.l. (Diptera: Psychodidae) is the vec-tor of Leishmania infantum chagasi, the causative agent of visceral leishmaniasis (VL) in the New World [1-3]. This sand fly species has a wide, though discontinuous
distri-bution ranging from southern Mexico to northern Argen-tina [4]. The pattern of distribution of this sand fly is directly associated with a notable population divergence due to a reduced gene flow, allowing the appearance of sibling species [5]. In the last few years many investigators
Published: 12 June 2008
Parasites & Vectors 2008, 1:16 doi:10.1186/1756-3305-1-16
Received: 18 April 2008 Accepted: 12 June 2008
This article is available from: http://www.parasitesandvectors.com/content/1/1/16
© 2008 Coutinho-Abreu et al; licensee BioMed Central Ltd.
suggested the existence of at least four sibling species of
Lu. longipalpis s.l. in South and Central Americas, based on the study of various chromosomal and molecular markers [6-11].
Recent studies also have suggested the presence of sibling species in eastern Brazil [12,13]. These studies relied on the characterization of different male sexual pheromones, the "love songs" resulted from male wing vibration during courtship, as well as microsatellite markers and speciation genes. As many as five different chemotypes of sexual phe-romones were characterized from Lu. longipalpis s.l. in Bra-zil [14]. Three of the chemotypes are pheromones of the homosesquiterpene family, 3-methyl-α-himachalene (3MαH), methyl-germacrene-B (9MGB) and (S)-9-methyl-germacrene-B+ (9MGB+) (the latter two can be differentiated based on the amounts of 9MGB produced). Two other chemotypes are members of the diterpene fam-ily: cembrene-1 and cembrene-2. Interestingly, different chemotypes can be associated with different male copula-tion sounds or love songs generated by wing flapping: 3MαH is associated with the copulation songs Pulse songtype1; 9MGB is associated with either the Pulse songtype2 or the Pulse songtype3; cembrene-1 produc-tion is associated with Burstsong [15]. No copulaproduc-tion songs have been associated with the production of phe-romones 9MGB+ and cembrene-2 [3,14,15].
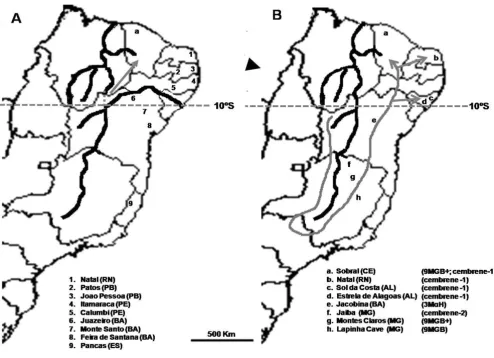
Lu. longipalpis s.l. in eastern Brazil is comprised of sibling species [3]. However, studies have yet to demonstrate a link between these sibling species and geographic barriers that potentially participate in the speciation process of this sand fly. One such barrier is the Sao Francisco River, the second largest river in Brazil extending 3160 km. The Sao Francisco runs generally north behind the coastal range before turning east to form the border between the state of Bahia and the states of Pernambuco and Alagoas. It enters the Atlantic Ocean between the states of Alagoas and Sergipe (Figure 1A). Until the Mindel glaciation period (0.4 million years ago – MY) the Sao Francisco ran northward towards the State of Piaui (Figure 1B). During the Mindel glaciation, the course of the river was altered to its current location [16], as shown in Figure 1.
Natural geographical barriers such as rivers have been shown to significantly influence genetic diversification and speciation in distinct taxa [17-21]. Thus, we analyzed the population structuring of Lu. longipalpis s.l. in eastern Brazil based on different haplotypes of the cytochrome b
gene (cyt b), and investigated the role of the Sao Francisco River in the speciation of this sand fly. Our results suggest that the natural barrier represented by the Sao Francisco River in Lu. longipalpis s.l. has played a significant role in the development of sibling species of this sand fly. The data are supported by evidence from recent studies on the
geological history of the Sao Francisco River [16]. To our knowledge, this work is the first to link the ongoing speci-ation of Lu. longipalpis s.l. in eastern Brazil with a signifi-cant natural barrier.
Methods
Sand flies
Lu. longipalpis s.l. used in this study were captured in five separate locations (Figure 1 and Table 1) using CDC light traps. Trapping of sand flies was done as described previously [22]. Adult sand flies were killed by freezing at -20°C and identified as described [4].
DNA Extraction, Amplification and Sequencing
The DNA samples were prepared as reported previously [22], and amplification of cyt b was performed using the primers N1N-5'GGCAYWTTGCCTCGAWTTCGWTATGA3' and CB3-5'CAYATTCAACCWGAATGATA3' [23]. PCR reactions were routinely carried out in 50 μl volume containing 10 pmoles of each primer, 1 ng of Lu. longipalpis s.l. DNA, 5
μl of 10× PCR buffer with 2 mM of MgCl2 (Biotools, B&M Labs, S.A. Madrid, Spain), 60 μM of dNTPs and 1.5 units of Taq DNA polymerase (Biotools). PCR reactions were performed as follows: a hot start at 94°C/3 min, followed by five cycles at 94°C/30 sec, 38°C/30 sec and 72°C/90 sec, and 35 cycles at 94°C/30 sec, 42°C/30 sec and 72°C/ 90 sec. The PCR products were purified with the Nucleos-pin Extract kit (Macherey-Nagel Inc., Easton, PA) and cycle-sequenced using the BigDye sequencing kit (Applied Biosystems, Foster City, CA), according to the manufac-turer instructions. The sequencing reactions were per-formed using an ABI PRISM® 3100 sequence analyzer
(Applied Biosystems). Each sample was sequenced twice and the sequencing quality was assessed using Phred [24] with a cutoff value of 25. The haplotypes were assembled using CAP3 [25].
Analysis of Genetic Variability
Analyses of genetic variability were performed in 34 hap-lotypes identified from Lu. longipalpis s.l. used in this work, including haplotypes described previously [26,27]. The indexes of genetic variability were estimated using DnaSP 4.10 [28]. The parameters measured were: the number of haplotypes (h); the haplotypic diversity (Hd); the number of segregating sites (S); the pairwise nucle-otide diversity (π); the net nucleotide substitution (dA);
Fs [33]. The Fs test was also used to assess population expansion.
The extent of nucleotide differentiation (FST) [34] and the level of gene flow (Nm) [35] among the populations also were analyzed using DnaSP 4.10 [28]. The FST values were plotted in a matrix and used to create a distance-based Neighbor-Joining (NJ) tree using MEGA v3.1 [36]. The Kimura-2P (K2P) genetics distance between clades of the NJ tree was also calculated using the MEGA v3.1 software.
The genetic distances were used to calculate the time of divergence between clades, based on the rate of mutation of 2.3% sequence divergence per million years [37]. The minimum spanning networks and the mismatch distribu-tions were obtained using Arlequin v2.0 [38]. Raggedness tests were performed to determine whether mismatch dis-tributions fit the model of stable or expanding popula-tions [39-41]. Also, we assessed the significance of the effect of geographic distance on differentiation via the Mantel test [42]. This test was based on the linear
[image:3.612.55.549.90.447.2]regres-Lu. longipalpis s.l. across the Brazilian NE region
Figure 1
sion between the value of the FST/(1 - FST) [43] and the geographical straight-line distance (in kilometers, Km) between each population pair. Geographic distances between capture sites were obtained from the Coordinate Distance Calculator [44]. Results of the Mantel test were a reflection of 1,000 permutations using Mantel v1.18 [45].
The populations analyzed in this study were combined into two groups, taking into account the sand fly distribu-tion in reladistribu-tion to the 10°S parallel. Thus, individuals that were originally captured north of the 10°S parallel were named <10°S; and those captured south of the 10°S par-allel, >10°S
Results
In this work we analyzed phylogeographic patterns of nat-ural populations of Lu. longipalpis s.l.. in the Brazilian NE region. Our studies were based on polymorphisms of a 261 bp DNA fragment from the 3' end of the cyt b gene. The phylogenetic signal shown by this short fragment was higher than those presented by fragments of 318 and 489 nucleotides (unpublished data). Our analyses included twenty nine haplotypes previously described [26,27] and five novel haplotypes identified from Lu. longipalpis s.l. from the Brazilian NE.
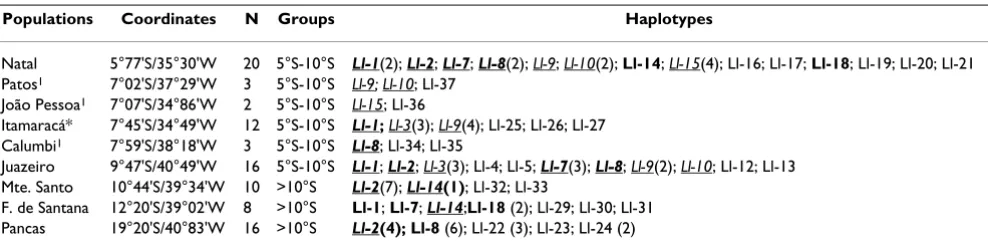
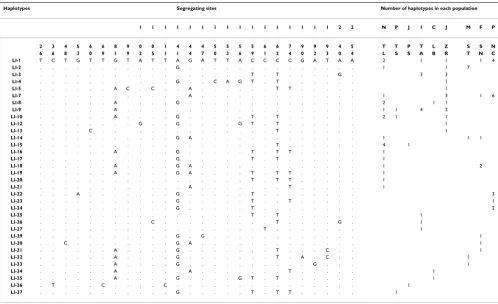
Out of 11 Lu. longipalpis s.l. individuals sequenced, nine distinct haplotypes were identified, including seven described earlier [26,27]: Ll-8 from Calumbi; Ll-3 (present in two individuals) and Ll-9 from Itamaracá; Ll-15 from João Pessoa; and Ll-9 and Ll-10 from Patos (Table 1). Five novel haplotypes were named Ll-34 and Ll-35 (from Calumbi), Ll-36 (from João Pessoa), and Ll-37 (from Patos). A total of 34 haplotypes (including the ones described by [26,27]) and their frequencies were analyzed as indicated above. The haplotypes differed up to six mutation steps and the polymorphic sites displayed no more than two variant nucleotides. The relationship
between transition and transversion among the haplo-types was 25:1, with only five substitutions being non-synonymous (at position 26, a Leu to Ser change, L26S; then, S53N, P161L, V190M, N254S).
Our data shows that Ll-2 is the most frequent haplotype and the haplotypic diversity is high (0.947) despite the geographically widespread distribution of haplotypes Ll-1, Ll-2 and Ll-7 (Tables 2 and 3). Furthermore, no genetic differences were found between the populations of Juazeiro and Natal, Juazeiro and Patos, Natal and Patos, Natal and Calumbi, and Patos and Calumbi. In contrast, the highest genetic distance was estimated between popu-lations of Itamaraca and Monte Santo (dA = 0.496%; Table
4).
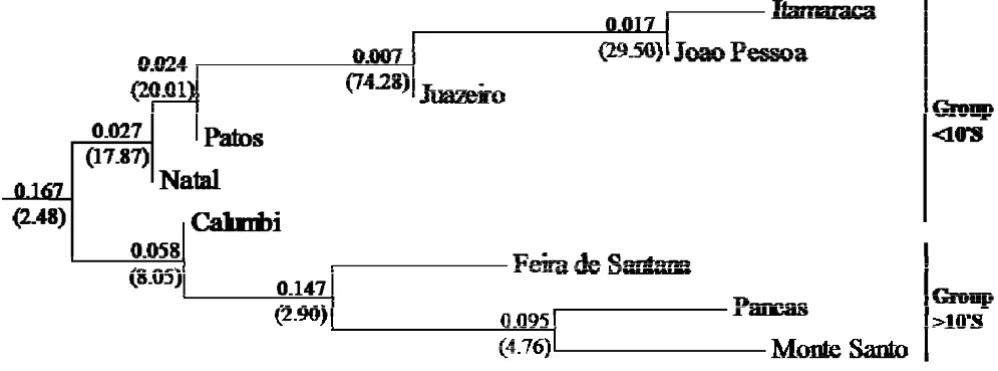
A FST distance-based Neighbor-Joining (NJ) tree was obtained for all populations investigated in this study. Two clades were identified: (I) including the populations of Natal, Patos, Juazeiro, João Pessoa, and Itamaracá; and (II) including the populations of Calumbi, Pancas, Monte Santo, and Feira de Santana (Figure 2). In light of the low level of genetic structuring and geographic distribution the two clusters seen in Figure 2 were referred to as group <10°S (for populations north of 10°S parallel) and group >10°S (for populations south of 10°S parallel). According to its geographic localization the population of Calumbi was also included in <10°S.
The net nucleotide substitution (dA) between the groups
[image:4.612.58.552.99.223.2]<10°S and >10°S was 0.217% (Table 6). The estimates of haplotypic diversity within each group were high (Table 3), although some haplotypes (Ll-1, Ll-2, Ll-7 e Ll-8) pre-sented a widespread geographic distribution. The average number of nucleotide differences (π) varied from 0.7% to 1.2% per site, or from 1.85 to 3.18 per nucleotide (Table 3), and no site were fixed at different nucleotides between groups. Within the 55 haplotypes from the group <10°S,
Table 1: Haplotype distribution in Lu. longipalpis s.l. populations investigated in this study.
Populations Coordinates N Groups Haplotypes
Natal 5°77'S/35°30'W 20 5°S-10°S Ll-1(2); Ll-2; Ll-7; Ll-8(2); Ll-9; Ll-10(2); Ll-14; Ll-15(4); Ll-16; Ll-17; Ll-18; Ll-19; Ll-20; Ll-21 Patos1 7°02'S/37°29'W 3 5°S-10°S Ll-9; Ll-10; Ll-37
João Pessoa1 7°07'S/34°86'W 2 5°S-10°S Ll-15; Ll-36
Itamaracá* 7°45'S/34°49'W 12 5°S-10°S Ll-1; Ll-3(3); Ll-9(4); Ll-25; Ll-26; Ll-27 Calumbi1 7°59'S/38°18'W 3 5°S-10°S Ll-8; Ll-34; Ll-35
Juazeiro 9°47'S/40°49'W 16 5°S-10°S Ll-1; Ll-2; Ll-3(3); Ll-4; Ll-5; Ll-7(3); Ll-8; Ll-9(2); Ll-10; Ll-12; Ll-13 Mte. Santo 10°44'S/39°34'W 10 >10°S Ll-2(7); Ll-14(1); Ll-32; Ll-33
F. de Santana 12°20'S/39°02'W 8 >10°S Ll-1; Ll-7; Ll-14;Ll-18 (2); Ll-29; Ll-30; Ll-31 Pancas 19°20'S/40°83'W 16 >10°S Ll-2(4); Ll-8 (6); Ll-22 (3); Ll-23; Ll-24 (2)
18 (32.7%) were singletons. In contrast, a lower propor-tion of singletons (20.6%, or 7 out of 34) was observed within the group >10°S.
Intra-population group analysis showed values of genetic structuring (FST) and gene flow (Nm) of 0.078 and 5.92 for the group <10°S (Table 6). Equivalent results were also obtained for the group >10°S (FST = 0.136 and Nm = 3.16, Table 6). The values of FST among the two groups support moderate genetic divergence and higher gene flow values (FST = 0.184 and Nm = 2.22, Table 6), whereas the pattern of genetic structuring did not follow the model of isolation by distance (Figure 3).
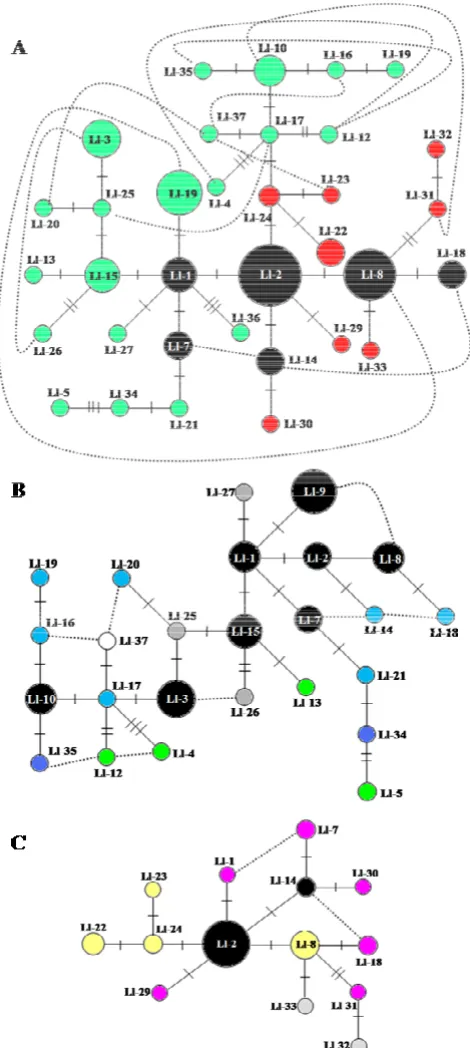
To assess gene flow between the various populations investigated, we applied the minimum spanning network (MSN) analysis (Figure 4). The MSN constructed with all
34 different haplotypes (Figure 4A) shows that most of the haplotypes shared by groups <10°S and >10°S were positioned at the interior nodes, representing ancestral haplotypes [46,47]. Thus, the Nm of 2.22 migrates per generation between groups <10°S and >10°S may reflect a greater influence from the shared ancestral polymor-phisms than by ongoing gene flow, according to the out-line of the MSN. Nevertheless, ongoing gene flow between these populations is still possible, as alternate connec-tions between the terminal haplotypes are observed (Fig-ure 4A).
[image:5.612.56.554.99.403.2]MSN analysis was separately applied to the population groups <10°S and >10°S (Figure 4B and 4C). In both cases, interior shared haplotypes were also observed for each group. However, the existence of shared haplotypes at the tips of the networks, and the connections between
Table 3: Parameters of genetic diversity for Lu. longipalpis s.l. populations used in this study.
Groups n h S Hd π θs θπ
<10°S 55 26 18 0.9475 (0.014) 0.01218 (0.00086) 0.01507 (0.0053) 3.934 >10°S 34 14 12 0.8645 (0.044) 0.00710 (0.00097) 0.01124 (0.0045) 2.935 Total 89 33 24 0.9460 (0.011) 0.01128 (0.0007) 0.01817 (0.00572) 4.743
Standard deviations are in parenthesis.
Table 2: Polymorphic sites of 34 haplotypes of ten Lu. longipalpis s.l. populations from the Eastern Brazil.
Haplotypes Segregating sites Number of haplotypes in each population
1 1 1 1 1 1 1 1 1 1 1 1 1 1 1 1 2 2 N P J I C J M F P
2 3 4 5 6 6 8 9 0 0 1 4 4 4 5 5 5 5 6 6 7 9 9 9 4 5 T T P T L Z S S N 6 6 8 3 0 9 1 9 2 5 1 1 4 7 0 3 6 9 1 2 4 0 2 3 0 4 L S S A B R T N C Ll-1 T C T G T T G T A T T A G A T T A C C C C G A T A A 2 1 1 1 4 Ll-2 . . . G . . . 1 1 7 Ll-3 . . . T . T . . . . G . 3 3
Ll-4 . . . G . . C A G T . T . . . 1
Ll-5 . . . A C . C . . A . . . T T . . . 1
Ll-7 . . . A . . . 1 3 1 6 Ll-8 . . . A . . . . G . . . 2 1 1 Ll-9 . . . A . . . 1 1 4 2 Ll-10 . . . A . . . . G . . . T . T . . . 2 1 1 Ll-12 . . . G . . G . . . . G T . T . . . 1
Ll-13 . . . . C . . . T . . . 1
Ll-14 . . . G A . . . 1 1 1 Ll-15 . . . T . . . 4 1 Ll-16 . . . A . . . . G . . . T . T T . . . 1
Ll-17 . . . G . . . T . T . . . 1
Ll-18 . . . A . . . . G A . . . 1 2 Ll-19 . . . A . . . . G A . . . . T . T T . . . 1
Ll-20 . . . T . T T . . . 1
Ll-21 . . . A . . . T . . . 1
Ll-22 . . . A . . . G . . . T . . . 3
Ll-23 . . . G . . . T . . T . . . 1
Ll-24 . . . G . . . T . . . 2
Ll-25 . . . T . T . . . 1
Ll-26 . . . C . . . T . . . . G . 1 Ll-27 . . . T . . . 1
Ll-29 . . . G . G . . . 1
Ll-30 . . C . . . G A . . . 1
Ll-31 . . . A . . . . G . . . T . . . C . . 1
Ll-32 . . . A . . . . G . . . T . A . C . . 1
Ll-33 . . . A . . . . G . . . G . . . 1
Ll-34 . . . A . . . A . . . T . . . 1
Ll-35 . . . A . . . . G . . . . G T . T . . . 1
Ll-36 . T . . . C . . . . C . . . 1
Ll-37 . . . G . . . T . T T . . . 1
[image:5.612.56.556.657.718.2]terminal haplotypes of distinct populations points to ongoing gene flow in each case, consistent with panmitic populations. For the group <10°S (Figure 4B) the strong gene flow is supported by the shared haplotype posi-tioned at the tip (Ll-9), and by several connections between terminal haplotypes of distinct populations (Fig-ure 4B). For the group >10°S, despite the presence of shared ancestral haplotypes, terminal haplotypes from three populations were connected (Figure 4C), suggesting ongoing gene flow.
Neutrality tests [48] performed between the groups <10°S and >10°S resulted in negative values. Although the esti-mates of θs and θπare higher than those of π, the D test [31] and the D* and F* tests [32] were not significant
(Tables 3 and 7). On the other hand, the Fs test [33] showed significant values for the same population groups. The mismatch distribution for groups <10°S and >10°S was unimodal (not shown), with very small raggedness statistics (0.025 and 0.050, respectively).
The genetic distances (K2P) between groups was 1.2%, between groups <10°S and >10°S. Based on cyt b molec-ular clock, the divergence time between these groups were estimated to be 0.45 million years ago (MY).
The model of isolation by distance was tested through lin-ear regression between the geographic distances and the values of FST/(1-FST). We found that the pattern of genetic
structuring of the populations was in disagreement with
[image:6.612.52.554.109.234.2]FST distance-based Neighbor-Joining tree
Figure 2
[image:6.612.57.556.481.666.2]FST distance-based Neighbor-Joining tree. Group <10°S is represented by the six populations: Calumbi, Natal, Patos, Juazeiro, João Pessoa and Itamaracá. Group >10°S encompasses the populations from Pancas, Monte Santo and Feira de San-tana. Values of FST and Nm (in parenthesis) for branches separating two populations are provided.
Table 4: The number of migrants (Nm, italics), pair wise nucleotide diversity (π, bold numbers) and net nucleotide substitution per site (dA) between ten population of Lu. longipalpis s.l.
NTL PTS JPS ITA CLB JZR MST FSN PNC
NTL 0.00974 - 6.41 3.79 - - 2.33 5.50 2.18
PTS -0.034 0.01277 2.75 5.41 - - 1.88 2.19 5.13
JPS 0.069 0.255 0.01533 29.50 2.00 17.96 1.45 1.86 1.07
ITA 0.138 0.102 0.021 0.00933 2.82 102.62 0.73 1.10 0.78
CLB -0.021 -0.255 0.383 0.218 0.01533 77.83 2.74 19.50 5.84
JZR -0.005 -0.038 0.042 0.006 0.010 0.0145 1.76 3.36 1.78
MST 0.135 0.238 0.353 0.496 0.187 0.280 0.00519 4.89 4.76
FSN 0.073 0.255 0.335 0.430 0.032 0.179 0.076 0.00958 2.00
PNC 0.174 0.089 0.489 0.475 0.089 0.282 0.00056 0.189 0.00556
the model of isolation by distance (r = 0.347, P = 0.9628; Figure 3).
Discussion
According to [14], there are five reproductively isolated populations of L. longipalpis s.l. in Brazil separated on the basis of chemotypes of the sexual pheromones they duce. The sexual pheromone 9MGB (chemotype 1) is pro-duced by Lu. longipalpis s.l from Lapinha (MG); 3MαH (chemotype 2) is produced by flies from Jacobina (BA); cembrene-1 (chemotype 3) is found in flies from Sobral (CE), Santarem (PA), and Estrela de Alagoas and Costa do Sol (AL); cembrene-2 (chemotype 4) by flies from Jaiba (MG); finally, 9MGB+ (chemotype 5) by flies from Sobral (CE) and Montes Claros (MG).
Here, the genetic structuring of ten Lu. longipalpis s.l. pop-ulations from eastern Brazil was estimated through the analysis of 26 segregating sites of a partial segment of 261 nucleotides from the mitochondrial gene cyt b. The popu-lations studied were clustered in two groups (as indicated in Materials and Methods), with individuals in group <10°S correspond to the sand flies that produce the chem-otype 3 (cembrene-1 and 9MGB+); and those in the group >10°S to chemotypes 1, 2 and 5 (9MGB, 3MαH and 9MGB+).
Intra-population analyses of groups <10°S and >10°S revealed low and moderate genetic differentiation. How-ever, in both cases, the values of Nm (Tables 4) were above the threshold required for differentiation by genetic drift
(Nm < 2, [49]). Also, the presence of several tip connec-tions between haplotypes of distinct populaconnec-tions, and a shared tip haplotype in the MSN for the group <10°S (Fig-ure 4B) suggest that ongoing gene flow is likely responsi-ble for the Nm value observed.
In contrast, inter-population analyses revealed moderate genetic differentiation and effective number of migrants
[image:7.612.53.557.100.223.2]Minimum Spanning Networks (MSN)
Figure 3
Minimum Spanning Networks (MSN). Haplotypes are coded according to the population group within which they are found. Black circles represent shared haplotypes and colored circles represent haplotypes unique to a population within a group. Size of circle is proportional to the haplotypic frequency, and each cross bar indicates one nucleotide sub-stitution between haplotypes. Dashed lines indicate alterna-tive branching between haplotypes. (A) MSN obtained from all 34 haplotypes from Lu. longipalpis s.l. used in this study. The black circles are haplotypes shared by all population groups. Colored code: group <10°S (green); and group >10°S (red). (B) MSN for group <10°S: Black circles are hap-lotypes shared by populations within this group. Colored cir-cles are haplotypes from Juazeiro (green), Natal (light blue), Itamaracá (grey), João Pessoa (orange), Patos (white) and Calumbi (dark blue). (C) MSN for group >10°S: Black circles are haplotypes shared by populations within this group. Colored circles are haplotypes specific to Pancas (yellow), Monte Santo (grey) and Feira de Santana (pink).
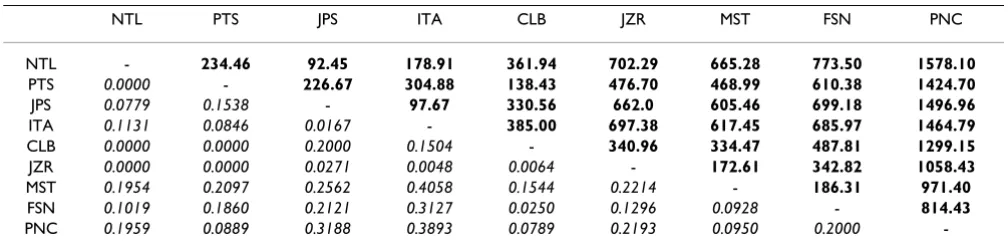
Table 5: Estimated fixation index (FST) and geographic distances (in Km) between ten Lu. longipalpis s.l populations.
NTL PTS JPS ITA CLB JZR MST FSN PNC
NTL - 234.46 92.45 178.91 361.94 702.29 665.28 773.50 1578.10
PTS 0.0000 - 226.67 304.88 138.43 476.70 468.99 610.38 1424.70
JPS 0.0779 0.1538 - 97.67 330.56 662.0 605.46 699.18 1496.96
ITA 0.1131 0.0846 0.0167 - 385.00 697.38 617.45 685.97 1464.79
CLB 0.0000 0.0000 0.2000 0.1504 - 340.96 334.47 487.81 1299.15
JZR 0.0000 0.0000 0.0271 0.0048 0.0064 - 172.61 342.82 1058.43
MST 0.1954 0.2097 0.2562 0.4058 0.1544 0.2214 - 186.31 971.40
FSN 0.1019 0.1860 0.2121 0.3127 0.0250 0.1296 0.0928 - 814.43
PNC 0.1959 0.0889 0.3188 0.3893 0.0789 0.2193 0.0950 0.2000
[image:7.612.315.552.363.498.2]-Lu. longipalpis s.l. are as shown on Table 4. FST (italics) and distances in Km (bold) are shown
Table 6: Genetic differences between population groups.
Groups <10°S >10°S
<10°S 0.078 (5.92) 0.217 (1.2) * >10°S 0.184 (2.22) 0.136 (3.16)
Estimated fixation index (FST) and the number of migrants (Nm, in
parenthesis) are shown in bold. The percentage of genetic distances
dA and dXY (in parenthesis) between groups <10°S and >10°S are
[image:7.612.53.296.635.688.2]between the groups <10°S and <10°S (Table 6). The Fs
test and the smoothness of the mismatch distribution indicated that these groups are in geographic expansion.
Since population expansion interferes with the estimates of gene flow [39-41], the Nm values obtained may be overestimated obscuring the actual population structur-ing. This, along with the prevalence of ancient introgres-sion, rather than ongoing gene flow, indicates that genetic drift is mainly responsible for the moderate genetic differ-entiation between these groups.
Our results from the cyt b molecular clock suggest that the time of divergence between the Lu. longipalpis s.l. in groups <10°S and >10°S occurred around 0.45 MY. A similar divergence period (0.39 MY) was estimated between the populations of Baturite (located north the 10°S parallel) and Jacobina (located south of the same parallel). That estimation was based on the analysis of the molecular clock of the cytochrome oxidase II gene, according to a genetic distance of K2P = 0.009 [7], and a rate of gence of 2.3% per MY [37]. The estimated time of diver-gence between the two groups investigated here correspond to the Mindel glaciation (0.38–0.41 MY) that took place during the Early to Middle Pleistocene, and was associated with the shift in the Sao Francisco River's course [16].
The Sao Francisco River is the second largest river in Bra-zil, separating the States of Pernambuco (PE) and Ceara (CE) from Bahia (BA) and Minas Gerais (MG). On its original course, the river flowed from MG, bearing north-ward through BA and continuing tonorth-wards the coast of the State of Piaui (PI) through what is today the Piaui River and the Parnaiba River Basins. Following the uplift of the Parnaiba River Basin and the formation of a transversal geological fault to Northeastern coast, the course of the Sao Francisco River was altered to its current location [16], as shown in Figure 1A.
The reduced gene flow between sibling species and mod-erate genetic differentiation between groups <10°S and >10°S are consistent with a distribution pattern likely driven by the Sao Francisco River. Additionally, the esti-mated time of the divergence of these two groups coin-cides with the change of the river course. However, this divergence cannot be associated with reduced gene flow as mitochondrial DNA is prone to introgress through incipi-ent species boundaries [50], and as demonstrated via cyt b
[image:8.612.58.293.88.612.2]gene analysis of Lu. longipalpis s.l. sympatric cryptic species
Table 7: Neutrality tests.
Groups Tajima's D Fu and Li's D* Fu and Li's F* Fu's Fs
<10°S -0.59541 -2.05938 -1.83948 -17.846(1) >10°S -1.17300 -0.96221 -1.20805 -8.309(1)
Neutrality tests (for both neutral evolution and population demography) were performed as indicated in the text. Significant values were those which P < 0.05, indicated by (1).
Mantel Test
Figure 4
Mantel Test. Correlation between the genetic structuring and the geographical distances between the 9 populations of
[51]. Taken together, the data suggest that the Sao Fran-cisco River is a significant geographic barrier between populations of Lu. longipalpis s.l., and could also have con-tributed to the current level of population diversity seen for this sand fly.
This putative role of the Sao Francisco River in the specia-tion of Lu. longipalpis s.l. may also explain the current dis-tribution of male sexual pheromones chemotypes. A plausible scenario is based on the suggestion that 9MGB represents an ancestral chemotype pheromone and that the diterpenes (i.e., cembrene-1 and 2) are more recent chemotypes [14]. Dispersal of Lu. longipalpis s.l. belonging to the Brazilian clade [7] is estimated to have occurred in the Plioceno-Pleistocene [52] when the Sao Francisco River flowed on a South-to-North direction [16]. Thus, the Sao Francisco River would have served as a barrier to the introduction of the 9MGB chemotype in the Brazilian NE coast.
The current chemotype distribution in the Brazilian NE possibly followed a process similar to what is described for the ring species hypothesis [53]. Under this hypothesis
Lu. longipalpis s.l. would have reached the coastal areas of the NE by circumventing the River's nascent, along its west margin, in Minas Gerais, South Eastern Brazil (as shown in Figure 1B). This process led to the adaptation to differ-ent habitats, and to differdiffer-entiation into a population pro-ducing the cembrane-1 chemotype presently found in the NE of Brazil. This idea is supported by the presence of Lu. longipalpis s.l. in the Brazilian SE producing different phe-romone chemotypes, such as 9MGB found in Lapinha Cave, cembrene-2 in found in Jaiba, and 3MαH found in Jacobina [14,54]. This scenario also supports the sugges-tion that Lu. longipalpis s.l. sibling species currently found in Sobral were the result of vicariance 1MY ago [55], and prior to the change in the course of the Sao Francisco River. Thus, the sympatric species in Sobral were isolated by the Sao Francisco River, leading to the development of 9MGB+ on the west and cembrene-1 on the east margins. Following the shift of the Sao Francisco River these species reached the current secondary contact proposed by [55] (Figure 1A). Our results suggesting greater similarity between Lu. longipalpis s.l. from Juazeiro (located on the southern rim of the Sao Francisco River) and flies belong-ing to group <10°S in comparison to flies belongbelong-ing to group >10°S can be explained by a recent break-down of this geographic barrier, either by a recent geographic acci-dent or through human activity in the region. This is con-sistent with our data indicating that no ongoing mitochondrial DNA haplotype exchange is detected between individuals from Juazeiro and individuals from group >10°S (Figure 4A).
Lu. longipalpis s.l. secreting cembrene-1 also are present in areas other than the Brazilian NE [14,54,56]. In two such areas (Marajo Island and Santarem), the presence of cem-brene-1 was possibly due to a recent geographic expan-sion after the change in course of the Sao Francisco River. A study using microsatellite analysis indicated strong sim-ilarities between Lu. longipalpis s.l. from Marajo Island and flies from either Sobral or Natal [56]. Accordingly, our data supports a pattern compatible with population expansion from the latter two locations towards the former based on the mismatch distribution. In regards to the cembrene-1 population currently found in Espirito Santo do Pinhal, Sao Paulo [57], biogeographic and genetic studies are necessary in order to explain its origin.
Conclusion
Based on the data presented here we propose that the Sao Francisco River restricted gene flow between Lu. longipalpis s.l., participating in speciation processes of this sand fly. This paper contributes to our understanding on the expansion of Lu. longipalpis s.l. in Brazil and provides novel clues in regards to several aspects of the divergence of this important vector species.
Competing interests
The authors declare that they have no competing interests.
Authors' contributions
IVCA participated in the conception of the study, analyses of the data, and drafting of the manuscript; IVS partici-pated in data analyses and design of the study; JAF and MAM participated in sample collection; VQB and MRO participated in the conception and design of the study and crafting of the manuscript.
Acknowledgements
We are grateful to Alexandre Magalhães Martins (PPGG-UFPE) for techni-cal assistance.
References
1. Ashford RW: Leishmaniasis as emerging and reemerging zoonoses. Int J Parasitol 2000, 30:1269-1281.
2. Lainson R, Rangel EF: Lutzomyia longipalpis and the eco-epide-miology of American visceral leishmaniasis, with particular reference to Brazil: a review. Mem Inst Oswaldo Cruz 2005,
100(8):811-827.
3. Bauzer LG, Souza NA, Maingon RD, Peixoto AA: Lutzomyia longi-palpis in Brazil: a complex or a single species? A mini-review.
Mem Inst Oswaldo Cruz 2007, 102(1):1-12.
4. Young D, Duncan M: Guide for identification and geographic distribution of Lutzomyia sand-flies in Mexico, the West Indies, Central and South America (Diptera: Psychodidae).
Mem Am Entomol Inst 1994, 54:1-881.
5. Black IV, Mustermann L: Molecular taxonomy and systematics of arthropod vectors. In Biology of Disease Vectors second edition. Edited by: WC M. Amsterdam , Elsevier Academic Press; 2005:297-310.
7. Arrivillaga JC, Norris DE, Feliciangeli MD, Lanzaro GC: Phylogeog-raphy of the neotropical sand fly Lutzomyia longipalpis inferred from mitochondrial DNA sequences. Infect Genet Evol 2002, 2(2):83-95.
8. Lanzaro GC, Ostrovska K, Herrero MV, Lawyer PG, Warburg A:
Lutzomyia longipalpis is a species complex: genetic diver-gence and interspecific hybrid sterility among three popula-tions. Am J Trop Med Hyg 1993, 48(6):839-847.
9. Soto SI, Lehmann T, Rowton ED, Velez BI, Porter CH: Speciation and population structure in the morphospecies Lutzomyia longipalpis (Lutz & Neiva) as derived from the mitochondrial ND4 gene. Mol Phylog Evol 2001, 18(1):84-93.
10. Yin H, Mutebi JP, Marriott S, Lanzaro GC: Metaphase karyotypes and G-banding in sandflies of the Lutzomyia longipalpis com-plex. Med Vet Entomol 1999, 13(1):72-77.
11. Yin H, Norris DE, Lanzaro GC: Sibling species in the Llutzomyia longipalpis complex differ in levels of mRNA expression for the salivary peptide, maxadilan. Insect Mol Biol 2000,
9(3):309-314.
12. Bauzer LG, Souza NA, Ward RD, Kyriacou CP, Peixoto AA: The period gene and genetic differentiation between three Bra-zilian populations of Lutzomyia longipalpis. Insect Mol Biol 2002, 11(4):315-323.
13. Maingon RD, Ward RD, Hamilton JG, Noyes HA, Souza N, Kemp SJ, Watts PC: Genetic identification of two sibling species of Lut-zomyia longipalpis (Diptera: Psychodidae) that produce dis-tinct male sex pheromones in Sobral, Ceara State, Brazil.
Mol Ecol 2003, 12(7):1879-1894.
14. Hamilton JG, Maingon RD, Alexander B, Ward RD, Brazil RP: Anal-ysis of the sex pheromone extract of individual male Lutzo-myia longipalpis sandflies from six regions in Brazil. Med Vet Entomol 2005, 19(4):480-488.
15. Maingon RD, Ward RD, Hamilton JG, Bauzer LG, Peixoto AA: The Lutzomyia longipalpis species complex: does population sub-structure matter to Leishmania transmission? Trends Parasitol 2008, 24(1):12-17.
16. Mabesoone JM: Sedimentary basins of northeast Brazil. Recife , Federal University of Pernambuco; 1994:310.
17. Hall JPW, Harvey DJ: The phylogeography of Amazonia revis-ited: New evidence from riodinid butterflies. Evolution 2002,
35:829-843.
18. Rodriguez-Robles JA, Jezkova T, Leal M: Genetic structuring in the threatened ‘‘Lagartijo del Bosque Seco” (Anolis cooki) from Puerto Rico. Molecular Phylogenetics and Evolution 2008,
46:503-514.
19. Wilson GM, Den Brussche RA, McBee K, Jonhson LA, Jones CA:
Intraspecific phylogeography of red squirrels (Tamiasciurus hudsonicus) in the central rocky mountain region of North America. Genetica 2005, 125:141-154.
20. Wood DA, Fisher AN, Reeder TW: Novel patterns of historical isolation, dispersal, and secondary contact across Baja Cali-fornia in the Rosy Boa (Lichanura trivirgata). Molecular Phylo-genetics and Evolution 2008, 46:484-502.
21. Miller MP, Haig SM, Wagner RS: Phylogeography and Spatial Genetic Structure of the Southern Torrent Salamander: Implications for Conservation and Management. Journal of Heredity 2006, 97(6):561-570.
22. de Queiroz Balbino V, Coutinho-Abreu IV, Sonoda IV, Melo MA, de Andrade PP, de Castro JA, Rebelo JM, Carvalho SM, Ramalho-Ortigao M: Genetic structure of natural populations of the sand fly Lutzomyia longipalpis (Diptera: Psychodidae) from the Bra-zilian northeastern region. Acta Trop 2006, 98(1):15-24. 23. Ready PD, Day JC, Souza AA, Rangel EF, Davies CR: Mitochondrial
DNA characterization of populations of Lutzomyia whitm-ani (Diptera: Psychodidae) incriminated in the peri-domes-tic and silvaperi-domes-tic transmission of Leishmania species in Brazil.
Bull Entomol Res 1997, 87:187-195.
24. Esseghir S, Ready PD, Killick-Kendrick R, Ben-Ismail R: Mitochon-drial haplotypes and phylogeography of Phlebotomus vec-tors of Leishmania major. Insect Mol Biol 1997, 6(3):211-225. 25. Huang X, Madan A: CAP3: A DNA sequence assembly
pro-gram. Genome Res 1999, 9(9):868-877.
26. Hodgkinson VH, Birungi J, Haghpanah M, Joshi S, Munstermann LE:
Rapid identification of mitochondrial cytochrome B haplo-types by single strand conformation polymorphism in
Lutzo-myia longipalpis (Diptera: Psychodidae) populations. J Med Entomol 2002, 39(4):689-694.
27. Hodgkinson VH, Birungi J, Quintana M, Dietze R, Munstermann LE:
Mitochondrial cytochrome b variation in populations of the visceral leishmaniasis vector Lutzomyia longipalpis across eastern Brazil. Am J Trop Med Hyg 2003, 69(4):386-392. 28. Rozas J, Sanchez-DelBarrio JC, Messeguer X, Rozas R: DnaSP, DNA
polymorphism analyses by the coalescent and other meth-ods. Bioinformatics 2003, 19(18):2496-2497.
29. Tajima F: Evolutionary relationship of DNA sequences in finite populations. Genetics 1983, 105(2):437-460.
30. Watterson GA: On the number of segregating sites in geneti-cal models without recombination. Theor Popul Biol 1975,
7(2):256-276.
31. Tajima F: Statistical method for testing the neutral mutation hypothesis by DNA polymorphism. Genetics 1989,
123(3):585-595.
32. Fu YX, Li WH: Statistical tests of neutrality of mutations.
Genetics 1993, 133(3):693-709.
33. Fu YX: Statistical tests of neutrality of mutations against pop-ulation growth, hitchhiking and background selection. Genet-ics 1997, 147(2):915-925.
34. Hudson RR, Boos DD, Kaplan NL: A statistical test for detecting geographic subdivision. Mol Biol Evol 1992, 9(1):138-151. 35. Hudson RR, Slatkin M, Maddison WP: Estimation of levels of gene
flow from DNA sequence data. Genetics 1992, 132(2):583-589. 36. Kumar S, Tamura K, Nei M: MEGA3: Integrated software for Molecular Evolutionary Genetics Analysis and sequence alignment. Brief Bioinform 2004, 5(2):150-163.
37. Brower AV: Rapid morphological radiation and convergence among races of the butterfly Heliconius erato inferred from patterns of mitochondrial DNA evolution. Proc Natl Acad Sci U S A 1994 , 91(14):6491-6495.
38. Arlequin-v2: [http://lgb.unige.ch/arlequin/].
39. Slatkin M, Hudson RR: Pairwise comparisons of mitochondrial DNA sequences in stable and exponentially growing popula-tions. Genetics 1991, 129(2):555-562.
40. Rogers AR, Harpending H: Population growth makes waves in the distribution of pairwise genetic differences. Mol Biol Evol 1992, 9(3):552-569.
41. Harpending HC: Signature of ancient population growth in a low-resolution mitochondrial DNA mismatch distribution.
Hum Biol 1994, 66(4):591-600.
42. Mantel N: The detection of disease clustering and a general-ized regression approach. Cancer Res 1967, 27(2):209-220. 43. Rousset F: Genetic differentiation and estimation of gene flow
from F-statistics under isolation by distance. Genetics 1997,
145(4):1219-1228.
44. Coordinate-Distance-Calculator: [http://life.bio.sunysb.edu/morph/]. 45. Mantel-v1.18: . [http://life.bio.sunysb.edu/morph/].
46. Bandelt HJ, Forster P, Röhl A: Median-joining networks for infer-ring intraspecific phylogenies. Mol Biol Evol 1999, 16:37-48. 47. Donnelly MJ, Pinto J, Girod R, Besansky NJ, Lehmann T: Revisiting
the role of introgression vs shared ancestral polymorphisms as key processes shaping genetic diversity in the recently separated sibling species of the Anopheles gambiae com-plex. Heredity 2004, 92(2):61-68.
48. Nei M: Molecular evolutionary genetics. New York , Columbia University press; 1987:512.
49. Slatkin M: Gene flow and the geographic structure of natural populations. Science 1987, 236(4803):787-792.
50. Coyne JA, Orr HA: Speciation. Sinauer; 2004:545.
51. Ward RD, Ready P, Watts PC: A molecular analysis of the Lut-zomyia longipalpis species complex. 2001, Abstracts Book:127.
52. Conn JE, Mirabello L: The biogeography and population genet-ics of neotropical vector species. Heredity 2007, 99(3):245-256. 53. Mayr E: Systematics and the Origin of Species. New York ,
Columbia University Press; 1942.
54. Casanova C, Hamilton JGC, Trigo JR, Costa AIP: Identification of Sex Pheromones of Lutzomyia longipalpis (Lutz & Neiva, 1912) populations from the State of Sao Paulo, Brazil. Mem Inst Oswaldo Cruz 2006, 101(1):113-115.
Publish with BioMed Central and every scientist can read your work free of charge
"BioMed Central will be the most significant development for disseminating the results of biomedical researc h in our lifetime."
Sir Paul Nurse, Cancer Research UK
Your research papers will be:
available free of charge to the entire biomedical community
peer reviewed and published immediately upon acceptance
cited in PubMed and archived on PubMed Central
yours — you keep the copyright
Submit your manuscript here:
http://www.biomedcentral.com/info/publishing_adv.asp
BioMedcentral
between two putative sympatric species of the Lutzomyia longipalpis complex. Mol Biol Evol 2002, 19(9):1624-1627. 56. Watts PC, Hamilton JG, Ward RD, Noyes HA, Souza NA, Kemp SJ,
Feliciangeli MD, Brazil R, Maingon RD: Male sex pheromones and the phylogeographic structure of the Lutzomyia longipalpis species complex (Diptera: Psychodidae) from Brazil and Venezuela. Am J Trop Med Hyg 2005, 73(4):734-743.