Rochester Institute of Technology
RIT Scholar Works
Theses Thesis/Dissertation Collections
2007
Anomaly-based botnet detection for 10 Gb/s
networks
Jonathon Donaldson
Follow this and additional works at:http://scholarworks.rit.edu/theses
This Thesis is brought to you for free and open access by the Thesis/Dissertation Collections at RIT Scholar Works. It has been accepted for inclusion in Theses by an authorized administrator of RIT Scholar Works. For more information, please [email protected].
Recommended Citation
Copyright
by
Jonathon W. Donaldson
The Thesis Committee for Jonathon W. Donaldson
certifies that this is the approved version of the following Thesis:
Anomaly-based Botnet Detection
for 10 Gb/s Networks
Supervising Committee:
James M. Kwon, Chair Date
Carl H. Reynolds, Reader Date
Lawrence F. Tolendino, Observer Date
Anomaly-based Botnet Detection
for 10 Gb/s Networks
1,2by
Jonathon W. Donaldson
Sandia National Laboratories
Thesis
Presented to the Faculty of the Graduate School of the
Rochester Institute of Technology
in Partial Fulfillment
of the Requirements
for the Degree of
MASTER OF SCIENCE
in
Computer Science
May 2007
1Thesis Website: [10] 2Document typeset with LA
Acknowledgments
First and foremost, I would like to thank God for His grace, love, and guidance; without which this thesis would not have been possible.
I would also like to thank my department manager, Patrick L. Manke, and Sandia National Laboratories for providing me with the required software, hardware, and research time required to complete this thesis.
I am extremely grateful to my fellow colleagues for their infinite help and motivation. Specifi-cally, I would like to thank Dennis Bateman, Jim Binkley, Diana Eichert, Steve Gossage, Richard Hu, Luis Martinez, Livio Ricciulli, Larry Tolendino, and Jason Wertz.
I would especially like to thank all of the amazing faculty at the Rochester Institute of Tech-nology. I am deeply indebted to each one of them for their tutelage and support over the last six years.
Finally, I would like to thank my fianc´ee for her support, encouragement, and sense of humor; her companionship has been invaluable in all facets of life.
Abstract
Anomaly-based Botnet Detection
for 10 Gb/s Networks
Jonathon W. Donaldson, M.S. Rochester Institute of Technology, 2007
Chair: James M. Kwon
Current network data rates have made it increasingly difficult for cyber security specialists to pro-tect the information stored on private systems. Greater throughput not only allows for higher productivity, but also creates a “larger” security hole that may allow numerous malicious applica-tions (e.g. bots) to enter a private network. Software-based intrusion detection/prevention systems are not fast enough for the massive amounts of traffic found on 1 Gb/s and 10 Gb/s networks to be fully effective. Consequently, businesses accept more risk and are forced to make a conscious trade-off between threat and performance.
A solution that can handle a much broader view of large-scale, high-speed systems will allow us to increase maximum throughput and network productivity. This paper describes a novel method of solving this problem by joining a pre-existing signature-based intrusion prevention system with an anomaly-based botnet detection algorithm in a hybrid hardware/software implementation.
Contents
Acknowledgments 5
Abstract 6
List of Tables 9
List of Figures 10
List of Acronyms 13
1 Introduction 14
1.1 Motivation. . . 14
1.2 Botnets . . . 15
2 Intrusion Detection/Prevention Systems 17 2.1 Force10 P-Series Overview . . . 17
2.2 Snort (Signatures) . . . 20
2.3 Ourmon (Anomalies) . . . 20
2.4 Signatures vs. Anomalies . . . 22
3 Algorithm Implementation 24 3.1 Hardware Design Component. . . 24
3.1.1 Packet Data Parsing . . . 24
3.1.2 Floating-Point Unit Failure . . . 25
3.1.3 Flow Memory Data Storage . . . 26
3.1.4 Flow Hashing . . . 28
3.1.5 Multiple Clock Domains . . . 29
3.1.6 Algorithm Instantiation. . . 30
3.2 Software Design Component . . . 34
3.2.1 Retrieving the Work-Weight Data . . . 34
3.2.2 Software Flow . . . 35
4 Results Analysis 39
4.1 Network Setup . . . 39
4.1.1 Hardware Implemented Ourmon Testing. . . 40
4.1.2 Software Implemented Ourmon Testing . . . 41
4.2 Success Criteria . . . 41
4.2.1 Criteria 1 . . . 42
4.2.2 Criteria 2 . . . 42
4.2.3 Criteria 3 . . . 43
5 Practical Applications 44 5.1 Security and Visibility . . . 44
5.2 Limitations . . . 46
6 Conclusions 47 7 Future Work 48 Appendices 50 A API Signal Descriptions 51 A.1 Data Interface . . . 51
A.1.1 Input Signals . . . 51
A.1.2 Output Signals . . . 53
A.2 Control Interface . . . 53
A.2.1 Input Signals . . . 53
A.2.2 Output Signals . . . 54
B Packet Data Bit Definitions 55 C P10 Native Statistics 57 D 10 Gb/s Interface Structure 60 E Verification 64 F Code Listing 65 F.1 Hardware (Verilog HDL) . . . 65
F.2 Software (C Code) . . . 65
List of Tables
3.1 Packet Offset 0 . . . 25
3.2 Packet Offset 1 . . . 25
3.3 Packet Offset 2 . . . 25
3.4 Packet Offset 3 . . . 25
4.1 Network Resources (Hardware Test) . . . 40
4.2 Network Resources (Software Test) . . . 41
B.1 Offset 0 Bit Definitions . . . 55
B.2 Offset 1 Bit Definitions . . . 55
B.3 Offset 2 Bit Definitions . . . 56
List of Figures
1.1 Botnet Creation and Usage . . . 16
2.1 High-Level Block Diagram of P10 . . . 19
2.2 Logic Diagram of Traffic Flow in the P10 . . . 19
2.3 Signature Detection Process . . . 20
2.4 Anomaly Detection Process. . . 22
3.1 Hardware Design Block Diagram . . . 32
3.2 Completed Hybrid System . . . 33
3.3 Software Design Flow Chart . . . 36
4.1 Hardware Implemented Ourmon Test Network. . . 41
4.2 Software Implemented Ourmon Test Network . . . 42
5.1 2010 SNL/NM WAN ESnet and ASC WAN Configuration . . . 45
D.1 10 Gb/s Interface Structure Model . . . 61
D.2 10 Gb/s Interface Structure Block Diagram Level 1 . . . 61
D.3 10 Gb/s Interface Structure Block Diagram Level 2 . . . 62
List of Acronyms
API Application Programming Interface, 14, 24,
30,37,46,47,49,51,65
ASICs Application Specific Integrated Circuits,48
BARs Base Address Registers,34
BRAM Block Random Access Memory, 27–29, 34,
37,43,49
CCI Command and Control Interface,15,16
CLI Command Line Interface,48
CPLD Complex Programmable Logic Device, 17,
18,52
CPU Central Processing Unit,57
CPUs Central Processing Units,27
DDoS Distributed Denial of Service,15
DDR Double Data Rate,17,18
DMA Direct Memory Access,18,51–53,57
DPI Dynamic Parallel Inspection,51
ESnet Energy Sciences Network,44
FPGA Field Programmable Gate Array,17, 18, 24,
27,29,30,34,37,46,49,55,57,58
FPGAs Field Programmable Gate Arrays,17,29,46,
49
FPU Floating Point Unit,25,26,49,65
F10 Force10 Networks Inc., 14, 18, 24, 30, 34,
37,39,46,48,49,51,57
F10P Force10 P-Series,14, 15, 18, 20, 23,24, 34,
P1 Force10 P-Series (1 Gb/s),48
P10 Force10 P-Series (10 Gb/s), 17, 24, 27, 31,
34,39–41,43,44,46,48,49,51–53,67
HDL Hardware Description Language,24,27
HTTP Hyper Text Transfer Protocol,51
ICCCN International Conference on Computer Com-munications and Networks,67
ICMP Internet Control Message Protocol,58
ID/PS Intrusion Detection/Prevention System,18
ID/PS Intrusion Detection/Prevention Systems,15
IFG Inter-Frame Gap,26
IP Internet Protocol, 21, 24, 25, 28, 29, 40, 49,
55
IPS Intrusion Prevention System, 14, 17, 39, 40,
44,67
IPv4 Internet Protocol version 4,17,18
IPv6 Internet Protocol version 6,46,48
IRC Internet Relay Chat,16,21
ISA Industry Standard Architecture,34
JTAG Joint Test Action Group,17
LANL Los Alamos National Laboratories,42
LSBs Least Significant Bits,29
L2 Level-2,27
MAC Media Access Controller,24,52,68
MB Megabytes,22
MDI Media Dependent Interface,17
MMIO Memory-Mapped I/O,53
MSB Most Significant Bit,29
NIC Network Interface Card,26,34
NM New Mexico,44
NPSC National Physical Science Consortium, 15,
67
OS Operating System,34,46,54,65
PAR Place and Route,25,49
PCI Peripheral Component Interconnect, 24, 34,
52,53,65
PLS Physical Layer Signaling,25
P2P Peer-To-Peer,21,49
RTT Round Trip Time,49
SDR Single Data Rate,17
SERDES Serializer De-Serializer,17
SETI Search For Extra-Terrestrial Intelligence,67
SFD Start of Frame Delimiter,25,26,52
SNL Sandia National Laboratories,14,41,43,44,
46,48,67
SPAN Switched Port Analyzer,46
SRAM Static Random Access Memory,53
SRUTI Steps to Reducing Unwanted Traffic on the Internet,67
SSH Secure Shell,24
TCP Transmission Control Protocol, 21, 24, 25,
27,40,49,55,58
ToS Type of Service,28
TUI Textual User Interface,14,37,48,65
UCF User Constraints File,65
UDP User Datagram Protocol,58
URI Uniform Resource Identifier,51
U.S. United States,48
WAN Wide Area Network,27,39,40,44
WW Work-Weight, 21, 24–27, 31, 35, 37, 39–42,
48,49,65
XAUI 10 Gb/s Attachment Unit Interface, 17, 18,
67,68
XC2VP50 Xilinx® Virtex™-II Pro 50,17,18,24,51
XC2VP70 Xilinx® Virtex™-II Pro 70, 17, 24, 27, 37,
44,51
XGMAC 10 Gb/s Media Access Controller,17,18
XGMII 10 Gb/s Media Independent Interface,18,68
XGXS XGMII Extender Sublayer,68
CHAPTER
1
Introduction
Current network data rates have made it increasingly difficult to enforce cyber security policies. Greater throughput not only allows for higher productivity, but also creates a “larger” security hole that can allow numerous malicious applications (e.g. bots) to enter a private network. Software-based Intrusion Prevention System (IPS) usually reside on endpoints and lack visibility of the entire network because they are not fast enough for the massive amounts of traffic found on 1 Gb/s and 10 Gb/s links. Consequently, businesses accept more risk and are forced to make a conscious trade-off between threat and performance.
For these reasons and many more a solution is required that can handle a much broader view of the network (i.e. more traffic without dropping packets). This will allow for an increase in max-imum throughput and business productivity. Aside from human efforts, we propose that the next best method for monitoring network traffic is a hardware-based implementation. Network security devices that have been completely implemented in hardware are able to bypass the processor and bus arbitration of shared local resources with which software implementations must contend. In this paper it is shown that botnet detection for 10 Gb/s networks can be much more efficiently and effectively done in hardware than in software.
Our contributions include the addition of an anomaly detection engine to a pre-existing signa-ture detection engine in hardware. This hybrid system is capable of processing full-duplex 10 Gb/s traffic in real-time with no packet loss. The behavior-based algorithm and Textual User Interface (TUI) are customizable. This research has also led to improvements of the vendor supplied signal and Application Programming Interface (API) specifications which we have made readily available in AppendicesA,B,C, andDof this report.
1.1
Motivation
The author’s current employer, Sandia National Laboratories (SNL) [8], owns the 10 Gb/s ver-sion of theF10P.1In section 2.4we will discuss the added benefits of having a hybrid implemen-tation that can filter traffic based on pattern recognition and behavioral analysis. This paper will describe the addition of anomaly-based detection to this system and the practical applications for this device in evolving corporate networks where bandwidth is increasing by orders of magnitude. Additionally, since the author is attending college under a Sandia sponsored National Physical Science Consortium (NPSC) [7] fellowship, this project was required to benefit at least one of Sandia’s many areas of research while still fulfilling the requirements for his degree. With an educational background in both computer engineering and computer science, the author took the opportunity to work with theF10Pknowing that it would be a good blend of both curricula.
1.2
Botnets
Intrusion Detection/Prevention Systems (ID/PS) are meant to protect a private network from unau-thorized access. Network security professionals must contend with various outsider and insider threats every day. Attackers commonly use special programs (e.g. worms, viruses, trojans) to ex-ploit a security hole in a computer system and breach corporate firewalls. This malware may carry programs referred to as “bots” that are used to assist in attacks.
A “botnet” is a collection of bots, each of which run on a different victim’s machine without their knowledge or consent. Because of their increased versatility, bots are a growing threat to the internet while virus outbreaks have become less common. Cyber criminals are now often motivated by financial gain rather than destruction. See articles [2, 11, 13–16, 21, 22, 26,32] for more information on the evolving threat of botnets.
Botnets are maintained by “bot herders” and managed through a Command and Control Inter-face (CCI). Many bots are written in very well-structured and object-oriented code making them extremely easy to customize. TheCCI is utilized either by the bot herder or by a client that has paid for the services that the botnet can provide. These services include:
• Spam- junk e-mail and, even more specifically, phishing e-mails have accounted for billions of dollars lost to banks and clearing houses each year [30].
• Click Fraud - an attacker may use a bot to automatically click online advertisements for their own financial gain.
• Identity Theft- bots may be used to collect and send personal information, including pass-words and account numbers, back to the bot-herder via key logging, traffic sniffing, etc..
• Distributed Denial of Service (DDoS) Attacks- DDoS attacks are easily generated with a botnet. Bandwidth and local resource consumption can cause loss of connectivity/services and cost businesses substantial sums of money.
• Distributed Processing - an attacker may use a victim’s local computational resources to process data that would otherwise take a single computer weeks or even years to complete (e.g. decryption of classified data). The SETI@home [1] and Folding@home [34] processing model operates in a very similar manner but they are both used for constructive research purposes rather than malicious exploitation.
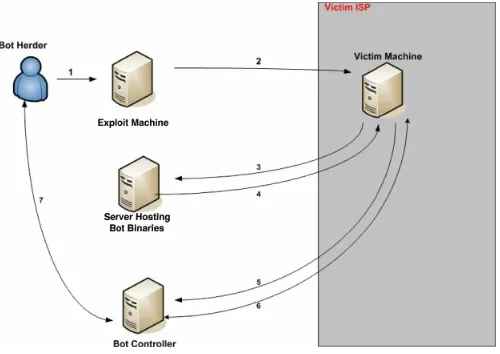
Figure1.1from McAfee [29] illustrates the most common method for the creation and utiliza-tion of bots.
1. Bot herder runs remote exploit scanner.
2. Scanner finds unpatched host which becomes victim.2
3. Victim machine requests bot software from file server (e.g. AgoBot, Sdbot, rxBot).
4. Bot binary is downloaded to victim and executed.
5. Bot reports back to the operator through command and control center (e.g. an Internet Relay Chat (IRC) server).
6. Bot operator sends commands to bot on victim machine.
[image:17.612.76.576.299.653.2]7. Bot operator controls all victim machines through one common interface (e.g. CCI).
Figure 1.1:Botnet Creation and Usage
2The original security hole is usually closed so there will be a lesser chance that the bot will be overtaken/replaced by a different
CHAPTER
2
Intrusion Detection/Prevention Systems
Intrusion detection/prevention systems are used to protect a company’s private network. These sys-tems help to prevent data theft and aid in automating cyber security processes. Intrusiondetection
systems can alert system administrators to unauthorized accesses or other anomalous activities. These devices are usually attached to router/switch monitor ports that mirror inbound (i.e. toward the user’s private network) and/or outbound (i.e. toward the internet) traffic from all ports to one common interface. The major disadvantage to this configuration is that the sum throughput from all connected devices cannot be greater than the maximum throughput of the single monitor port.
Intrusionpreventionsystems are more intelligent than detection-only systems in that they take a more proactive approach to traffic monitoring. Not only will these devices alert on certain events, but they will also prevent the malicious traffic from ever entering the user’s internal network by blocking the packets. In order for the packet blocking mechanism to function properly, these de-vices usually have to be inline with a main network trunk or backbone. The major disadvantage to this configuration is that if the intrusion system fails either physically (i.e. power loss) or logically (i.e. false positives) it could prevent necessary traffic from reaching its intended destination.
2.1
Force10 P-Series Overview
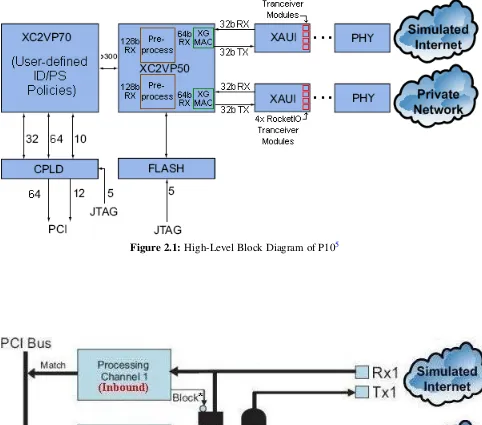
The basic design of the Force10 P-Series (10 Gb/s) (P10)IPSconsists of two Field Programmable Gate Arrays (FPGAs) and a Complex Programmable Logic Device (CPLD) (see Figure2.1). The Xilinx® Virtex™-II Pro 50 (XC2VP50) is the pre-processor to the bi-directional traffic flows while the Xilinx® Virtex™-II Pro 70 (XC2VP70) contains the user-definedIPSSnort policies.1,2
The Internet Protocol version 4 (IPv4) packets enter the first Field Programmable Gate Array (FPGA) from the fiber optics [25] through the Media Dependent Interface (MDI), the 10 Gb/s At-tachment Unit Interface (XAUI) core [12,23], and a 10 Gb/s Media Access Controller (XGMAC) core [24]. While theMDIis external to theFPGAstheXAUIandXGMACcores are instantiated inside theXC2VP50.
1The Snort policies/rules may be updated through any shell console via a pre-provided script.
2The pre-processor firmware for theXC2VP50must be uploaded through a physical Joint Test Action Group (JTAG) port on
EachXAUIoperates at 156.25 MHz and internally generates 64 bits of Single Data Rate (SDR) data per clock cycle while externally forwarding 32 bits of Double Data Rate (DDR) data per clock cycle all resulting in a 10 Gb/s flow. The Xilinx XAUI cores contain 4 RocketIO™ transceiver modules, each with a TX/RX lane running at 3.125 Gb/s. Before the firstFPGAcan pre-process the packets, each RocketIO module fans out the serial data it receives from the fiber optic interface into a parallel structure using a Serializer De-Serializer (SERDES). Once the XAUI internal core receives the incoming traffic from all 4 RocketIO modules, it synchronizes and deskews [23] the incoming parallel data into single 32-bitDDRwords which it sends to theXGMAC. For a visual representation of the 10 Gb/s interface structure refer to AppendixD.
TheXGMACcore contains a 10 Gb/s Media Independent Interface (XGMII) module running
at DDRto create a single 64-bit word from the incoming 32-bit data before forwarding it to the
XGMAC’s internal core. After proper data reconciliation and flow control [24], the XGMAC
ultimately sends the data toF10proprietary logic blocks within theXC2VP50. In addition, prior to sending each 64-bit data word to the secondFPGA, theF10Plogic aligns each ethernet frame chunk on byte zero while shifting in an additional 64 bits of incoming data in order to produce 128-bit words. Doubling the word size (i.e. taking two 64-bit chunks from each RX channel at one time) allows the subsequent FPGA to run at exactly half the original clock speed (i.e. 78.125 MHz). The lower clock frequency reduces power consumption, ringing, jitter, and aids in meeting tighter timing constraints. Therefore, every ethernet frame is broken into 128-bit (16-byte) blocks and compared against the provided Snort signatures (also split into 16-byte blocks) until the entire frame has been parsed.
Once the second FPGA has the two 128-bit words it can compare that data to various user-defined Intrusion Detection/Prevention System (ID/PS) policies. These Snort rules may be either static3or dynamic4and both types of rules are initially passed through aF10Pcustom lex/yacc rule parser prior to uploading in order to ensure their syntactical “correctness”. TheIPv4packets are either discarded or saved for later retrieval at the user’s discretion. Interesting (i.e. user-requested) traffic flows may be off-loaded to the host memory for further inspection. This is accomplished through theCPLDPeripheral Component Interconnect Extended (PCI-X) bus interface and Direct Memory Access (DMA).
Figure 2.2 shows the F10P inspection process at a slightly higher level. Traffic enters the transceivers (right) and the inbound/outbound processing channels determine whether the traffic is allowed to pass.
3Static rule(s) may not be changed while the device is in operation.
4Dynamic rule(s) may be uploaded to theFPGAand be immediately effective in real-time while the device is filtering packets. 5Modified with permission from original image in [18]. TheXAUIcores have been drawn outside of theXC2VP50to increase
readability.
Figure 2.1:High-Level Block Diagram of P105
2.2
Snort (Signatures)
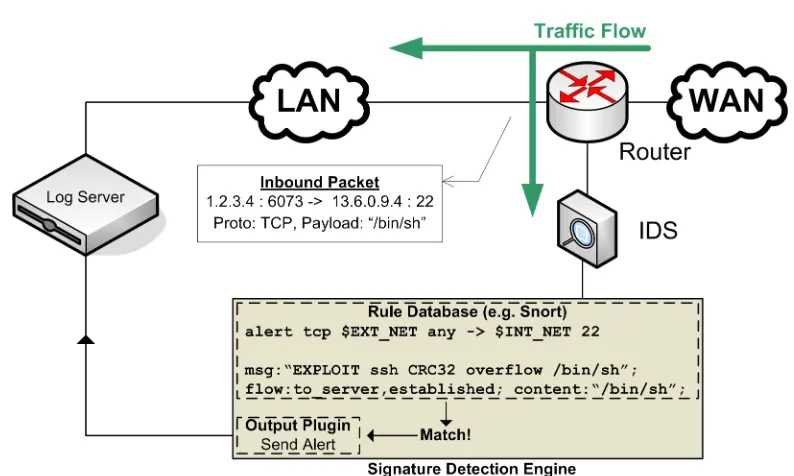
Snort is an open-source, light-weight intrusion detection/prevention application that has two basic operations: rule parsing and signature detection. The Snort rules are loaded into an internal data structure when the Snort engine is loaded. This means that to add/remove any rules one must first stop the Snort agent and reload it so that the new rules file may be parsed. A high-level view of the signature detection process can be found in Figure2.3.
TheF10Phas a distinct advantage here with the ability to dynamically load rules as mentioned in section 2.1. The rules are split into two parts: the ‘header’ and the ‘option’. The header acts as the expression/condition required to match a packet and may be used to specify the protocol, source address, destination address, and port. For example [27], the rule header for the OpenSSH CRC32 remote exploit is:
alert tcp $EXTERNAL_NET any -> $HOME_NET 22
The ‘option’ for that same exploit would contain the signature itself and the rule’s priority:
(msg: ‘‘EXPLOIT ssh CRC32 overflow /bin/sh’’; flow: to_server,established;
content: ‘‘/bin/sh’’; reference: bugtraq, 2347; reference: cve, CVE-2001-0144;
[image:21.612.106.503.374.612.2]classtype: shellcode-detect; sid:1324; rev:3;)
Figure 2.3:Signature Detection Process
2.3
Ourmon (Anomalies)
are Symantec’s Manhunt™ and Lancope’s StealthWatch™. In the open-source arena there are even fewer trusted algorithms, but one that has been proven to work over the last two years is “Ourmon”, which was developed by Prof. Jim Binkley7, et al. [3].
The Ourmon algorithm suggests detecting botnet clients by labeling certain Internet Relay Chat (IRC) channels as “evil channels” if the majority of the hosts within that channel are generating Transmission Control Protocol (TCP) SYN scans.8 The algorithm initially gathers the following three sets of tuples over 30-second periods:
• TCP SYN Scanner Tuple
(IP source address, SYNS, SYNACKS, FINSSENT, FINSBACK, RESETS,
PKTSSENT, PKTSBACK)
• Channel List Tuple
(CHANNAME, HITS, JOINS, PRIVMSGS, NOIPS, IP LIST)
• Node List Tuple
(IPSRC, TOTALMSG, JOINS, PINGS, PONGS, PRIVMSGS, CHANNELS, SERVERHITS, WW)
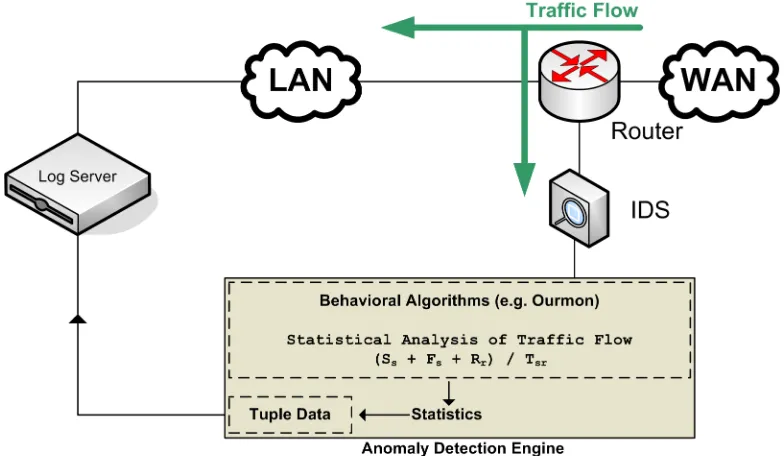
A subset of the full TCP SYN tuple data is taken based on hosts with an abnormally large percentage ofTCPcontrol packets. The following metric, called theTCP“Work-Weight (WW)”, is calculated for each outbound Internet Protocol (IP) source to determine if an anomaly exists:
WW = Ss+Fs+Rs
Tsr
(2.1)
where...
• Ss= SYNs sent9 • Fs = FINs sent • Rs= RSTs received
• Tsr = total TCP packets sent and received
In the worst caseWWis 100% which would indicate a high probability that the host associated with the given IP contains a scanner/worm attempting to propagate itself. On the other hand, because of the manner in which the algorithm is calculated, a reliableWWvalue is affected by the lack of connectivity present in emerging Peer-To-Peer (P2P) bot networks (see [15]). If there are many of these hosts in a singleIRCchannel it likely indicates malicious activity. The remaining items in the SYN tuple list aid in determining what exact exploit is being used.
A high-level view of the anomaly detection process can be found in Figure 2.4. Because this algorithm is based on the characteristics of botnet communication (i.e. an unusually high number ofTCPcontrol packets), it should not only prove useful in detecting bots that attempt to infiltrate computer networks from the outside, but also bots that have infected a user’s machine at home (e.g. via telecommuters) which automatically gain “insider” access.
7Prof. Binkley also co-authored [2]. 8This section is directly adapted from [3]
Figure 2.4:Anomaly Detection Process
2.4
Signatures vs. Anomalies
Signature and anomaly detection methods both have their advantages and disadvantages. When comparing them, however, it becomes quite apparent that the two systems complement each other extremely well.
Signature Advantages:
• Immediate detection is possible.
• User may be very specific with each rule.
• Smaller chance of false positives.
Signature Disadvantages:
• Zero-day attacks cannot be detected (since the signature is yet to be defined).
• Plain text rules files of old and new signatures may total 100 Megabytes (MB) or more in size, and must be maintained in order to be effective.
• Very similar malicious bodies with slightly different signatures may be missed.10
• Encrypted payloads cannot be matched against known signatures.
Anomaly Advantages:
• Zero-day attacks can be detected.
10Many malicious applications, which already have signatures, will randomly modify themselves by only a few bytes in order to
• Similar entities can be detected.
• One algorithm can protect against numerous malicious bodies with minor changes11.
• Encrypted payloads are of no consequence if the algorithm is statistically based on the packet headers.
Anomaly Disadvantages:
• Learning phase (must observe traffic for minimum period of time) results in slower detection.
• User must be slightly more vague in their rule/algorithm.
• False positives are possible.
In order to provide adequate coverage, anomaly-based detection must be run in conjunction with a signature-based mechanism. Therefore, the most obvious approach would be to run both detection schemes simultaneously in hardware on the same device. The implementation of Snort on the F10P does not require any modification, however, it lacks any inherent anomaly-based agents.
CHAPTER
3
Algorithm Implementation
In staying true to the anomaly-based detection paradigm, the author has designed a partial imple-mentation of the full Ourmon algorithm. For this thesis the core WW algorithm (see Equation
2.1) was architected in hardware and not any of the three tuples described in section 2.3. Even without the additional information provided by those three defined sets, this paper will show that a hardware implementation of theWWalgorithm alone has many distinct advantages.
This algorithm was implemented in hardware using the Verilog® Hardware Description Lan-guage (HDL) and is run adjacent to the Snort implementation inside the secondFPGAof theP10.1 By implementing the algorithm in hardware it was able to operate more efficiently by avoiding the inherent disadvantages of a software-based approach while filtering the maximum traffic flow of 10 Gb/s.
3.1
Hardware Design Component
TheAPIprovided by the designers atF10is not an actual “API” as most programmers would think of one. The “API” is only a descriptive listing of theFPGAand Peripheral Component Interconnect (PCI) bus signals located in the top-level design file. Available pre-defined “functions”, more correctly referred to as logic blocks in this case, are limited to thePCIbus arbiter and the packet pre-processor logic signals from theXC2VP50. A description for each of the major signals used in the design may be found in AppendixA.
3.1.1 Packet Data Parsing
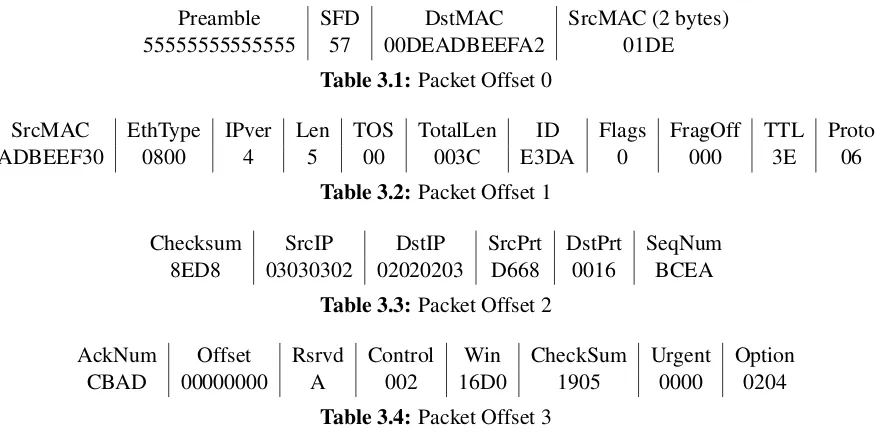
The most important of these signals are the 128-bit packet data signal and the offset signal from the first FPGA. The data signal conveys the actual packet data from the physical fiber run to the Snort and user logic blocks. Each 16-byte chunk is equal to one ‘offset’ signal count. As an example, we have provided a textual rendition of what the first four ‘offsets’ of aTCP/IPSecure Shell (SSH) destined packet would look like when entering theXC2VP702:
Preamble SFD DstMAC SrcMAC (2 bytes) 55555555555555 57 00DEADBEEFA2 01DE
Table 3.1: Packet Offset 0
SrcMAC EthType IPver Len TOS TotalLen ID Flags FragOff TTL Proto
ADBEEF30 0800 4 5 00 003C E3DA 0 000 3E 06
Table 3.2: Packet Offset 1
Checksum SrcIP DstIP SrcPrt DstPrt SeqNum 8ED8 03030302 02020203 D668 0016 BCEA
Table 3.3: Packet Offset 2
AckNum Offset Rsrvd Control Win CheckSum Urgent Option CBAD 00000000 A 002 16D0 1905 0000 0204
Table 3.4: Packet Offset 3
Knowing these boundaries allows us to define the packet sections down to each individual bit. The author has provided these bit definitions in AppendixBin hopes that they might be useful to futureF10P APIusers.
3.1.2 Floating-Point Unit Failure
The initial conceptual design for theWWalgorithm involved storage of the resulting work-weight percentage for each flow. In order for this to work theWWlogic block would require a Floating Point Unit (FPU) to perform the division operation. Xilinx provides customizableFPUand type-casting cores for free with their CORE Generator™ (CoreGen) tool.
For the complete algorithm, the numerator and denominator must first be converted from inte-ger to floating-point, then the division must be performed before the next packet is presented. To ensure that no packets would be missed we first had to determine the worst-case number of clock cycles that would be available for a packet. The following facts were taken into consideration:
• The offset signal increments once per 12.8ns clock cycle.
• The minimum Ethernet header length is 22 bytes (including Start of Frame Delimiter (SFD) and Preamble).3,4
• The minimumIPheader length is 20 bytes.
• The minimumTCPheader length is 20 bytes.
• The TCP packet may have no payload bytes.
This leaves us with a worst-case count of 4 clock cycles in which to perform all of the afore-mentioned operations. In order to accomplish that task theFPU required a latency(i.e. number of clocks that must pass before the operand inputs may change) andcycles per operation(i.e. the number of clocks that are required to produce a result) value of one clock cycle.
Unfortunately, even though the Xilinx CoreGen tool was capable of generating this single-clock
FPU, it was found that the 12.8ns timing constraint for the 78.125 MHz clock could not be met during the Place and Route (PAR) phase.5 For sake of time the author chose not to research other possibleFPUimplementations and abandoned the idea in search of a work-around. It was felt that if the Xilinx PAR process could not meet the timing constraints for a Xilinx-designed FPU that was fast enough to operate at the required clock rate then it was highly unlikely that a third-party
FPUwould route either.
3.1.3 Flow Memory Data Storage
Even without an availableFPUwe will see that the speed-up provided by the hardware implemen-tation has very little dependence on the division operation. The true efficiency increase lies in the packet pre-processing phase of the implementation. This section will show that the host system is only ever required to read a very small quantity of data from the Network Interface Card (NIC) regardless of the total packet size or the amount of traffic flow. Most importantly, the host may perform the read operations at its own leisure without affecting the algorithm calculation.
This is the underlying theory behind the entire design and why a hardware implementation will function at 10 Gb/s and a software implementation will not. The dependency of the NIC on the host system to keep up with the traffic has been reversed. We have “decoupled” the host<–>NIC
interface and made the host system dependent upon theNIC.
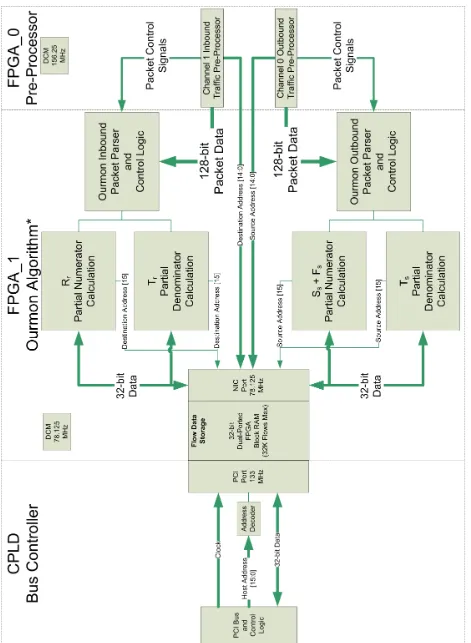
Because the FPUcould not be implemented the design required memory space for four 32-bit values instead of one. These values are listed below and the calculation block for each of them may be found in the diagram in Figure3.1. The partial numerator/denominator values used refer back to the originalWWalgorithm defined in Equation2.1.
• Partial “sent packets” numeratorSs+Fs. • Partial “sent packets” denominatorTs. • Partial “received packets” numeratorRr.
• Partial “received packets” denominatorTr.
Since the maximum possible count for each of these values is only 232 we have to consider if that will be sufficient to provide meaningful data over a reasonable period of time. To do this we calculate the worst-case maximum throughput (T Pmax) of a 10 Gb/s link as follows:
Facts
• Preamble = 7 bytes
• Start of Frame Delimiter (SFD) = 1 bytes
• Minimum Frame Length = 64 bytes
• Minimum Inter-Frame Gap (IFG) = 12 bytes
Calculation
T Pmax = 10 Gb/s
(Preamble+SFD+FrameLen+IFG)
= 14,880,952.38 frames/s
Therefore, if we assume the worst-case that every packet is aWW-countableTCPpacket, then the longest period of time for which any given flow can be tracked (i.e. the Maximum Flow Time) due to the counter size can be defined as:
FTmax = 2
32frames
14,880,952.38 frames/s
≈ 288 sec
≈ 5 min
Whether or not this flow lifetime is acceptable is highly dependent upon the network in which the hardware is deployed. Again, five minutes is quite unrealistic as Sandia typically sees around 3.2 Gb/s on the Wide Area Network (WAN) links and approximately 5-7 Gb/s on local links and, of course, not all of those frames will be countable by the algorithm. A much more likely scenario would be around 15 minutes or more. According to Binkley’s original paper [3] five minutes should be sufficient for generating meaningful data.
After selecting a reasonable data width for the flow memory, the theoretical maximum num-ber of unique flows (T Fmax) that could be stored in theFPGA’s Block Random Access Memory (BRAM)6had to be determined. We calculate this as follows:
Facts
• TheXC2VP70has 328BRAMblocks @ 18 Kb each = 5904 Kb = 738KB
• We must subtract 106 KB required for multipliers and other logic of the nativeP10Snort rule functionality.7
• Sixteen bytes of storage are required per flow.
Calculation - Theoretical
T Fmax = (738 KB−106 KB)∗1024 bytes
16 bytes
= 40,448 flows
6AnFPGA’sBRAMis similar in performance to the Level-2 (L2) cache found in most Central Processing Units (CPUs). 7TheP10would normally consume all of theBRAMspace in theFPGAfor the packet capture buffer but this was deallocated to
Calculation - Actual
The actual maximum number of simultaneous flows (AFmax) is 2nwherenis the number of address bits and 2n≤40,448. Therefore, n=15 and AFmax =215 =32,768 flows. The final flow data memory was implemented in Verilog HDL as shown in the following excerpt from the Xilinx synthesis report:
Synthesizing Unit <mtp_ourmon_flow_mem>.
Related source file is "mtp_ourmon_flow_mem.v".
Found 32768x32-bit dual-port block RAM for signal <mem>.
---| mode | read-first | |
| dual mode | read-first | |
| aspect ratio | 32768-word x 32-bit | | | clock | connected to signal <clk_A> | rise | | dual clock | connected to signal <clk_B> | rise | | write enable | connected to signal <write_A> | high | | dual write enable | connected to signal <write_B> | high | | address | connected to signal <addr_A> | | | dual address | connected to signal <addr_B> | | | data in | connected to signal <data_in_A> | | | dual data in | connected to signal <data_in_B> | | | data out | connected to signal <data_out_A> | | | dual data out | connected to signal <data_out_B> | |
| ram_style | Auto | |
---Summary:
inferred 1 RAM(s).
Unit <mtp_ourmon_flow_mem> synthesized.
The inferred BRAMshown above was instantiated four times, two for the numerator and de-nominator and two for each partial count.
3.1.4 Flow Hashing
Knowledge of the maximum number of flows that may be stored now requires a convenient method of identifying unique flows and generating their respective addresses in memory. This portion of the design is one of the most critical because the hash algorithm used must have a minimal collision8rate and not provide the user with erroneous information or false positives.
There are numerous research papers that identify reliable hashing algorithms for this very pur-pose. Because of the extremely limited number of memory address bits available for each flow, however, all but one was a viable option as a result of the extremely high collision rates they yielded. The large majority of hash algorithms available use the same 4 or 5IPpacket fields:
• Type of Service (ToS)
• SourceIPAddress
• Source Port
• DestinationIPAddress
• Destination Port
A paper written by Zhiruo Cao, et al. [5] suggested the most attractive flow hashing solution, which detailed what they called “XOR Five-Tuple Folding”. This method involves concatenating all of the bits from each of the frame fields listed above and then XOR’ing each bit with its neighbor down to the size of the memory address. For our design this generates the following terms:
• Cr= collision rate
• N= size of each hash table = 128KB
• m= max number of active flows = 32,760
For our memory space this would result in:
Cr = 1−
N(1−(NN−1)m)
m
≈ 1−(128KB)(1−0.779)
32768
≈ 1−0.885
≈ 11.5%
This collision rate is quite appealing and could be considered for use in a production device. However, it was ultimately decided that in order to prove this thesis the design would require a collision rate of zero. No chance of collisions would allow the design to be completely verified by matching packet counts for each flow against the traffic generator statistics.
The easiest and most logical manner in which to accomplish zero percent collision rate is to generate theBRAMmemory address solely from the outbound sourceIPaddress9. If we take the least significant two octets we can use the 15 Least Significant Bits (LSBs) for theBRAMaddress. We then use the Most Significant Bit (MSB), together with the processing channel selection signal, for address decoding and memory block selection.
This still leaves us with collisions for any IP address over X.X.127.255 (i.e. 50% collision rate), which is worse than with Zhiruo’s method. To compensate for this the author has coded the verilog to check and see if the MSB of the last two octets is ‘1’ - if it is, the packet is ignored. This allows the design to operate at full capacity with zero collisions for all 32K flows with the restriction of being able to track only a 15-bit addressable network.
3.1.5 Multiple Clock Domains
Another requirement was that the 78.125 MHz design must be able to communicate with the 133
MHz PCI-Xbus. The host system cannot read/write directly from/to any “ordinary” memory at
the same time as theFPGA, and it especially can’t do so at a different clock rate.
The solution for this dilemma has been around for many years. That solution is dual-ported memory. If we review the inferred memory module report shown in section 3.1.3the reader will see that there are duplicate read, write, data, address and clock ports. One set of ports is for the
FPGAsusage and one set is for the host system. We can see this exact layout in the block diagram
shown in Figure3.1. This allows each side to read/write to the flow memory at any time.
The only real caveat is that if one side reads and one side writes to the same address in the same clock cycle the correct data will be written but incorrect data will be read. If this occurs the correct data will be read on the next read from that location and will likely go unnoticed.
We must also consider the 156.25 MHz clock domain from the pre-processor FPGA. Fortu-nately, this arbitration is already taken care of by the pre-existingF10code.
3.1.6 Algorithm Instantiation
With the algorithm implementation complete, we may instantiate the design in the top-level design file and synthesize it with the rest of the native hardware. This is where the “API” truly comes into play. All of the required port mappings are shown below:
mtp_ourmon my_ourmon (
//Channel 0 and 1 common signals // PHY Interface from first FPGA .pkt_clk_0_1 (PHY_CLK),
// PCI<->Host Interface .pci_init_0_1 (rst),
.pci_clk_0_1 (Gpci_clk),
.pci_addr_0_1 (address_reg[16:0]), .pci_wr_0_1 (wr_reg),
.pci_data_in_0_1 (data_cpld_reg),
//Channel 0 signals
// PHY Interface from first FPGA .pkt_new_0 (reset_cam0), .pkt_data_0 (rx0_data1), .pkt_data_next_0 (rx0_data), .pkt_valid_0 (cam_enable0), .pkt_offset_0 (offset0[10:0]), // PCI<->Host Interface
.pci_prog_0 (programming0), .pci_data_out_0 (data_conf_out0),
//Channel 1 signals
// PCI<->Host Interface
.pci_prog_1 (programming1), .pci_data_out_1 (data_conf_out1)
);
3.2
Software Design Component
With the flow data being stored in the FPGA’s BRAMwe need to determine how to retrieve the data from the NICusing a custom application. F10has provided the required functions that will make this possible.
3.2.1 Retrieving the Work-Weight Data
The first step is to initialize the operating system so that it is aware of theNICand its location in system memory. This is accomplished with the os init()function which generates the Linux file descriptors and defines the Base Address Registers (BARs). TheBARs of allPCIdevices are what make “Plug and Play” possible.
In the past, Industry Standard Architecture (ISA) required users to physically alter jumpers on the card to logically assign it a non-conflicting location in system memory. The BARs perform the same function except they are dynamic registers stored on the card that are written to during system boot.
With the Operating System (OS) initialization complete, we may now utilize the flow memory on theNICusing the providedbar read *andbar write *functions. From theF10P docu-mentation we know that any memory associated with processing channel 0 and processing channel 1 can be accessed at locations 0x100000 and 0x180000, respectively. Combining these ad-dresses with our knowledge of the address decode of the flow memory, we can read the flow data using custom C code as follows10:
for( i = 0; i < FLOW_MAX; i++ ) {
\\Fetch Ss+Fs
bar_read_dword( mtp_num, BRAM_CHAN0 + (i*4), &flow_data[FLOW_TX][FLOW_NUMER][i] );
\\Fetch Ts
bar_read_dword( mtp_num, BRAM_CHAN0 + (FLOW_MAX*4) + (i*4), &flow_data[FLOW_TX][FLOW_DENOM][i] );
\\Fetch Rr
bar_read_dword( mtp_num, BRAM_CHAN1 + (i*4), &flow_data[FLOW_RX][FLOW_NUMER][i] );
\\Fetch Tr
bar_read_dword( mtp_num, BRAM_CHAN1 + (FLOW_MAX*4) + (i*4), &flow_data[FLOW_RX][FLOW_DENOM][i] );
}
Where. . .
• mtp numwill always be ‘0’ for theP10.11
• BRAM CHAN0= 0x100000
• BRAM CHAN1= 0x180000
• FLOW MAX= 32768
• flow datais a reference to a three-dimensional flow data storage array.
3.2.2 Software Flow
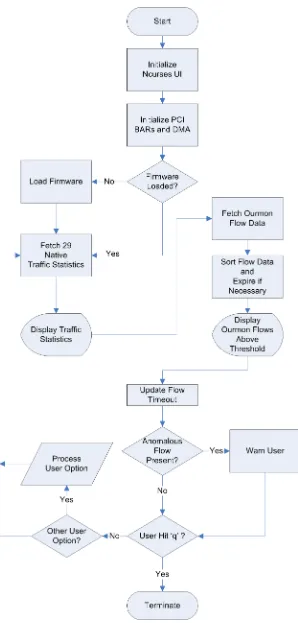
Once the flow data has been collected the only limitations on information processing are those inherent to the programming language and host sytem in use. The most important function in themtp ourmon.c file is theflow sort() function that sorts the retrieved flow data by the maximum WWand expires each flow as its timeout is reached. The entire flow of the software portion of the design can be seen in Figure 3.3. The entire flow is cycled once every second by default.
The “Other User Option?” process reflects any of the other options listed in the Help menu shown here:
• s: Start or restart theF10Pdrivers and reload the firmware.
• m: Manage rules, set capture/forward policies, select firmware.
• i: Number of seconds for the refresh interval.
• n: Set the network base address (for display purposes only).
• e: Erase a single flow.
• E: Erase all flows.
• j: Number of ourmon evil flows to show.
• k: Enter the ourmon flow timeout in minutes.
• w: Threshold percentage for Ourmon work-weight (WW).
• q: Quit the program.
3.2.3 Textual User Interface
The application snapshot shown in the box on page38is aTUIthat relies on the NcursesAPI
for displaying information to the user. TheF10team wrote the entire framework and the majority of the code that was used in this thesis. In other words, the author takes no credit for setting up the TUI except for formatting the display of the Ourmon flow data. The user may notice that the interface looks very similar to the Linux “top” application. In fact, the team atF10directly modified thetopsource code for their own use.
The top half of the TUI is data from the F10P’s 29 native statistics stored in a part of the
XC2VP70that is separate from theWWalgorithm flow data. Descriptions for each of these
statis-tics is not available in theF10documentation, but the author has provided a description of each of these statistics in AppendixCsince it might be useful to futureAPIusers.
The interface shows a variety of traffic flows that were generated with the Adtech AX/4000. The network base address of134.253.X.Xshown in the image only affects the display and does not change the storage of the flow data in any way.
Closer inspection of the screenshot will reveal flows with aWWvalue above the user-defined 40% threshold. This causes the application to alert the user with an “Anomalous flow detected!” message. The threshold is set arbitrarily by the user dependent upon the network traffic and may be changed at any time. Future uses of this feature could cause an alert e-mail to be sent or a log to be recorded.
The most important concept to recognize here is that no longer is the hardware determining the state of the CPU (i.e. with interrupts). Instead, the software is now arbitrarily fetching only the exact data it needs and only when it needs it. The host is no longer being controlled, it is the controller.
The “Exp” column is the flow timeout value. The flow timeout counts down from a user-specified value for each flow. The flow is erased from theFPGA’sBRAMusing thebar write dword
Cpu(s): 34.0% user, 0.2% system, 0.0% nice, 65.9% idle Dev: 0 - Type: MTP-70 - Firmware: 0 - v143 - ffsts ky - irq/s: 0 eth2 UP DMA=on FlowTimeout=16 Pkts/flow=0 Trunc=0 IRQ period=5ms
Hardware Interfaces CH0 Top Pkts/s CH1 Bottom Pkts/s Total Packets 1092334315 0 2474247313 0
TCP Packets 1095068828 0 2474247217 0
UDP Packets 0 0 0 0
ICMP Packets 0 0 0 0
Other Packets 5 0 96 0
Matched Packets 0 0 0 0
Total Flows 0 0 0 0
Delayed Packets 0 0 0 0
Stateful Packets 0 0 0 0
Blocked Packets 0 0 0 0
Alert! Anomolous flow detected!
Top 7 Evil Flows for Network 134.253.X.X Above 40.000% Threshold
Flow# X . X Ss+Fs Ts Rr Tr WW Exp
1 123.015 ..927 ..328 ..930 ..881 87% 473 2 123.004 ..013 ..560 ..464 ..345 74% 2034 3 123.016 ..842 ..280 ..784 ..663 62% 102 4 123.011 ..530 ..602 ..620 ..877 58% 2543 5 123.014 ..380 ..759 ..797 ..260 55% 80 6 123.018 ..134 ..709 ..993 ..082 48% 1085 7 123.009 ..284 ..607 ..524 ..127 41% 1243
CHAPTER
4
Results Analysis
This chapter will describe in some detail the experimental steps that were used in validating the results of this research. The author’s original method of attack in testing the design was to use actual bots in testing. However, for sake of time and safety of Sandia’s production network no real bots were used. It is important to note that the lack of real bots in this analysis in no way affect the validity of the functionality tests. The following items should provide sufficient justification for these deviations from “real” network testing:
• The purpose of this thesis was not to prove that the WWalgorithm itself can detect actual bots. This has already been shown by Binkley, et al. over the last two years. This research was performed to show that an implementation of the algorithm in hardware would be more effective than a software approach when analyzing a 10 Gb/s data stream.
• The native Snort rule matching capability of the F10Phas already been proven in the field and is a production device available to the general public.
• The operation of the hardware implemented code can be validated with packet count match-ing between theF10device and the AX/4000 traffic generator statistics.
Even though a true internet connection would quite likely provide the author’s network with numerous malicious applications, the results and attacks would not be repeatable. This project required a repeatable experiment in order to achieve meaningful outcomes. The AX/4000 traffic generator [6] was used to simulate the WANand fill the inbound and outbound pipes of theP10
to their theoretical maximums.1 This is the only way to statistically prove the effectiveness of a hardware drivenIPSsystem over similar software-only methods.
4.1
Network Setup
As stated in section1.1many software-basedIPSmodels are inefficient since they lack visibility of the network. The vast majority of these applications cannot handle the immense traffic flow found
1It is important to note that, while some legitimate hosts were used in preliminary testing, simulated host IP addresses generated
on large network backbones. TheP10, however, was designed with this very purpose in mind.
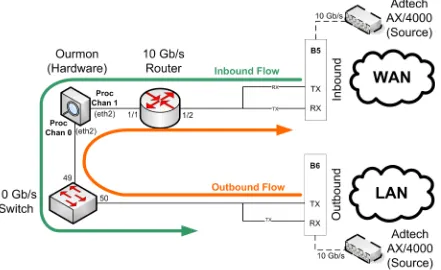
4.1.1 Hardware Implemented Ourmon Testing
For the hardware implementation test theP10was connected to a private network consisting of a core router, a distribution layer switch, secure monitoring devices, simulated hosts, and a simulated
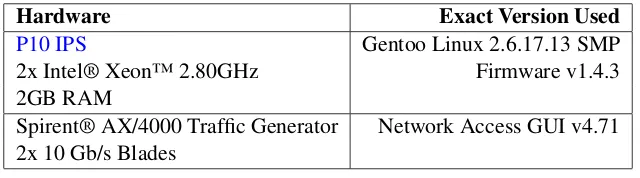
WANconnection. There was no firewall or any other security measures implemented between the internet and the hosts aside from the F10P containing the WW algorithm. Table 4.1 shows the hardware and software resources that were used in implementing the network diagram shown in Figure4.1.
Hardware Exact Version Used
P10 IPS Gentoo Linux 2.6.17.13 SMP
2x Intel® Xeon™ 2.80GHz Firmware v1.4.3 2GB RAM
[image:41.612.147.467.219.308.2]Spirent® AX/4000 Traffic Generator Network Access GUI v4.71 2x 10 Gb/s Blades
Table 4.1:Network Resources (Hardware Test)
The hardware-based test cases were performed in the following order:
1. The P10was enabled as a pass-through device with no Snort rules or WW algorithm acti-vated.
2. The AX/4000 inbound and outbound blade statistics were checked to ensure no packet loss had occurred.
3. The P10 native packet statistics were checked to ensure they matched the packets counts shown on the AX/4000.
4. TheP10hardware-basedWWalgorithm was enabled.
5. The AX/4000 inbound and outbound blade statistics were checked to ensure no packet loss had occurred.
6. The P10 native packet statistics were checked to ensure they matched the packets counts shown on the AX/4000.
7. The hardware-based WW algorithm packet counts were checked to ensure they matched those of the AX/4000.
8. The above steps were repeated at the following traffic throughput intervals: 1 Gb/s, 5 Gb/s, 7 Gb/s, 10 Gb/s.
9. The above steps were repeated again, but with the added challenge of tracking simultaneous
Figure 4.1:Hardware Implemented Ourmon Test Network
4.1.2 Software Implemented Ourmon Testing
For the software-based implementation of the algorithm the author chose the best hardware that was readily available. Table 4.2 shows the hardware and software resources that were used in implementing the network diagram shown in Figure 4.2. Please reference section 4.2 for more information on why no outbound traffic channel is shown in the network and why no test cases are provided.
Hardware Exact Version Used
2x x86 64 AMD Opteron™ 252 2.6GHz Gentoo Linux 2.6.20 SMP
2GB RAM tcpdumpv3.9.5-r3
Myricom 10 Gb/s 8x PCI-E NIC libpcapv0.9.5 Spirent® AX/4000 Traffic Generator Network Access GUI v4.71 2x 10 Gb/s Blades
Table 4.2: Network Resources (Software Test)
4.2
Success Criteria
The success of this thesis was based on the following three criteria2, which were decided upon by the author, the committee members, and Richard Hu atSNL.
[image:42.612.145.469.491.577.2]Figure 4.2:Software Implemented Ourmon Test Network
4.2.1 Criteria 1 - Can the hardware implementation capture and calculate the work-weight algorithm at data rates beyond those possible via a software implementation?
Hardware Test
In testing the implemented hardware design with the experiment setup described in section4.1.1
the author has verified that all packets were captured and that theWWwas successfully calculated for simultaneous traffic flows up to full-duplex 10 Gb/s operation.3 This test
Software Test
Unfortunately, for the software experiment setup described in section4.1.2, the host machine was unable to successfully capture all packets at full 10 Gb/s capacity even with a single inbound-only traffic flow. The test was setup using tcpdump compiled with the libpcap memory-mapped, ring-buffer modification from Phil Wood [35] at Los Alamos National Laboratories (LANL).
In utilizing the host packet buffer modification the author still observed 25%-30% packet loss on average at 10 Gb/s flow using the AX/4000. Clearly, with reasonable hardware, and enhance-ments to thelibpcap library, a software implementation is unable to meet the first half of this criteria let alone calculate an algorithm in real-time. Therefore, we can conclude that a software im-plementation of any algorithm at 10 Gb/s is not only intractable it is also infeasible with presently available hardware.
4.2.2 Criteria 2 - Can the joint operation of the F10P’s inherent signature-based detection scheme with the additional anomaly-based detection identify more malware than the original F10P without the anomaly-based mechanism?
For this test condition the following assumptions were made:
• The ability of the F10P to match signature Snort signatures at 10 Gb/s was not affected by the implementation of theWWalgorithm and has remained intact. This is safe to assume for two reasons: theWWlogic block is physically and logically separate from the factory Snort implementation and all original timing constraints were met for the design.
3The traffic generated for both the hardware and software experiments was worst-case scenario with every packet being a valid
• We may also then assume the converse of the previous item in that the entireWWalgorithm is not affected by theF10Pnative Snort rule matching capability. If there were conflicts the
WWalgorithm would not function properly, which contradicts section4.2.1.
• Disabling of the BRAM packet buffer used for capturing capabilities does not affect the F10P’s capacity to block or allow packets based on the defined rule set. The author has confirmed with the chief architect of the originalP10design, Livio Ricciulli, that this is the case.
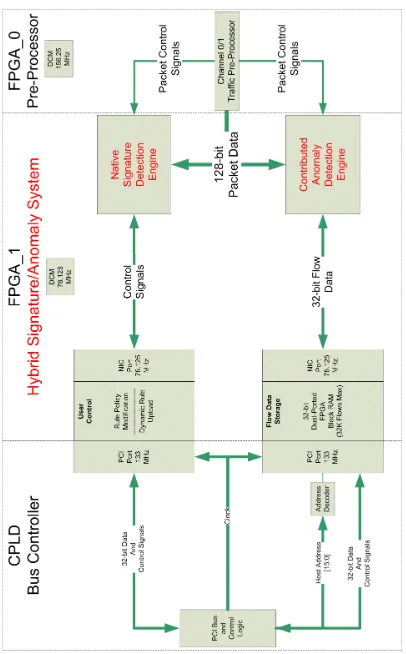
With the items listed above and the success described in section 4.2.1established we can say that the hybrid signature/anomaly implementation successfully functions at a full-duplex 10 Gb/s capacity. Referring back to the general knowledge presented in section2.4 we can conclude that this success criteria has been met.
4.2.3 Criteria 3 - Does a live demonstration of the design match the results portrayed in this document?
The live demonstration of the entire hardware and software design was presented to the committee observer, Larry F. Tolendino, on July 6, 2007 on-site atSNL. A live demonstration of the device to all committee members during the thesis defense was not possible as the device in question could not be removed from the labs for reasons of national security.
CHAPTER
5
Practical Applications
The hybrid anomaly/signatureIPSdesign presented in this paper not only has the numerous advan-tages as described in the previous chapters, but also has many practical applications for production networks. This section will discuss possible security implementations for the device as it directly relates to theSNLnetworks.
5.1
Security and Visibility
Over the next few years Sandia intends to incrementally upgrade its Energy Sciences Network
(ESnet)WANconnection and backbone from its current 100Mbps link to 10 Gb/s. This bandwidth
increase will improve support for PetaScale computation. Figure 5.1shows a high-level diagram of what the SandiaSNL/New Mexico (NM) network might look like by the year 2010. The image was originally provided by the committee observer, Lawrence F. Tolendino, and then modified by the author to include the Force10 P-Series.
A 10 Gb/s connection introduces many questions, including:
1. How do we monitor 10 Gb/s traffic?
2. How do we secure a 10 Gb/s link from malicious activity?
5.2
Limitations
Even though the implementation described in section5.1may look appealing, care should be taken in understanding the limitations of the device prior to permanent deployment. We describe some of these limitations below:
• Less than adequate documentation with multiple syntactical errors. The author has corrected some errors in the documentation and has been informed that the changes will be imple-mented byF10in future revisions.
• Limited technical support for theAPI. The only person available to help the author with the
APIduring his research was the chief architect. Some questions would require weeks for any response. Additionally, theAPIexamples will not compile properly without code fixes that were made by the author.
• The F10P is an “active” device, not “passive”, meaning that if power fails to the box all traffic will be blocked. In order for the device to be fully effective is must be configured in the network as an inline module. If the user does not wish to use the full security capabilities of the device it is possible to install the device on a mirror/Switched Port Analyzer (SPAN) port.
• The number of usable Snort rules in theF10Pis directly proportional to the size of theFPGA. Fortunately, asFPGAsreduce in price the hardware may be upgraded in future revisions. We are essentially sacrificing speed for rule capacity.1
• TheF10Pdoes support every type of Snort rule construct available. TheF10documentation [19] specifically states which options are available. The F10Pcustom lex/yacc rule parser mentioned in section2.1will also inform the user of invalid rule types.
• The author has found that the 10 Gb/s packet dump capability of theP10 to the hostOSis limited and does not always present all packets or present the packets in the correct sequence.
F10has knowledge of this issue, but it is unknown if they intend to release a fix.
• At the time of this writing, no Internet Protocol version 6 (IPv6) support is available for 10 Gb/s model of theF10P.
1As an example,SNLmaintains databases that total several thousand rules while theP10can store only 650 static rules and 10
CHAPTER
6
Conclusions
Botnets are an extremly effective means of gaining unauthorized access into protected systems. Unlike viruses, botnets can easily circumvent signature detection schemes. Only when we join signature detection and behavioral analysis can we defend against this malware.
In this paper we have presented a hybrid method of performing both anomaly and signature detection in one network security device. Not only can this model out-perform all software-based implementations to date, it can also run at 10 Gb/s line rate. This design can increase productivity and prevent data theft by combining two field proven network security paradigms.
The future of theF10P APIis uncertain and the documentation and examples still require more work. Aside from the steep learning curve, the 10 Gb/s capability is available and waiting for novel architectural uses. It is hoped that this paper will help other owners of theF10Pin developing their own algorithms and possibly sharing them with the rest of the world.
CHAPTER
7
Future Work
There is room for improvement in every design and the design presented in this paper is no ex-ception. Even though this proof-of-concept architecture has worked very well it leaves much to be desired.
Software Updates
One of the major limitations of the hardware implementation is the small 32-bit packet count space for flow data. This limitation could very easily be overcome with a bit of work to theTUI appli-cation discussed in section 3.2. The program could be modified to store flow history data in the systems main memory and account for past packet counts when calculating the WWpercentage. This would effectively result in limitless packet count availability which would consequently in-crease the flow expiration time to infinity.
IPv6 Efforts
Many corporate networks and the United States (U.S.) government are making the move to Internet Protocol version 6 (IPv6) (includingSNL). Therefore, havingIPv6security capabilities at 10 Gb/s rates will be a necessity. F10 currently has Snort rule support for the Force10 P-Series (1 Gb/s) (P1) only, not theP10, however, support is expected to arrive in the near future. TheWWalgorithm could adapt to the massive 128-bit IPv6 address space with an adequate flow hashing algorithm.
Proactive Network Management
Not only could this box be used on a production network, but it could also be used to proactively monitor the types of malware that are attempting to infiltrate a network using what are called “Honeynets”. Deploying this design in a non-critical system removes the inherent danger that lost power to the device might compromise the production network backbone because of the active
Network Device Integration
WhenF10purchased the MetaNetworks company their original idea was to incorporate the 10 Gb/s Snort rule matching capability into their router Application Specific Integrated Circuits (ASICs). However,SNLhas yet to see this availability in any of theF10equipment. Integration of theTUI
into their routers would increase the accessibility and usability of the security features since they could be easily managed directly through the router’s Command Line Interface (CLI).
Algorithm Enhancements
As previously mentioned in section2.4, the unique advantage of anomaly-based detection is that slight modifications to an algorithm may detect more/newer malware. This is unlike the Snort rules where new signatures that occupy much of theFPGAslogic capacity. For example, the hardware implementation of theWWalgorithm could be easily modified with one or more of the following elements1:
• Surround the logic with various “if/then/else” decision rules to improve and/or alter how it works. For example, we could check to see if theIPsource address is only sending packets and never receives any packets back.
• Consider how the algorithm functions over multiple samples (e.g. P2Pusing systems have high work weights at times but the work weight can be lowered with a weighted history function like theTCPRound Trip Time (RTT) algorithm.
• Disregard all received TCP packets to a source node and divide by either the total TCP
packets or just the packets received.
• Store flow data based on individual networks instead of individual IPs. This would consume lessBRAMand possibly allow for storage of a flow timeout value.
• Allow user to specify theWWthreshold in a hardware register and then block any packets2 that match to that “evil” flow. With upgraded FPGAsand anFPUthis enhancement would be possible.
Storage Capacity Upgrades
As mentioned in section5.2, the Snort rule andWWflow data storage size is directly proportional to the size of theFPGA. As FPGAsbecome cheaper and larger, we could increase the number of simultaneous flows to a full 216 class B address space, improve the packet capture buffer, store more Snort rules, and so on.
With newer FPGAs also comes enhanced performance. A faster FPGA (e.g. the Virtex-4) would quite likley have amplePARarea to allow for implementation of theFPU. AnFPUwould provide the capability of storing only one single 4-byte word for every flow rather than 16 bytes.
F10has mentioned that they are working on new hardware for their next version of theP10.
APPENDIX
A
API Signal Descriptions
TheF10P API is logically split into two different interfaces - theDatainterface and the Control
interface. Some of the major signals used in the algorithm implementation are described below.1 The reader should use this information at their own risk.
A.1
Data Interface
The programmer can utilize the Data interface signals to process incoming packets at wire speed and direct the capture and forwarding policies. The Dynamic Parallel Inspection (DPI) core offers the captured packets to the host through a PCI-X master DMA implementation that can yield throughputs of up to 1 Gb/s for large packets and 1.1 Mbps for small packets.
A.1.1 Input Signals
• pkt new - goes high to indicate a new packet is being received. The signal is a pulse indicating the start of a packet.
• pkt clk - this is theXC2VP70 78.125 MHz clock generated from theXC2VP50 156.25 MHz clock
• pkt valid - (active high) - asserts that pkt data is valid. When the signal is logic low the computation on the packet must assume that the values in the “pkt data” signal are not valid. This signal can be de-asserted at any time during packet reception. This signal rarely goes low and for most intents and purposes the architect should never have to worry about it going low. The only time it is sure to be low is between packets and for any packets that contain Uniform Resource Identifier (URI) content (e.g. Hyper Text Transfer Protocol (HTTP) packets that have % signs).
1This section was adapted from the limited descriptions provided in theF10documentation. Most of these signals have been
• pkt data - 128-bit (16-bit for P1) - represents packet data @ “pkt offset”. The data is arranged with the most-significant byte representing the first byte received. When destined to port 80 theURIdata is normalized to remove encodings. TheP10uses a 128-bit bus rather than 16-bit in order to be functional at 10 Gb/s.
• pkt data next- 128-bit (16-bit for P1) - represents packet data @ “pkt offset+1”. Allows for a single clock “look ahead” if packet data is needed earlier or more operational clocks are needed between frames.
• pkt offset - 11-bit - represents which segment (i.e. word) of current packet is being clocked in. This signal changes once per “pkt clk” cycle. Note that the word size of the
P10is 128 bits. The entire Ethernet frame is presented including the 7-byte preamble (i.e. 0x55555555555555) and a 1-byte “Start of Frame” delimiter (i.e. 0x57). The last two bits of the SFD are both ’1’s in order for the Media Access Controller (MAC) to know where the actual packet data is going to begin. For theP10, this means that the first Ethernet destination address byte is the 9th byte at pkt offset 0. Remember, when data is sent across a network it is sent in the following order: raw data from the application, segment, packet, frame, and finally, the bits on the wire. The pkt offset value can range from 0 to 2047. Since each pkt offset is 16 bytes in size this allows for a maximum ethernet frame size of 32768 bytes. The actual theoretical maximum for an ethernet frame is 65536 bytes, but a frame greater than 32768 bytes is so unlikely that it’s not even considered. The reader may refer to section
3.1for an example of the packet offsets.
• inpacketoff- 8-bit - represents byte offset from first payload byte. It can be used in con-junction with the “pkt offset” signal to determine when the packet header has been processed by the system. At reset (before and during header processing) this signal has a value of 0x1A. Note that this is a constant value and does not change over time once its value has been de-termined (it says at what point the payload data starts). This is unlike the “pkt offset” signal which changes as the packet is being processed. For instance, assume an Ethernet frame with a 7-byte preamble, 1-byte Start of Frame Delimiter (SFD), 6-byte destinationMAC, 6-byte sourceMAC, and a 2-byte EtherType value (for a total of a 22 byte frame header) is entering theP10. Once the frame header has been processed, the inpacketoff signal value will change from 0x1A to 0x16 (or 22 - remember count starts from byte number 0) since the offset of the first payload byte is the 23rd byte. The value will remain 0x16 until the next ethernet frame, at which point the value will temporarily return to 0x1A until the next ethernet frame header has been parsed.
• dsize- 12-bit - represents size (in bytes) of payload. This signal becomes valid after the header is processed. At reset (before and during header processing) this signal is 0xFFFF. This signal has the potential of being