Volume 2010, Article ID 750978,12pages doi:10.1155/2010/750978
Research Article
Rapid Increase in Ownership and Use of Long-Lasting
Insecticidal Nets and Decrease in Prevalence of Malaria in
Three Regional States of Ethiopia (2006-2007)
Estifanos Biru Shargie,
1, 2Jeremiah Ngondi,
3, 4Patricia M. Graves,
3Asefaw Getachew,
5Jimee Hwang,
6, 7Teshome Gebre,
1Aryc W. Mosher,
3Pietro Ceccato,
8Tekola Endeshaw,
1Daddi Jima,
9Zerihun Tadesse,
1, 9Eskindir Tenaw,
10Richard Reithinger,
11Paul M. Emerson,
3Frank O. Richards Jr.,
3and Tedros Adhanom Ghebreyesus
91The Carter Center, P. O. Box 13373, Woreda 17, Kebele 19, Addis Ababa, Ethiopia
2Strategic Information Team, The Global Fund to Fight AIDS, Tuberculosis and Malaria, Chemin de Blandonnet 8,
Geneva 1214 Vernier, Switzerland
3The Carter Center, 1 Copenhill, Atlanta, GA 30307, USA
4Department of Public Health and Primary Care, Institute of Public Health, University of Cambridge, Robinson Way,
Cambridge CB20SR, UK
5Malaria Control and Evaluation Partnership in Africa (MACEPA), a Programme at PATH, Bole Road, Addis Ababa, Ethiopia
6Centers for Disease Control and Prevention, Atlanta, GA 30333, USA
7Global Health Group, UCSF Global Health Sciences, San Francisco, CA 94143-0443, USA
8International Research Institute for Climate and Society, Columbia University, New York, NY 10016-4309, USA
9Ministry of Health, P. O. Box 1234, Addis Ababa, Ethiopia
10Central Statistical Agency, P. O. Box 1143, Addis Ababa, Ethiopia
11U.S. Agency for International Development, Riverside Building P. O. Box 1014, Addis Ababa, Ethiopia
Correspondence should be addressed to Estifanos Biru Shargie,estifanos [email protected]
Received 21 March 2010; Accepted 19 July 2010
Academic Editor: Hans-Peter Beck
Copyright © 2010 Estifanos Biru Shargie et al. This is an open access article distributed under the Creative Commons Attribution License, which permits unrestricted use, distribution, and reproduction in any medium, provided the original work is properly cited.
Following recent large scale-up of malaria control interventions in Ethiopia, this study aimed to compare ownership and use of long-lasting insecticidal nets (LLIN), and the change in malaria prevalence using two population-based household surveys in three regions of the country. Each survey used multistage cluster random sampling with 25 households per cluster. Household net ownership tripled from 19.6% in 2006 to 68.4% in 2007, with mean LLIN per household increasing from 0.3 to 1.2. Net use overall more than doubled from 15.3% to 34.5%, but in households owning LLIN, use declined from 71.7% to 48.3%. Parasitemia declined from 4.1% to 0.4%. Large scale-up of net ownership over a short period of time was possible. However, a large increase in net ownership was not necessarily mirrored directly by increased net use. Better targeting of nets to malaria-risk areas and sustained behavioural change communication are needed to increase and maintain net use.
1. Introduction
Selective vector control with insecticide treated mosquito nets (ITNs) and indoor residual household spraying (IRS) continues to play a key role in malaria control. As a way to achieving the United Nations Millennium Devel-opment Goals (MDGs), the World Health Organization
The three primary interventions (LLIN, IRS and early diagnosis and treatment) form the core approach to malaria control in Ethiopia, where malaria transmission is unstable and seasonal, characterized by frequent and widespread focal epidemics. Malaria transmission mainly occurs in areas below 2,000 meters above sea level, which account for 75% of the country’s total landmass and in which approximately two-thirds of the population reside. Recognizing the low coverage and use of ITNs in the country, the Government of Ethiopia developed the National ITN Strategy in 2004 [3]. One year later, the Ethiopian Federal Ministry of Health (FMOH) set an ambitious national goal of full population coverage in malarious areas with a mean of two LLINs per household through distribution of about 20 million LLINs by the end of 2007. In addition, IRS as vector control tool was also to be scaled-up, particularly in epidemic-prone districts throughout the country. This effort also included the rapid scale-up of provision of rapid diagnostic tests (RDTs) and antimalarial drugs (artemisinin-based combination therapy [ACT]) to newly established community health posts. These health posts are staffed by community-based health exten-sion workers (HEWs), a cadre of salaried civil service staff recruited from the posts’ respective communities and given an intensive one-year long post secondary school training in the provision of health promotion and prevention-oriented interventions, including malaria control [4,5]. The major partners in the ITN scale-up since 2005 in Ethiopia included the Global Fund to Fight AIDS, Tuberculosis and Malaria, UNICEF, World Bank, The Carter Center, and other donors.
To contribute to the rapid scale-up of malaria con-trol interventions in Ethiopia, The Carter Center assisted in procurement and distribution of 3 million LLINs in selected areas of three regions of Ethiopia: Amhara, Oromia and Southern Nations, Nationalities and Peoples (SNNP) Regional States where there are also ongoing Carter Center-supported onchocerciasis and trachoma control programs. The distribution of these nets was carried out by FMOH and local administrative staff, with the assistance of local trachoma and onchocerciasis workers. In general, net dis-tribution activities were carried out in the months pre-ceding major transmission seasons, with earlier waves of distribution targeting the most at risk areas and the later waves targeting less at risk areas. Baseline and followup surveys were conducted in the malarious areas of the three regional states, so changes in coverage of key malaria control interventions could be measured, particularly with regards to household net ownership and use, coverage with IRS and malaria parasite prevalence. The follow-up survey was part of the national Malaria Indicator Survey in 2007 (“MIS 2007”). We also sought to compare the results on net ownership and use in these two surveys with those of the Ethiopia Demographic and Health Survey (DHS) 2005 [6].
2. Methods
2.1. The Study Setting and Surveys. This study was conducted
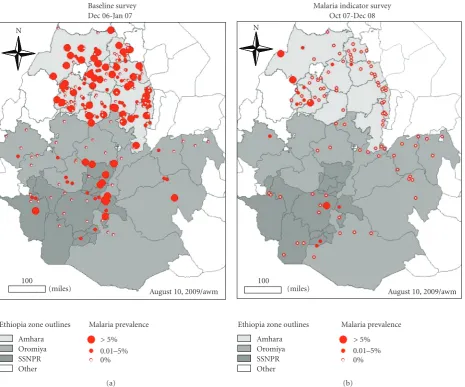
in the Amhara, Oromia and SNNP Regional States of Ethiopia (Figure 1, Map).
The baseline survey was conducted between 12 Decem-ber 2006 and 2 February 2007 (“baseline 2006”). Amhara was done first between 12 Dec 2006 and 13 Jan 2007, while Oromia and SNNPR were done simultaneously between 10 Jan and 2 Feb 2007. The sample size estimation and sample selection process for the baseline survey have been described in detail previously [7,8]. Clusters were defined as kebeles (the country’s smallest administrative unit with an average population of 5,000). The sampling frame was a list of clusters (kebeles) that were defined by the Regional Health Bureaus as malarious. This definition of “malarious” is an expert knowledge classification based on history of malaria, rainfall, altitude, proximity to water and other factors. It represented at that time the malaria program target areas for net distribution and other control activities. Briefly, a multistage cluster random sampling design was used to select 224 clusters, and 25 households in each cluster were selected by the random walk method for inclusion in baseline 2006. All consenting residents (all age groups and gen-der) of even-numbered households were tested for malaria parasites.
The MIS 2007 follow-up survey was conducted from 16 October 2007 to 3 January 2008 and has been described elsewhere [9,10]. MIS 2007 was conducted according to Roll Back Malaria (RBM) Monitoring and Evaluation Reference Group (MERG) guidelines. Clusters were defined as census enumeration areas (EA) with each cluster comprising an estimated population of 200 households. The MIS 2007 sampling frame was a complete list of national population census 2007 EAs. In brief, a two stage cluster random sampling design was used to select a nationally representative sample stratified by three domains: areas below 1500 m, rural areas between 1500 m and 2500 m, and urban areas between 1500 m and 2500 m. In Amhara and Oromia, clusters were oversampled to generate samples for estimating malaria indicators at regional state level thus allowing for detection of changes in malaria indicators between the baseline 2006 and MIS 2007 surveys. In each selected cluster, all households were listed and mapped using personal digital assistants (PDAs) with global positioning system (GPS) capability, and a simple random sample of 25 households were randomly selected by the PDA for inclusion in MIS 2007. Malaria parasite testing was conducted in all children under five years of age in every household and persons of all ages in eight randomly selected households per cluster.
We selected part of the total MIS 2007 sample for compa-rability between surveys. In the baseline survey, the sampling frame was only clusters in areas defined as malarious by the Regional Health Bureaus, whereas in sampling for the MIS 2007, no attention was paid to whether clusters were in such areas. Therefore, for appropriate comparison of baseline 2006 and MIS 2007 surveys, only MIS 2007 clusters in Amhara, Oromia and SNNP that were comparable to the baseline survey (i.e., were located in kebeles listed by the Regional Health Bureaus as being in malarious areas by the expert knowledge classification) were included in the analysis.
Baseline survey Dec 06-Jan 07 N
100
(miles) August 10, 2009/awm
Ethiopia zone outlines Amhara Oromiya SSNPR Other
Malaria prevalence
>5%
0.01–5% 0%
(a)
Malaria indicator survey Oct 07-Dec 08 N
100
(miles) August 10, 2009/awm
Ethiopia zone outlines Amhara Oromiya SSNPR Other
Malaria prevalence
>5%
0.01–5% 0%
[image:3.600.68.534.72.459.2](b)
Figure 1: Map of Amhara, Oromia, and SNNP Regional States showing the baseline-2006 and MIS-2007 (subsample) survey clusters.
from DHS 2005 [6]. The DHS sampled both malarious and nonmalarious areas.
2.2. Household Questionnaire. The baseline 2006 and MIS
2007 survey questionnaires were both based on the RBM-MERG MIS Household Questionnaire, modified for the local conditions and to include relevant socioeconomic risk factors [11]. The questionnaires were translated into the Amharic language and field-tested in a nonsurvey cluster to determine the validity of the precoded answers. At baseline 2006, a paper-based questionnaire was used while for the MIS 2007, the survey was conducted using PDAs. Interviews were conducted with the head of household, or another adult if the head of household was absent or unable to respond for any reason. English versions of the two questionnaires are attached as additional files.
In the household questionnaire, respondents were asked about: ownership of durable assets; room construction materials; IRS; presence and type of mosquito net (verified by observation); demographic information on residents; their net use of the previous night.
2.3. Malaria Parasite Testing. Participants eligible for malaria
testing had a rapid diagnostic test taken, which gave an on-the-spot diagnosis, and provided thick and thin blood films for microscopy. The RDT used was ParaScreen (Zephyr Biomedical Systems, www.tulipgroup.com), which is able to detect both P. falciparum and other plasmodia species (in Ethiopia most likely P. vivax). Participants with pos-itive rapid test results were offered treatment according to national guidelines, that is, artemether lumefantrine (CoArtem, Novartis) for P. falciparum infection, chloroquine for other Plasmodium infection, and referral for clinic-based quinine therapy for self-reported pregnant women [12].
mixed infection. One hundred high power fields of the thick film were examined before calling a slide negative. If positive, the thin film was read to determine the species; parasite density was not quantified. To ensure accuracy, all positive slides and a random sample of 5% of the negative slides were reexamined by a second microscopist, who was blinded to the diagnosis of the first slide-reader and the RDT results. The second slide from each participant was used if the first was broken or unreadable.
2.4. Climate Data. In order to investigate whether observed
differences in the two surveys were related to climate variation over time, we obtained data of three types from sources at the International Research Institute for Climate and Society.
(1) Annual summary rainfall, summarized by calendar year and averaged over Ethiopia from the Climate Prediction Center Merged Analysis of Precipitation (CMAP) version 2, 12-Month Weighted Anomaly Standardized Precipitation (WASP) index [14]. (2) Rainfall estimates derived from TRMM sensor
(orig-inal spatial resolution of 0.25 degrees, resampled to 0.1 degrees and 8 days temporal resolution) from Jan 2004 to present, average over Regional State boundaries [15].
(3) Land surface temperature acquired during the night from AQUA-MODIS sensor at 1km spatial resolu-tion and 8-day temporal resoluresolu-tion since Jan 2004 to present. Comparison of air temperature over Ethiopia, Eritrea, Botswana and Madagascar [16] has shown that land surface temperature is well correlated with air temperature. These data were averaged over the Regional State boundaries; when cloud covered large parts of the regional state at lower altitudes rendering the average result invalid (such as in July 2007 in west Amhara) the result was coded to missing.
Results for (2) and (3) were averaged over the time periods of the baseline 2006 and MIS 2007 surveys in each Regional State, respectively.
2.5. Data Analysis. Statistical analysis was conducted using
Stata 9.2 (Stata Corporation, College Station, Texas, USA). Descriptive statistics were used to explore the characteristics of the sample. Sampling probabilities were calculated based on the sampling designs for each survey and sampling weights derived as the inverse of the product of sampling probabilities. Point estimates and confidence intervals were derived using the SURVEY (SVY) routine in Stata which controls for clustering and allowed for adjustments for the sampling design as well as weighting for sampling probability. A household wealth index was derived from relevant household characteristics using principal compo-nents analysis as previously described [17]. Although the household assets documented were more extensive in the MIS 2007 than in baseline 2006, the SES index reported here for MIS 2007 used only the same set of asset indicators
as were in the baseline 2006 survey. Malaria prevalence estimates were adjusted for age to account for the differences in sampling participants for malaria testing between the baseline 2006 and MIS 2007 surveys.
2.6. Ethical Considerations. The protocols received ethical
clearance from the Emory University Institutional Review Board (IRB no. 1816 and 6389), the Centers for Disease Control and Prevention ethical review committee (IRB no. 990132) and the Ethiopian Science and Technology Agency. Verbal informed consent to participate in interviews was sought from the heads of the household, each individual and the parents of children aged 10 years and younger in accordance with the tenets of the declaration of Helsinki. Signed (baseline 2006) or verbal (MIS 2007) informed consent was sought from each eligible individual and parents of children aged 6 years and younger for blood films. Additional verbal informed assent was sought from children aged 6−18 years.
3. Results
3.1. Characteristics of Study Households and Participants.
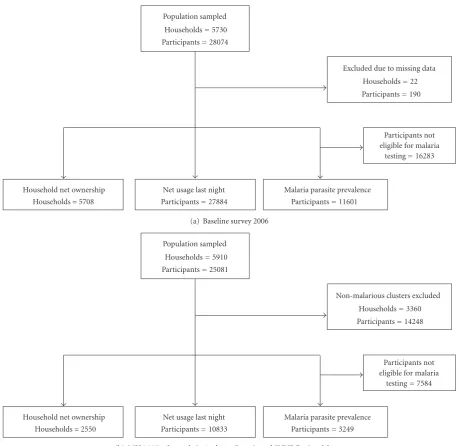
Figures2(a)and2(b)show the details of sample populations included in the two surveys. A total of 5,708 households were included in the baseline 2006 survey and 2,550 households in the follow-up MIS 2007 subsample (malarious areas of Amhara, Oromia, and SNNPR). As shown in Table 1, the overall mean household size in the baseline survey was 4.9 (95% CI 4.8−5.0) whereas that in the follow-up survey was 4.4 (95% CI 4.2−5.0). The mean number of sleeping rooms was 1.2 in the baseline survey and 1.0 in the MIS survey. The number of sleeping spaces was not assessed in the baseline survey; there were an average of 1.8 sleeping spaces per household in the MIS 2007.
A total of 27,884 and 10,883 people were included in the baseline and MIS surveys, respectively, of which 15.7% and 16.9% were children under five years of age. Peripheral blood testing for malaria was done for a total of 11,601 (46.1% males and 16.9% under-five children) and 3,249 (51.2% males and 46.3% under-five children) individuals during baseline and MIS surveys, respectively.
3.2. Indoor Residual Spraying. Overall, 15.5% (95% CI
11.2%−20.9%) and 16.9% (95% CI 10.3%−26.5%) of the households were sprayed within the 12 months prior to baseline 2006 and MIS 2007, respectively. There was no statistically significant difference in the coverage of IRS in the last 12 months between the three regional states as well as between the two surveys.
3.3. Household Net Ownership. As shown inFigure 3(a), the proportion of households in the malarious areas of the three regional states owning at least one mosquito net (any type) significantly increased from 4.5% (95% CI 4.1%−4.9%) in 2005 to 37.0% (95% CI 31.1%−43.3%) at the end of 2006 and to 72.5% (95% CI 64.0%−79.7%) at the end of 2007.
Population sampled Households=5730 Participants=28074
Excluded due to missing data Households=22 Participants=190
Participants not eligible for malaria
testing=16283
Household net ownership Households=5708
Net usage last night Participants=27884
Malaria parasite prevalence Participants=11601
(a) Baseline survey 2006
Population sampled Households=5910 Participants=25081
Non-malarious clusters excluded Households=3360 Participants=14248
Participants not eligible for malaria
testing=7584
Household net ownership Households=2550
Net usage last night Participants=10833
Malaria parasite prevalence Participants=3249
[image:5.600.70.529.69.515.2](b) MIS 2007 subsample in Amhara, Oromia and SNNP Regional States
Figure 2: The sample population by survey.
one insecticidal net (i.e., ITN or LLIN), which significantly increased from 2.9% (95% CI 2.6%−3.2%) in 2005 to 19.6% (95% CI 15.5%−24.5%) in 2006 and to 68.4% (95% CI 58.7%−76.6%) in 2007. The mean number of insecticidal nets per household increased from nearly zero in 2005 to 0.3 (95% CI 0.2%−0.4%) in 2006 and to 1.2 (95% CI 0.9%−1.5%) in 2007 (Figure 4). These increases over time in net coverage, that is, from DHS to baseline 2006 and from baseline 2006 to MIS 2007, were all statistically significant. Of the three regional states, Amhara exhibited the highest household ownership of LLIN at the end of 2007, followed by SNNPR and Oromia.
3.4. Net Use by Participants. Table 2shows that the
propor-tion of persons who reported sleeping under a mosquito
net (any type) the previous night significantly increased from 1.5% (95% CI 1.4%−1.6%) in 2005 to 27.8% (95% CI 23.5%−32.7%) in 2006 and 36.7% (95% CI 30.2%−43.7%) in 2007. In the respective years, net use went up from 2.0% (95% CI 1.7%−2.3%) to 31.8% (95% CI 26.8%−37.4%) and to 42.5% (95% CI 34.0%−51.6%) among children under five years, and from 1.3% (95% CI 0.7%−2.2%) to 35.9% (95% CI 28.8%−43.7%) and then to 41.0% (95% CI 30.5%−52.4%) among pregnant women.
0 20 40 60 80 100
HH
w
ith
>
=
1a
n
y
n
et(
%
)
Amhara Oromia SNNP Total
DHS 2005 Baseline 2006 MIS 2007
(a) Proportion of households owning one or more nets (any type). Note: “Total” refers to the weighted average percentage for the three regional states
0 20 40 60 80 100
HH
w
ith
>
=
1
LLIN
(%)
Amhara Oromia SNNP Total
DHS 2005 Baseline 2006 MIS 2007
[image:6.600.318.525.75.222.2](b) Proportion of households owning one or more long lasting insecticidal nets. Note: in DHS 2005 the proportions are for ITN, not LLIN, as it did not make this distinction “Total” refers to the weighted average percentage for the three regional states
[image:6.600.53.550.328.726.2]Figure 3: Proportion of households owning one or more nets.
Table 1: Characteristics of study households and participants in malarious areas of three regional states.
Regional states Baseline 2006 MIS 2007 subsample
Amhara Oromia SNNP Total Amhara Oromia SNNP Total
Number of clusters sampled 160 32 32 244 65 26 14 105
Household characteristics
Number of households 4,101 809 798 5,708 1,553 651 346 2,550
Proportion sprayed with insecticide in the last year (%) 14.8 18.6 18.3 15.5 25.2 11.0 12.0 16.9
Mean household size (people) 4.7 5.4 5.6 4.9 4.3 5.0 4.4 4.6
Household wealth index (quintiles)
Poorest (%) 19.4 16.8 9.1 18.4 19.2 20.3 13.7 18.3
Second (%) 20.4 29.7 14.3 21.1 19.1 22.4 20.2 20.5
Third (%) 19.3 20.6 30.0 20.2 20.3 20.5 18.6 20.0
Fourth (%) 21.2 20.4 21.3 21.1 21.9 19.1 36.2 24.4
Richest (%) 19.7 12.5 25.3 19.2 19.5 17.8 11.4 16.8
All survey participants characteristics
Number of all participants 19,059 4,428 4,397 27,884 6,551 2,798 1,484 10,833
Proportion of males (%) 48.7 49.3 50.1 49.0 50.8 49.7 48.1 49.8
Age structure
<5 yrs (%) 15.4 18.7 14.3 15.7 15.3 18.9 16.2 16.9
5−14 yrs (%) 30.2 32.1 34.6 31.2 28.7 31.5 32.3 30.6
15−49 yrs (%) 44.0 41.2 44.1 43.6 46.3 41.0 44.1 43.8
≥50 yrs (%) 10.4 7.9 7.0 9.5 9.7 8.7 7.3 8.8
Participants tested for malaria
Number blood slides done 7,745 1,996 1,860 11,601 1,997 779 473 3,249
Proportion of males (%) 45.6 46.4 48.3 46.1 54.0 50.1 50.4 51.7
Age structure
<5 yrs (%) 16.1 21.9 14.8 16.9 42.6 52.5 43.7 46.3
5−14 yrs (%) 30.8 33.1 36.1 32.0 25.3 25.5 27.6 25.9
15−49 yrs (%) 42.8 38.2 41.7 41.8 25.5 17.7 24.4 22.5
≥50 yrs (%) 10.3 6.8 7.4 9.2 6.7 4.3 4.3 5.2
Table 2: Proportion of people who reported sleeping under a net last night in all sampled households in malarious areas of three regional
states.
Regional state Slept under any net last night (%) Slept under LLIN last night (%)
DHS 2005∗ Baseline 2006 MIS 2007 DHS 2005∗ Baseline 2006 MIS 2007
All people
Amhara 1.1 25.8 46.5 0.4 12.5 43.8
Oromia 0.8 35.8 31.1 0.5 23.5 28.2
SNNP 3.2 34.7 29.1 2.6 28.3 28.7
Total 1.5 27.8 36.7 1.0 15.3 34.5
Children under five years of age
Amhara 2.1 29.2 56.3 0.9 14.5 51.8
Oromia 1.0 39.5 34.2 0.4 24.6 29.6
SNNP 3.6 41.5 36.3 3.2 31.9 35.9
Total 2.0 31.8 42.5 1.3 17.4 38.9
Pregnant women
Amhara 1.5 33.6 49.5 0.3 14.6 46.4
Oromia 0.0 41.0 30.7 0.0 29.2 24.4
SNNP 2.9 46.4 44.5 2.4 36.9 44.5
Total 1.3 35.9 41.0 0.8 18.9 37.4
DHS, Demographic and health survey; LLIN, long lasting insecticidal nets; MIS, malaria indicator survey; SNNP, Southern Nations, Nationalities and Peoples.
∗In DHS 2005 the proportions refer to persons under ITN not LLIN.
0 0.5 1 1.5 2
M
ean
n
u
mber
of
LLIN
p
er
HH
Amhara Oromia SNNP Total
DHS 2005 Baseline 2006 MIS 2007
Figure 4: Mean number of long lasting insecticidal nets per
household by survey and regional state.
to 17.4% (95% CI 13.6%−22.0%) and to 38.9% (95% CI 30.2%−48.3%) among children under five years, and from 0.8 (95% CI 0.3%−1.6%) to 18.9% (95% CI 14.0%−25.0%) and then to 37.4% (95% CI 26.2%−50.1%) among pregnant women.
However, when net use only in households possessing at least one net was assessed, net use among residents who had access to a net exhibited a significant decline between the baseline 2006 and MIS 2007 surveys. Use of a net the previous night by persons of all ages declined significantly from 70.8% (95% CI 66.6%−74.7%) in 2006 to 48.0% (95% CI 42.2%−54.0%) in 2007 in households owning at least one net, and from 71.7% (95% CI 66.1%−76.7%) to 48.3% (95% CI 42.3%−54.3%) among those owning at least one LLIN (Table 3). The decline in net use was observed
in all three regional states and among pregnant women as well as children under five years of age. Use of LLIN in households with at least one net declined from 72% (95% CI 63.9%−78.9%) to 51.3% (95% CI 43.7%−58.9%) in Amhara, from 72.9% (95% CI 62.8%−81.2%) to 51.5% (95% CI 41.1%−61.8%) in Oromia and from 68.6% (95% CI 61.7%−74.7%) to 38.2% (95% CI 26.0%−52.1%) in SNNP regions.
Overall in households that owned an LLIN, 79.5% (95% CI 72.7%−84.9%) of children under five years of age slept under an LLIN the previous night in baseline 2006 compared with 58.2% (95% CI 52.9%−63.4%) in MIS 2007. Likewise, LLIN use among pregnant women declined significantly from 82.7% (95% CI 70.4%−90.6%) to 58.3% (95% CI 43.0%−72.2%). Due to this lack of use by households that owned nets, the proportion of nets that were actually being used decreased significantly from 84.8% of 3,860 nets in the sample in baseline 2006 to 54.4% of 3,193 nets in the sample in MIS 2007. There was no statistically significant difference in the proportion of LLINs that were unused and encased within their original packages between baseline 2006 and MIS 2007 (6.0% versus 6.3%).
3.5. Malaria Prevalence. Table 4 presents malaria parasite
[image:7.600.58.285.362.516.2]Table 3: Proportion of people who reported sleeping under a net in households that owned at least one net in malarious areas of three
regional states.
Regional state Slept under any net last night (%)
∗ Slept under LLIN last night (%)∗∗
Baseline 2006 MIS 2007 Baseline 2006 MIS 2007
All people
Amhara 70.2 52.2 72.0 51.3
Oromia 76.9 48.6 72.9 51.5
SNNP 65.2 38.6 68.6 38.2
Total 70.8 48.0 71.7 48.3
Children under five years of age
Amhara 77.9 63.1 80.6 61.9
Oromia 81.9 57.5 77.0 56.5
SNNP 75.1 47.9 78.8 55.9
Total 78.4 57.8 79.5 58.2
Pregnant women
Amhara 80.3 58.2 82.5 56.7
Oromia 83.5 60.4 83.7 65.2
SNNP 82.8 55.8 82.0 55.8
Total 81.2 58.2 82.7 58.3
LLIN, long lasting insecticidal nets; MIS, malaria indicator survey; SNNP, Southern Nations, Nationalities and Peoples.
[image:8.600.50.555.384.474.2]∗In a household that owns at least one net (any type). ∗∗In a household that owns at least one LLIN.
Table 4: Prevalence of malaria by blood slide microscopy by age group in malarious areas of three regional states.
Age group Baseline 2006 MIS 2007
Number tested Prevalence (%) 95% CI Number tested Prevalence (%) 95% CI
<5 yrs 1,960 4.6 (3.4−6.1) 1,471 0.6 (0.2−1.7)
5−14 yrs 3,717 4.2 (3.2−5.5) 818 0.5 (0.1−1.9)
15−49 yrs 4,851 3.8 (3.0−4.7) 755 0.0 0.0−0.5∗
≥50 yrs 1,073 4.4 (2.9−6.6) 205 0.0 0.0−1.8∗
Total 11,601 4.1 (3.4−4.9) 3,249 0.4 (0.2−1.1)
∗
One-sided exact binomial 97.5% confidence interval.
0 2 4 6 8 10
Pre
va
le
n
ce
o
f
m
al
ar
ia
(%
)
Amhara Oromia SNNP Total
Baseline 2006 MIS 2007
Figure 5: Age adjusted prevalence of malaria by blood slide
microscopy, by survey and regional state.
there was no statistically significant difference between the three regional states during MIS 2007.
There was no significant difference in malaria parasite prevalence between individuals who did or did not report using a net the previous night. For individuals in baseline 2006, the prevalence was 3.7% (95% CI 2.9%−4.6) in net users and 4.2% (95% CI 3.4%−5.3%) in non users. The equivalent figures for MIS 2007 were 0.7% (95% CI 0.3%−1.8%) in users and 0.2% (95% CI 0.04%−1.1%) in non users. Similarly there was no significant difference in parasite prevalence between individuals living in households in which all, some or no nets were used. At baseline 2006 these percentages were 3.8% (95% CI 2.9%−4.9%), 3.3% (95% CI 2.0%−5.6%) and 4.3% (95% CI 3.3%−5.4%), respectively. By MIS 2007, prevalence was 0.9% (95% CI 0.3%−2.2%), 0.0% and 0.3% (95% CI 0.05%−1.3%) in households using all, some or no nets.
Plasmodium falciparum remained the dominant parasite
species in both surveys and in all three regional states, but
P. vivax represented a significant proportion of cases. During
[image:8.600.59.284.507.662.2]0 2 4 6 8 10 12 14 16 18 20 A ver age nig ht te mp per 8 da y p er iod (deg C ) Ja n Fe b Ma r Ap r May Ju n Ju l Au g
Sep Oct No
v Dec 2006 Ja n Fe b Ma r Ap r May Ju n Ju l Au g
Sep Oct No
v Dec 2007 Ja n Fe b Ma r Ap r May Ju n Ju l Au g
Sep Oct No
v Dec 2008 0 25 50 75 100 125 150 175 200 225 250 P recipitation p er 8 d ay per iod (mm) Amhara temp Oromia temp SNNPR temp Amhara rain Oromia rain SNNPR rain B’line 2006
AM ORSN
[image:9.600.90.509.69.411.2]MIS 2007 AM OR SN
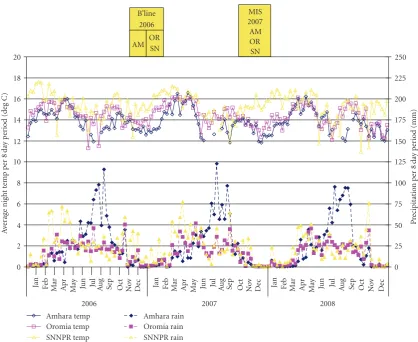
Figure 6: Average nighttime temperature and rainfall over 8 day periods, by survey and regional state. AM: Amhara; OR: Oromia; SN:
SNNPR.
The overall ratio of P. falciparum to P. vivax was similar at baseline 2006 (1.6) compared to MIS 2007 (1.5).
3.6. Climate. The country-averaged annual CMAP rainfall
estimates for 2006 and 2007 were 859 mm and 773 mm, respectively. These are both above the annual average for the 29-year period (1979−2007). Figure 6 shows rainfall and temperature data over the respective survey periods represented by the boxes at top of the figure. In Amhara, average nighttime temperature was 12.9◦C in baseline 2006 and 13.0◦C in MIS 2007; Oromia average temperature went down from 14.8◦C in baseline 2006 to 13.5◦C in MIS 2007; and SNNPR average temperature decreased from 16.0◦C in baseline 2006 to 15.3◦C in MIS 2007.
4. Discussion
The household ownership of long-lasting insecticidal nets in these three regional states of Ethiopia exhibited an enormous increase over less than a year’s time compared to the baseline estimates. The proportion of households owning at least one net nearly doubled and the proportion of those owning at least one LLIN more than tripled. The increase in coverage was significant in all three regional states but
more pronounced in Amhara, which saw a five-fold increase in the proportion of households owning at least one LLIN. From the results of our survey, it is clear that large scale-up of net ownership is possible over short periods of time in countries given the availability of adequate resources and strong commitment to increasing coverage [18]. Ethiopia is one of a few countries in the African region with high ITN coverage, and the only highly populous one [19].
age group [20]. A more recent comparative analysis of net use covering 15 countries over the period 2003 to 2006 by Eisele et al. suggested that higher net use by children under five (in households owning ITN) was associated with increased availability of nets in the household [21]. Thus, as the number of nets per household member increased (i.e., mean ratio of residents per net decreased from 6.8 to 3.7 by country), children under 5 were 2.1 to 5.5 times more likely to have slept under an ITN the previous night. However, when analyzed by country, Ethiopia was the sole exception among the fifteen countries surveyed, since there was no association between increased net availability (as assessed by decreased number of persons per net) and likelihood of use by children under five. Although this study used the Ethiopia DHS 2005 as a prebaseline, and few households owned nets at that time, this observation is corroborated with the findings in our study, that is, that ownership alone (even of multiple nets per household), although necessary, may not automatically lead to increased net use.
There are many possible explanations for the declining trend in use among households owning a net. First of all, more recent distribution of nets may have targeted less malarious areas. The results reported here are for areas in each regional state traditionally classified as malarious based on expert knowledge of malaria history as well as climate and other factors. However, these program target areas encompass a range of transmission intensities. Based on the prioritization approach that the country followed during the scaled-up LLIN distribution process, most of the highly malarious areas may have had the nets by 2006 while the lower incidence areas (where the need to use nets is less appreciated) may have received them later. Secondly, the education given about use of LLINs may not have been sufficient, especially in areas where transmission intensity is low. Thirdly, fewer malaria cases since 2006 may have resulted in less perceived risk of getting the disease, which in turn, may mean that people were again less inclined to use LLINs. Fourthly, deterioration in nets (e.g., wear and tear, dirt) could lead to the point where a proportion of people no longer want to use them. There was no significant difference in household socioeconomic status between the two surveys. Recent study report from Madagascar shows that net use was not associated with socioeconomic status [22].
Earlier studies in a rural district in northern Ethiopia and in selected urban and rural localities of Oromia and Amhara have also shown that not all nets owned by the households were being used properly [23, 24]. However, only 6% of nets were still encased within their original packages during both baseline 2006 and MIS 2007. The high community-level protective effect of ITN scale-up has been well documented in several rural African settings [25–29]. As such, it is likely that with such high LLIN coverage as was observed in MIS 2007, the hanging but unused nets would still contribute to reduction of malaria transmission.
Prevalence of malaria decreased significantly between the two surveys. This sharp decline in both P. falciparum and
P. vivax malaria was seen across the three regional states
and in all age groups. Contrary to earlier findings elsewhere that documented slower declines in P. vivax compared to P.
falciparum [28,30], both species saw proportionally sharp declines in our study areas. Although similar findings have been documented in other settings [28,31,32], attributing the decrease in prevalence solely to the scale-up of key malaria interventions (mainly LLIN and ACT), should be done cautiously. It is to be noted that Ethiopia carried out a nationwide Millennium Malaria Control Campaign involving malaria mass treatment with CoArtem starting in September 2007, just prior to MIS 2007. The campaign involved treatment of all febrile cases in malarious areas of the country through health extension workers. Further-more, there is variation and year-to-year fluctuation in the incidence of malaria due to the unstable nature of malaria transmission in Ethiopia [33,34].
Evidence from climate data sources suggests that neither rainfall differences between the survey years nor increase in mean temperature at the time of the surveys are likely to be responsible for change in net use or decrease in prevalence. Although nationwide, 2006 entertained more total annual rainfall (859 mm) compared with 2007 (773 mm); the MIS 2007 was actually conducted closer to the normal rainy season (July to September) and peak malaria months of October-December (seeFigure 6), which would tend to bias the results towards higher prevalence in the second survey. Analysis of temperature data by 8 day period shows that over the respective survey time periods, Amhara average nighttime temperature was essentially the same between the survey years, while it decreased slightly in Oromia and SNNPR. If temperature affects net use, this would tend to bias the results towards higher use in 2007.
A few caveats of the surveys and the data presented have to be outlined. The two surveys were conducted nearly one year apart, with the MIS 2007 follow-up survey being part of the nationwide MIS. Results on net use are based on self-reporting, and such cross-sectional surveys around the peak transmission season may not represent behavior at other times of the year. While both surveys employed multistage cluster sampling, the sampling frames were slightly different. At baseline 2006, only areas defined as “malarious” (program target areas defined by expert knowledge) in the three largest regional states were included in the sampling frame; oversampling (with appropriate weighting) in Amhara zones and in areas coendemic for onchocerciasis was done. In the baseline survey, clusters were defined as kebeles (the smallest administrative unit with an average of 1000 households). In MIS 2007, the sampling frame was all areas below 2500m, stratified (with appropriate weighting) to three domains: areas below 1500 m, rural areas between 1500 m and 2500 m, and urban areas between 1500 m and 2500 m; oversampling in Amhara and Oromia was also done to obtain regional estimates. In MIS 2007, clusters were defined as census enumeration areas (with an average of 200 households in each).
the multilevel sample weights estimated for each survey. Sensitivity analysis in which we included all (malarious and nonmalarious) clusters from MIS 2007 in the three regional states of interest gave similar results for net ownership and use (data not shown), but we believe that the current approach of restriction to “malarious” areas for both surveys is more conservative and appropriate, despite the resulting large decrease in sample size for the MIS 2007.
Ethiopia has recently made tremendous progress in scale-up of malaria interventions. To build further on the encour-aging increase in net ownership and maintain the low levels of malaria parasite prevalence, proper and consistent use of all nets available in the household must be promoted more widely. Health extension workers and/or onchocerciasis and trachoma community workers will identify remaining gaps in net coverage and the factors associated with use or nonuse of mosquito nets qualitatively. Appropriate educational materials have been developed and will continue to be refined to intensify promotion of proper use and care of LLINs.
5. Conclusions
Our study showed that large scale-up of net ownership over a short period of time is possible in countries strongly committed to mobilizing all available resources to expand access. It also showed that in these three regional states of Ethiopia, malaria prevalence declined significantly over the course of less than a year. However, our findings suggest that a large increase in net ownership is not necessarily mirrored directly by increased net use. Better targeting of nets to malaria risk areas and more aggressive and sustained education and behavioural change communication campaigns are needed to increase and maintain net use.
The Ethiopia MIS Working GROUP
Mekonnen Amena, Laurent Bergeron, Hana Bilak, Brian Chirwa, Firew Demeke, Wubishet Dinkessa, Yeshewamebrat Ejigsemahu, Paul M Emerson, Tekola Endeshaw, Kebede Etana, Gashu Fente, Scott Filler, Anatoly Frolov, Khoti Gausi, Teshome Gebre, Tedros Adhanom Gebreyesus, Alemayehu Getachew, Asefaw Getachew, Patricia M Graves, Zelalem HaileGiorgis, Afework Hailemariam, Jimee Hwang, Daddi Jima, Henok Kebede, Abraham Lilay, Christopher Lungu, Ambachew Medhin, Addis Mekasha, John Miller, Hussein Mohamed, Aryc W Mosher, Sirgut Mulatu, Rory Nefdt, Jeremiah Ngondi, Dereje Olana, Richard Reithinger, Frank O Richards Jr, Judith Robb-McCord, Amir Seid, Estifanos Biru Shargie, Richard Steketee, Zerihun Tadesse, Tesfaye Teferri, Agonafer Tekalegn, Eskindir Tenaw, Abate Tilahun, Adam Wolkon, Biratu Yigezu, Gedeon Yohannes.
Acknowledgments
The baseline survey was financially and technically supported by The Carter Center and carried out in collaboration with the Amhara, Oromia, and SNNP Regional Health Bureaus. The follow-up Malaria Indicator Survey 2007 was the result
of joint efforts by multiple partners, including the Federal Ministry of Health of Ethiopia, The Carter Center, Malaria Control and Evaluation Partnership for Africa (MACEPA, a program at PATH), World Health Organization (WHO), United Nations Children’s Fund (UNICEF), U.S. Agency for International Development (USAID), U.S. Centers for Disease Control and Prevention (CDC), the Central Statis-tical Agency, Center for National Health Development in Ethiopia, and Malaria Consortium. The opinions expressed are those of the authors and may not reflect the position of their employing organization or of their work’s sources of funding. We are grateful to Michael Bell and Stephen Connor, International Research Institute for Climate and Society at Columbia University for assistance with climate data. The authors owe sincere gratitude to all the survey participants who gave freely of their time in the surveys.
References
[1] “The Roll Back Malaria Partnership: The global malaria action plan for a malaria free world,” Geneva: RBM Secretariat, 2008. [2] WHO Global Malaria Programme: Position Statement
on ITNs. Geneva: WHO, http://apps.who.int/malaria/docs/
itn/ITNspospaperfinal.pdf.
[3] “Federal Ministry of Health: Insecticide treated nets: national strategic plan for going to scale with coverage and utilization in Ethiopia, 2004—2007,” FMOH, Addis Ababa, Ethiopia, 2004.
[4] “Ministry of Health: Malaria prevention and control extension package,” FMOH, Addis Ababa, Ethiopia, 2003.
[5] “Health Extension and Education Center: Health Extension Program In Ethiopia: profile,” FMOH, Addis Ababa, Ethiopia, 2007.
[6] Central Statistical Agency: Ethiopia Demographic and Health Survey 2005. Central Statistical Agency, Addis Ababa, Ethiopia, 2006.
[7] P. M. Emerson, J. Ngondi, E. Biru et al., “Integrating an NTD with one of ”the big three” combined malaria and trachoma survery in Amhara region of Ethiopia,” PLoS Neglected Tropical
Diseases, vol. 2, no. 3, article no. e197, 2008.
[8] E. B. Shargie, T. Gebre, J. Ngondi et al., “Malaria prevalence and mosquito net coverage in Oromia and SNNPR regions of Ethiopia,” BMC Public Health, vol. 8, article no. 321, 2008. [9] “Federal Democratic Republic of Ethiopia Ministry of Health:
Ethiopia National Malaria Indicator Survey 2007: Technical Summary,” FMOH, Addis Ababa, Ethiopia, 2008.
[10] D. Jima, A. Getachew, H. Bilak et al., “Malaria indicator survey 2007, Ethiopia: coverage and use of major malaria prevention and control interventions,” Malaria Journal, vol. 9, article no. 58, 2010.
[11] Roll Back Malaria Monitoring and Evaluation Reference Group WHO, M. D. United Nations Children’s Fund, MEA-SURE Evaluation, and U.S. Centers for Disease Control and Prevention: Malaria Indicator Survey: Basic documentation for survey design and implementation: MEASURE Evaluation. WHO, Calverton, Md, USA, 2005.
[12] Federal Ministry of Health of Ethiopia: Malaria diagnosis and
treatment: guidelines for health workers in Ethiopia, FMOH,
Addis Ababa, Ethiopia, 2nd edition, 2004.
[14] “Climate Prediction Center Merged Analysis of Precipitation (CMAP) version 2, 12-Month Weighted Anomaly
Standard-ized Precipitation (WASP) index,”http://ingrid.ldeo.columbia
.edu/maproom/.Health/.Regional/.Africa/.Malaria/.MDG/in-dex.html?Set-Language=en.
[15] T. Dinku, S. Chidzambwa, P. Ceccato, S. J. Connor, and C. F. Ropelewski, “Validation of high-resolution satellite rainfall products over complex terrain,” International Journal
of Remote Sensing, vol. 29, no. 14, pp. 4097–4110, 2008.
[16] C. Vancutsem, P. Ceccato, T. Dinku, and S. J. Connor, “Evaluation of MODIS land surface temperature data to
estimate air temperature in different ecosystems over Africa,”
Remote Sensing of Environment, vol. 114, no. 2, pp. 449–465,
2010.
[17] P. M. Graves, F. O. Richards, J. Ngondi et al., “Individual, household and environmental risk factors for malaria infec-tion in Amhara, Oromia and SNNP regions of Ethiopia,”
Transactions of the Royal Society of Tropical Medicine and Hygiene, vol. 103, no. 12, pp. 1211–1220, 2009.
[18] A. Teklehaimanot, J. D. Sachs, and C. Curtis, “Malaria control needs mass distribution of insecticidal bednets,” Lancet, vol. 369, no. 9580, pp. 2143–2146, 2007.
[19] World Health Organization: World malaria report 2008. WHO, Geneva, Switzerland, WHO/HTM/GMP/2008.1, 2008. [20] E. L. Korenromp, J. Miller, R. E. Cibulskis, M. K. Cham, D. Alnwick, and C. Dye, “Monitoring mosquito net coverage for malaria control in Africa: possession vs. use by children under 5 years,” Tropical Medicine and International Health, vol. 8, no. 8, pp. 693–703, 2003.
[21] T. P. Eisele, J. Keating, M. Littrell, D. Larsen, and K. Macintyre, “Assessment of insecticide-treated bednet use among children and pregnant women across 15 countries using standardized national surveys,” American Journal of Tropical Medicine and
Hygiene, vol. 80, no. 2, pp. 209–214, 2009.
[22] N. Thawani, M. A. Kulkarni, and S. Sohani, “Factors associ-ated with coverage and usage of long-lasting insecticidal nets in madagascar,” Journal of Tropical Medicine, vol. 2009, Article ID 451719, 6 pages, 2009.
[23] B. Haileselassie and A. Ali, “Assessment of insecticide treated nets coverage for malaria control in Kafta-Humera district, Tigray: possession versus use by high-risk groups,” The
Ethiopian Journal of Health Development, vol. 22, no. 3, pp.
259–267, 2008.
[24] C. Baume, B. Menna, T. Sewnet et al., Dubiwak: Ethiopia bed net utilization study: why some nets owned are not used. Addis Ababa: AED-NetMark, 2007.
[25] A. Bhattarai, A. S. Ali, S. P. Kachur et al., “Impact of artemisinin-based combination therapy and insecticide-treated nets on malaria burden in Zanzibar,” PLoS Medicine, vol. 4, no. 11, article no. e309, 2007.
[26] T. P. Eisele, K. A. Lindblade, K. A. Wannemuehler et al., “Effect
of sustained insecticide-treated bed net use on all-cause child mortality in an area of intense perennial malaria transmission in western Kenya,” American Journal of Tropical Medicine and
Hygiene, vol. 73, no. 1, pp. 149–156, 2005.
[27] A. Habluetzel, D. A. Diallo, F. Esposito et al., “Do insecticide-treated curtains reduce all-cause child mortality in Burkina Faso?” Tropical Medicine and International Health, vol. 2, no. 9, pp. 855–862, 1997.
[28] A. M. Noor, G. Moloney, M. Borle, G. W. Fegan, T. Shewchuk, and R. W. Snow, “The use of mosquito nets and the prevalence of Plasmodium falciparum infection in rural South Central Somalia,” PLoS ONE, vol. 3, no. 5, article no. e2081, 2008.
[29] P. A. Phillips-Howard, B. L. Nahlen, M. S. Kolczak et al.,
“Efficacy of permethrin-treated bed nets in the prevention
of mortality in young children in an area of high perennial malaria transmission in western Kenya,” American Journal of
Tropical Medicine and Hygiene, vol. 68, no. 4, pp. 23–29, 2003.
[30] L. F. Chaves, A. Kaneko, G. Taleo, M. Pascual, and M. L. Wilson, “Malaria transmission pattern resilience to climatic variability is mediated by insecticide-treated nets,” Malaria
Journal, vol. 7, article no. 100, 2008.
[31] K. I. Barnes, P. Chanda, and G. Ab Barnabas, “Impact of the large-scale deployment of artemether/lumefantrine on the malaria disease burden in Africa: case studies of South Africa, Zambia and Ethiopia,” Malaria Journal, vol. 8, supplement 1, article no. S8, 2009.
[32] M. Otten, M. Aregawi, W. Were et al., “Initial evidence of reduction of malaria cases and deaths in Rwanda and Ethiopia due to rapid scale-up of malaria prevention and treatment,”
Malaria Journal, vol. 8, no. 1, article no. 14, 2009.
[33] R. E. Fontaine, A. E. Najjar, and J. S. Prince, “The 1958 malaria epidemic in Ethiopia,” American Journal of Tropical Medicine
and Hygiene, vol. 10, pp. 795–803, 1961.
[34] A. E. Kiszewski and A. Teklehaimanot, “A review of the clinical and epidemiologic burdens of epidemic malaria,” American
Journal of Tropical Medicine and Hygiene, vol. 71, no. 2,
Submit your manuscripts at
http://www.hindawi.com
Hindawi Publishing Corporation
http://www.hindawi.com Volume 2013
Obesity
Journal ofHindawi Publishing Corporation
http://www.hindawi.com Volume 2013 Hindawi Publishing Corporation
http://www.hindawi.com Volume 2013
The Scientific
World Journal
Hindawi Publishing Corporation
http://www.hindawi.com Volume 2013
Mediators
inflaMMation
of
ISRN
Anesthesiology
Hindawi Publishing Corporation
http://www.hindawi.com Volume 2013
Complementary and Alternative Medicine
Volume 2013 Hindawi Publishing Corporation
http://www.hindawi.com
Ophthalmology
Journal ofHindawi Publishing Corporation
http://www.hindawi.com Volume 2013
Hindawi Publishing Corporation
http://www.hindawi.com Volume 2013
Computational and Mathematical Methods in Medicine
ISRN Allergy Hindawi Publishing Corporation
http://www.hindawi.com Volume 2013
BioMed Research International
Hindawi Publishing Corporation
http://www.hindawi.com Volume 2013
Endocrinology
Hindawi Publishing Corporationhttp://www.hindawi.com Volume 2013
ISRN
Addiction Hindawi Publishing Corporation
http://www.hindawi.com Volume 2013
Hindawi Publishing Corporation http://www.hindawi.com
Oncology
Journal ofVolume 2013
ISRN
AIDS Hindawi Publishing Corporation
http://www.hindawi.com Volume 2013 Hindawi Publishing Corporation
http://www.hindawi.com Volume 2013 Oxidative Medicine and Cellular Longevity
Diabetes Research Hindawi Publishing Corporation
http://www.hindawi.com Volume 2013
Clinical & Developmental Immunology
Hindawi Publishing Corporation
http://www.hindawi.com Volume 2013
Hindawi Publishing Corporation
http://www.hindawi.com Volume 2013
Research and Practice
Hindawi Publishing Corporation
http://www.hindawi.com Volume 2013 ISRN
Biomarkers
PPAR
R e s e a r c h
Hindawi Publishing Corporation