Peer review of teamwork for encouraging equal
commitment to the group effort
Andrew P. Wandel
University of Southern Queensland, Toowoomba, Australia andrew.wandel@usq.edu.au
Keith Willey
University of Technology, Sydney, Sydney, Australia Keith.Willey@uts.edu.au
Abstract: An important graduate attribute is the ability to work in teams, so many university courses incorporate this as part of the learning experience. However, it is inevitable that in some teams there will be members who do not contribute as much to the overall effort as others, leading to frustration in those members who carry the majority of the burden. When there are students enrolled in distance-education mode, this can be exacerbated because many of the teams cannot meet face-to-face, so it can be difficult to exert sufficient influence to force problematic individuals to amend their behaviour. In an effort to mitigate against this problem, self and peer assessment was used for both team assignments in a Problem-Based Learning (PBL) course and the results of the peer assessment were used to scale the team mark for the corresponding assignment to obtain individual grades. After submitting their final assignment, a survey instrument was used to investigate the success of this process. The students overwhelmingly supported the
idea of distributing marks based on the value of the individual’s contribution because in
many teams it had the desired effect of motivating underperforming members to involve themselves more in the second assignment. There was some dissatisfaction about the process used to distribute marks, which the authors will attempt to address by providing better scaffolding in subsequent uses of the software tool. Regardless of these difficulties, we found that a transparent mechanism for distributing team marks to individual grades is beneficial for encouraging equal commitment to the team effort by all team members.
Introduction
The ability to work in teams is a fundamental attribute of engineers (Dowling, Carew, & Hadgraft, 2010). In order for universities to teach this attribute, it is becoming common for Problem-Based Learning (PBL) courses and programmes to be offered (Du & Kolmos, 2009; Gibbings, Lidstone, & Bruce, 2010; Said, Adikan, Mekhilef, & Rahim, 2005). However, one of the hurdles of team projects is allocating final grades from a team project to each individual student; to overcome this, peer assessment is commonly used (Cinar & Bilgin, 2011; Hersam, Luna, & Light, 2004; Johns-Boast & Flint, 2009; Willey & Gardner, 2010).
In a course offered in web-only mode with a class of 22 students split equally between on-campus and distance-education, Menchaca, Resta, and Awalt (2002) found that the students’ confidence in
performing peer assessments increased with the number of assessments performed. They noted that gender, culture and enrolment mode all had an influence on the self- and peer-assessment, but required more study for validation. Pombo, Loureiro and Moreira (2010) studied on-campus teams who performed most of their work online (the first and last sessions were held face-to-face). They found that the students understood the assessment criteria better because of the self- and peer-assessment.
It is probable that students’ approaches to teamwork will be different depending on their life
mature-age, with full-time jobs (seeking career advancement through their study) and many with families; so they are likely to have already worked as part of a team on a project in the course of their careers. By contrast, the majority of on-campus students enrol at university directly from high school, many have part-time jobs unrelated to their study (because they have minimal professional experience) and are likely to have not formed a family unit. It is the authors’ experience from teaching PBL in mixed -mode courses that the mature-age student will be more pragmatic with their expectations from the teamwork. They recognise that they are isolated, so construct different relationships, being more outcome-driven than the on-campus students, who can be more social because they can meet every day of the week (Yang & Jin, 2008). As a consequence, the interaction between the students is significantly different. Distance-education students are likely to hold weekly meetings outside business hours using synchronous internet communication (either textual: chat rooms; or oral: e.g. Skype), while on-campus students are likely to meet more often, during business hours and all together (Wandel, 2011). This difference in exposure means that on-campus students will consider being more careful in their dealings with each other due to the more immediate repercussions from treating a teammate unfavourably, therefore their attitudes towards peer assessment will differ.
In this paper, we report the results for a direct comparison of on-campus and distance education students using self and peer assessment to assess each other's contribution to a team project. These initial results suggest that peer assessment affects the two cohorts differently. The on-campus students appear inclined to be more competitive with each other, so are in favour of individually-distributed, anonymous peer assessment, while being less cooperative in attempting to balance the workload for a more beneficial overall result. Two of the contributing factors to this competitive nature are the relative youth of the on-campus students and their inherent proximity to each other.
The Current Study
The 2010 offer of a PBL course was studied, with students grouped into teams of 4–5; the on-campus
(“internal”) and distance (“external”) students were segregated. After submission of both team assignments, students used SPARKPLUS (Willey & Freeman, 2006b) to complete self and peer
assessment to rate contributions to the team project using a range of criteria such as programming and report writing. The results of these assessments were used to moderate the team mark into individual grades. A survey instrument was used to capture student opinions immediately after submitting the second team assignment and peer assessment, but before the results were returned to them. The instrument consisted of a series of Likert-scale questions and free response answers.
Results/Discussion
In line with good ethical practice, students were under no obligation to complete the survey
instrument. Of the 143 students enrolled in the subject, 38 out of the 84 enrolled in the distance mode and 8 out of the 59 enrolled in the on-campus mode completed the survey instrument. In addition to comparing the results for on-campus and distance modes, comparisons were made between different age groups to investigate any differences in students’ opinions. In the 16–21 age group there were 5 respondents; 22–25: 6 respondents; 26–35: 17 respondents and 36+: 17 respondents.
As shown in Figure 1, respondents from both cohorts (100% on campus, 84% distance)
overwhelmingly supported awarding different marks to individuals based on their contribution. Similarly, this support was consistent across all age groups. The reason for this support was typified by the following free response comments (copied verbatim):
Respondent 3 (Mode: Internal, Age: 26–35, Strongly Agree): It provides a chance for everyone to receive marks that are more appropriate to thier contribution.(sic)
Respondent 7 (External, 26–35, Agree): Can identify when someone dosent pull thier weight (sic)
Figure 1: Student opinions on whether individuals should receive different marks (shown by enrolment mode and age range).
Figure 2: Student opinions on whether individual marks were allocated fairly.
Respondent 7 (External, 26–35, Strongly Disagree): Even the smallest difference can have a massive effect on some team members marks, this is wrong and needs to be sorted.
Respondent 8 (External, 36+, Strongly Disagree): It is just a way for people to try to adjust thier score so they get a better mark.
Respondent 19 (External, 26–35, Agree): I think it needs to be less sensitive. It seemed to make a big difference on how the marks were distributed.
Upon reflection the authors consider that these comments may be the result of students not fully understanding how the software worked. For example, in entering their assessments a student may have made only slight variations in the ratings they gave each team member and was surprised to see comparatively large variations in the resulting moderation. As each student's ratings were confidential they were not aware of how individuals assessed each other. To improve this outcome, in future semesters it is proposed that the software will be used to provide formative feedback early in the semester so the students become more familiar with the process (Menchaca, et al., 2002) and provide the opportunity for students to learn how the system works so they are more comfortable with it.
The apparent sensitivity could also be due to at least one team member providing dishonest assessments. In the study reported here the lecturer moderated the assessments to ignore the submissions of students who blatantly attempted to bias the results; scores were also reviewed upon appeal. However, subtle variations in SPA were deemed acceptable (e.g. 0.96 or 1.02), and with assignments marked out of 200 and 300, these small variations can be amplified so that students lose up to 1 or 2% from their total grade for the course, which raises concerns. Respondents also expressed their concerns in regard to academic honesty in their free response answers, including the following:
[image:3.595.81.520.283.422.2]Respondent 41 (Internal, 22–25, Disagree): If people were honest, it would be a great help, having done all of the programming for the first assignment and writing the majority of the report, for people to mark me down and on those aspects is pretty disappointing.
In line with the recommendations made by Willey and Freeman (2006a) to improve academic honesty, in future students will receive the final results for each of their team member, including the feedback factors that indicate students who over rate their contribution.
Another issue raised by students were the limitations in the assessment criteria chosen for the study. For example, Respondent 3 (Internal, 26–35, Neutral) reported:
“The assessment criterior were very limited. I found some did not really represent the functioning of our group and there were areas that people missed out on receiving acknowledgement because it did not appear in the criterior” (sic)
To address this in future semesters, the criteria will be altered to allow for the different ways in which teams allocate tasks. Assessment of the technical contribution will be based on an overall rating of the
member’s contribution to the technical solution of the problem, rather than assigning weightings to individual tasks. Each member’s contribution to the running of the team (e.g. “completed allocated tasks”, “completed tasks on time”) will also form part of the peer assessment. By using holistic judgements of the member’s contribution, individuals are not disadvantaged because their primary task was not specifically assessed (Willey & Gardner, 2010).
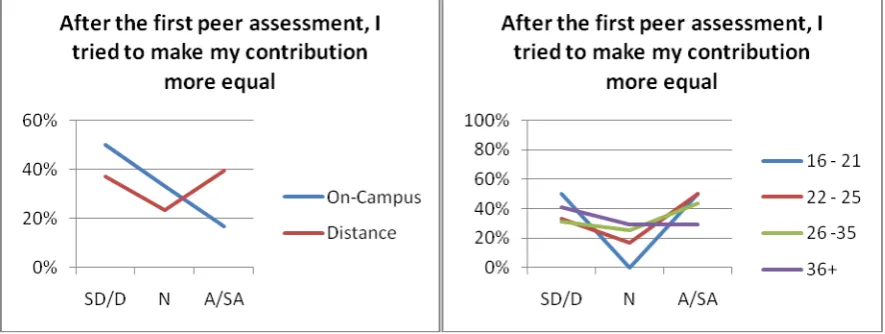
The reason for using the self and peer assessments was to assist students in effecting changes in their behaviour where required. Figure 3 shows that a significant number of respondents (40% on campus, 40% distance) report trying to make a fairer contribution after receiving the results for the first peer assessment. Interestingly but not unexpectedly the older students 36+ yrs were least likely (29%) to change their contribution. It is not unreasonable to expect that these older students being more mature and self-confident may be less likely to need feedback from their peers to change their behaviour.
While the relatively high number of respondents who disagreed or were neutral may at first appear to be an issue, it should be noted that these respondents may have already been contributing fairly and hence did not need to alter their contribution as a result of the first peer assessments. The fact that a significant number of both on- and off-campus students changed their behaviour is a positive result.
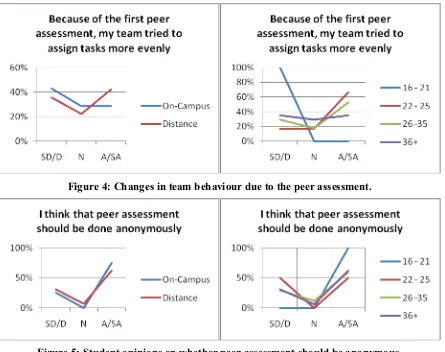
[image:4.595.77.520.566.733.2]Furthermore, Figure 4 shows that a significant number of teams (29% on campus, 42% distance) as a direct result of the peer assessment tried to allocate tasks more evenly among team members. Again the relatively large number of neutral and disagreeing respondents may have been teams that were already functioning effectively and hence did not need to amend their behaviour. Interestingly, it was the 22–25yrs (67%) and 26–35yrs (53%) age groups that most often reported that the teams tried to assign tasks more evenly. In this study there is insufficient data to draw any conclusions from this result, however future studies will examine this further. Comments on the behaviour change included:
Figure 4: Changes in team behaviour due to the peer assessment.
Figure 5: Student opinions on whether peer assessment should be anonymous.
Respondent 21 (External, 36+, Disagree, Agree): Enables distribution of workload on the second assignment easier
Respondent 26 (External, 36+, Agree, Agree): One of our members was noticeably more involved in the second assignment. I think it was good for the team and for the individual that the peer assessment gave this person a bit of a nudge.
In order for peer assessment to be effective, students need to be confident that they can provide an honest assessment without fear of repercussions; this is most effectively achieved with anonymous assessments. Both the on-campus (75%) and distance mode (62%) students agreed that the peer assessment should be done anonymously (Figure 5). Furthermore, it is not unreasonable to consider that more mature people are better prepared for dealing with difficult social situations, particularly where there is the potential for an attack on their ego. Hence it is unsurprising that the youngest students (16–21 yrs: 100%) are more adamant that the peer assessment should be anonymous compared to approximately half of the students in the other age groups.
Recommendations
As a result of this study in future semesters we will endeavour to improve the process by:
1. Implementing formative feedback early in the semester so students can both learn how the system works and if necessary positively adjust their behaviour earlier in the semester.
2. Positively influence academic honesty by sharing individual results with all team members, including the feedback factors that indicate students who over rate their contribution.
Conclusions
This paper directly compared on-campus and distance education students, to find that peer assessment affects the different cohorts in different ways because of the ways in which the team members interact with each other. Although only based on a small cohort, the results suggest that on-campus students appear to lack the confidence to openly challenge imbalances in workload and inequity in grades, so prefer individually-distributed, anonymous peer assessment. It is possible that a significant influence on this is the level of direct interaction that occurs when team members are able to meet face-to-face, part of ongoing investigations (Wandel, 2011). Another factor is that on-campus students tend to be younger and therefore lack the maturity to deal with potential threats to their egos. These factors suggest that the general approach to teamwork situations can differ significantly between the two categories of students. These factors should be considered when facilitating teamwork projects.
References
Cinar, Y., & Bilgin, A. (2011). Peer Assessment for Undergraduate Teamwork Projects in Petroleum Engineering. International Journal of Engineering Education, 27(2), 310–322.
Dowling, D. (2010). The career aspirations and other characteristics of Australian para-professional engineering students. Proceedings of the 21st Annual Conference for the Australasian Association for Engineering Education (pp. 24–31). Sydney.
Dowling, D., Carew, A., & Hadgraft, R. (2010). Engineering your future: an Australasian Guide. Brisbane: John Wiley & Sons.
Du, X., & Kolmos, A. (2009). Increasing the diversity of engineering education – a gender analysis in a PBL context. European Journal of Engineering Education, 34(5), 425 - 437.
Gibbings, P., Lidstone, J., & Bruce, C. (2010). How do student attributes influence the way students experience problem-based learning in virtual space? Australasian Journal of Engineering Education, 16(1), 69–80. Hersam, M. C., Luna, M., & Light, G. (2004). Implementation of Interdisciplinary Group Learning and Peer
Assessment in a Nanotechnology Engineering Course. Journal of Engineering Education, 93(1), 49-57.
Johns-Boast, L., & Flint, S. (2009). Providing students with 'real-world' experience through university group projects.Proceedings of the 20th Annual Conference for the Australasian Association for Engineering Education (pp. 299–304). Adelaide.
Menchaca, M., Resta, P., & Awalt, C. (2002). Self and Peer Assessment in an Online Collaborative Learning
Environment. Proceedings of World Conference on E-Learning in Corporate, Government, Healthcare, and
Higher Education 2002 (pp. 682–689). Montreal, Canada.
Pombo, L., Loureiro, M. J., & Moreira, A. (2010). Assessing collaborative work in a higher education blended learning context: strategies and students’ perceptions. Educational Media International, 47(3), 217 - 229. Said, S. M., Adikan, F. R. M., Mekhilef, S., & Rahim, N. A. (2005). Implementation of the problem-based
learning approach in the Department of Electrical Engineering, University of Malaya. European Journal of Engineering Education, 30(1), 129 - 136.
Wandel, A. P. (2011). Team Formation by Region to Improve Outcomes for Distance-Education Students in a PBL Course. FIE 2011 (To appear). Rapid City, SD.
Willey, K., & Freeman, M. (2006a). Completing the learning cycle: The role of formative feedback when using self and peer assessment to improve teamwork and engagement. Paper presented at the Proceedings of the 17th Annual Conference for the Australasian Association for Engineering Education, Auckland.
Willey, K., & Freeman, M. (2006b). Improving Teamwork and Engagement: the Case for Self and Peer Assessment. Australasian Journal of Engineering Education, 12, 2006-2002.
Willey, K., & Gardner, A. (2010). Investigating the capacity of self and peer assessment activities to engage students and promote learning. European Journal of Engineering Education, 35(4), 429 - 443.
Yang, M. C., & Jin, Y. (2008). An Examination of Team Effectiveness in Distributed and Co-located Engineering Teams. International Journal of Engineering Education, 24(2), 400–408.
Acknowledgement
The first author is grateful for financial support from the Engineering Education Research Group (EERG) at USQ to attend this conference.