UNIVERSITY OF SOUTHERN QUEENSLAND
A CONCEPTUAL MODEL FOR PROACTIVE DETECTION
OF POTENTIAL FRAUD IN ENTERPRISE SYSTEMS:
EXPLOITING SAP AUDIT TRAILS TO DETECT
ASSET MISAPPROPRIATION
A dissertation submitted by
KISHORE HARICHUNDER SINGH
For the award of
Doctor of Philosophy
ABSTRACT
Fraud costs the Australian economy approximately $3 billion annually, and its frequency and financial impact continues to grow. Many organisations are poorly prepared to prevent and detect fraud. Fraud prevention is not perfect therefore fraud detection is crucial. Fraud detection strategies are intended to quickly and efficiently identify frauds that circumvent preventative measures so that an organisation can take appropriate corrective action.
Enhancing the ability of organisations to detect potential fraud may have a positive impact on the economy. An effective model that facilitates proactive detection of potential fraud may potentially save costs and reduce the propensity of future fraud by early detection of suspicious user activities. Enterprise systems generate millions of transactions annually. While most of these are legal and routine transactions, a small number may be fraudulent. The enormous number of transactions makes it difficult to find these few instances among legitimate transactions. Without the availability of proactive fraud detection tools, investigating suspicious activities becomes overwhelming.
CERTIFICATION OF DISSERTATION
I certify that the ideas, experimental work, results, analyses, software and conclusions reported in this dissertation are entirely my own effort, except where otherwise acknowledged. I also certify that the work is original and has not been previously submitted for any other award, except where otherwise acknowledged.
__________________________________ _____________________
Signature of Candidate Date
ENDORSEMENT
__________________________________ _____________________
Signature of Supervisor Date
__________________________________ _____________________
ACKNOWLEDGEMENTS
This dissertation would not have been possible without the guidance, help, support and encouragement from my supervisors, independent reviewers, expert panel members, family and friends. I would like to express my sincere gratitude to my supervisors, Professor Peter Best and Associate Professor Joseph Mula for their professional guidance, assistance and encouragement during this journey. Professor Peter Best provided exceptional technical insight required for this research. Associate Professor Joseph Mula provided outstanding guidance in developing the research and he spent several hours reading and providing exceptional feedback that helped improve the writing and the structure of this dissertation.
I would like to express my thanks to Mr Nalinde Jayasekara and Mr Kamal Manatunga for agreeing to trial the prototype software and for their independent reviews of the prototype. I would also like to thank Mr John J Halliday, Executive Director Advisory, BDO Australia for providing an independent review of the prototype software and for hosting of an expert panel session.
This research would not have been complete without feedback from members of the expert panel. I would like to thank members of CPA Australia (Queensland Division - IT Discussion Group) and ISACA (Queensland Chapter) that participated in the panel, and for their valuable comments and feedback.
My thanks and love is also dedicated to my wife Bharati and my son Akhil. Their encouragement and support gave me strength and persistence to complete this long PhD journey. I would also like to thank all my friends for their support and encouragement.
TABLE OF CONTENTS
ABSTRACT ...i
CERTIFICATION OF DISSERTATION...ii
ACKNOWLEDGEMENTS ... iii
LIST OF FIGURES ...viii
LIST OF TABLES...xiii
CHAPTER 1 Introduction...16
1.0. Background...16
1.1. Research problem...19
1.2. Study design ...22
1.3. Key definitions...23
1.4. Delimitations of scope...30
1.5. Research significance ...33
1.6. Structure of dissertation...35
1.7. Conclusion ...36
CHAPTER 2 Literature Review...38
2.0. Introduction ...38
2.1. Definition of fraud ...40
2.1.1. Asset misappropriation...42
2.1.2. Corruption...46
2.1.3. Fraudulent financial statements ...47
2.2. Occurrence and cost of fraud ...48
2.3. Motivation to commit fraud...53
2.4. Framework for perpetrating fraud...59
2.5. Fraud scenarios ...65
2.6. Proactive fraud detection...69
2.7. Continuous monitoring strategies ...74
2.7.1. Embedded Audit Modules (EAMs) ...77
2.8. Enterprise Systems ...84
2.9. SAP Enterprise System ...87
2.10. Audit trails ...90
2.11. Enterprise system audit trails support for fraud detection...93
2.12. Gaps in the literature ...97
2.13. Conclusion ...99
CHAPTER 3 Research Design and Methodology... 102
3.0. Introduction ... 102
3.1. Study design ... 103
3.2. Research design ... 107
3.2.1. Research questions ... 107
3.2.2. Conceptual model... 109
3.2.3. Research propositions... 112
3.3. Research methodology ... 118
3.3.1. Scope of fraud categories ... 120
3.3.2. Measures to detect fraud... 121
3.3.3. Data requirements to detect potential fraud... 124
3.3.4. Prototype... 127
3.3.5. Data collection ... 132
3.3.6. Proof of conceptual model... 133
3.3.7. Expert panel validation of model ... 134
3.4. Conclusion ... 137
CHAPTER 4 Prototype Design... 139
4.0. Introduction ... 139
4.1. Prototype design... 140
4.2. Data requirements for fraud detection... 141
4.3. SAP support for fraud detection ... 143
4.3.1. SAP audit trails ... 144
4.4. Catalogue of fraud symptoms ... 150
4.4.1. Critical combinations ...151
4.4.2. Known fraud symptoms ...153
4.5. Design specification for fraud detection strategies ...154
4.7. Output...177
4.8. User interface...181
4.9. Errors...183
4.10. Verification and validation of prototype ... 184
4.11. Prototype design and propositions addressed ...188
4.12. Conclusion ... 190
CHAPTER 5 Prototype Implementation and Testing ... 192
5.0. Introduction ... 192
5.1. Prototype implementation ... 193
5.1.1. Workstation environment ... 193
5.1.2. Development environment... 193
5.1.3. Data extraction and pre-processing ... 194
5.1.4. Reporting system... 197
5.2. Verification and testing of prototype ... 204
5.2.1. Test data... 205
5.2.2. Case study 1a: Data from large international manufacturing company ... 212
5.2.3. Case study 1b: Subset of case study 1a data... 218
5.2.4. Case study 1a: Summary of findings and recommendations... 220
5.3. Processing times... 223
5.4. Validation and independent review of prototype...229
5.5. Prototype implementation and testing and propositions ...236
5.6. Conclusion ... 238
CHAPTER 6 Conclusion and Further Research ... 241
6.0. Introduction ... 241
6.1. Summary of results from this study ... 241
6.2. Contributions ... 250
6.2.1. Theoretical contributions ... 251
6.2.2. Contributions to the practice of fraud detection ... 257
6.3. Limitations... 259
6.4. Recommendations ...261
6.4.1. Recommendations for further research ...261
6.4.2. Recommendations for extensions to prototype...264
LIST OF REFERENCES... 274
APPENDICES... 287
Appendix 1: Fraud cases ... 287
Appendix 2: Expert panel protocol ... 291
Appendix 3: Prototype evaluation questionnaire... 293
Appendix 4: Prototype menu navigation... 296
Appendix 5: Results from test data ... 308
Appendix 6: Results from case study 1a ... 333
Appendix 7: Results from case study 1b ... 350
Appendix 8: Data extraction... 353
LIST OF FIGURES
Figure 2.1: Categories of occupational fraud ...43
Figure 2.2: Position of fraud perpetrator ...51
Figure 2.3: Fraud cases based on perpetrator's department ...51
Figure 2.4: Median loss by perpetrator's department ...52
Figure 2.5: Fraud triangle ...56
Figure 2.6: Theoretical foundation for research...58
Figure 2.7: Fraud perception model (FPM) ...61
Figure 2.8: High-level fraud scenarios model (HFSM)...63
Figure 2.9: Fraud detection process...71
Figure 2.10: Detection of occupational fraud ...73
Figure 3.1: Conceptual model ... 110
Figure 3.2: Research propositions ... 114
Figure 3.3: Methodology ... 119
Figure 3.4: Critical AP activities model ... 122
Figure 3.5: Flipping vendor bank account details ...127
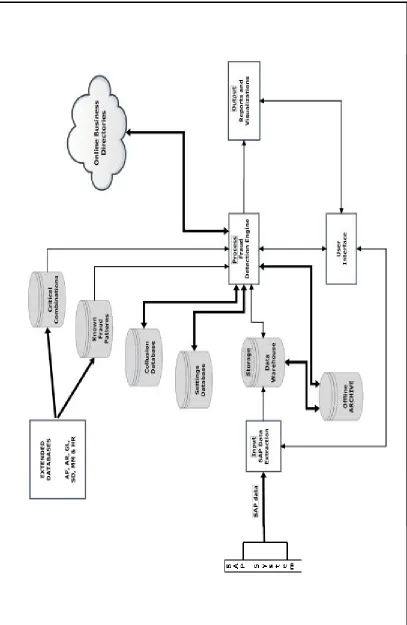
Figure 3.6: The prototype model... 129
Figure 3.7: Prototype input requirements ... 130
Figure 3.8: Source of data ... 133
Figure 3.9: Expert panel interaction and feedback ... 137
Figure 4.1: Prototype conceptual design... 141
Figure 4.2: Input specifications ... 142
Figure 4.3: SAP audit trails ... 146
Figure 4.4: Process module ... 151
Figure 4.5: Detection strategy- users violating SoDs principle 1...156
Figure 4.6: Detection strategy- users violating SoDs principle 2...157
Figure 4.7: Detection – flipping vendor bank account ... 159
Figure 4.8: Detection – duplicate transactions ... 160
Figure 4.9: Detection – invoices with round dollar amounts ...161
Figure 4.10: Detection – invoices below approval limit...163
Figure 4.11: Detection – vendor payments exceeding last largest ...164
Figure 4.13: Detection – vendors with similar names ... 166
Figure 4.14: Detection – vendors becoming active after long period ... 167
Figure 4.15: Detection – multiple vendors with different payment details ... 169
Figure 4.16: Detection – multiple vendors sharing payment details ...170
Figure 4.17: Detection – Benford's Law analysis of invoices... 172
Figure 4.18: Storage module ... 177
Figure 4.19: Output module ... 177
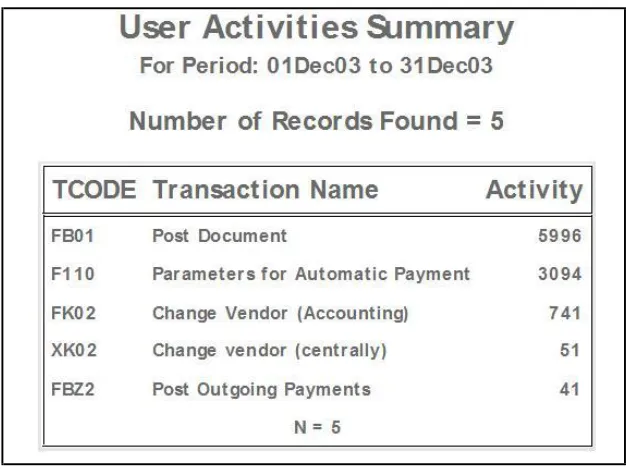
Figure 4.20: Visualisation - activity summary ... 180
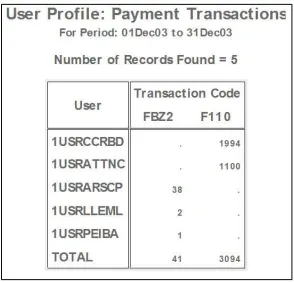
Figure 4.21: Visualisation - user profile ... 180
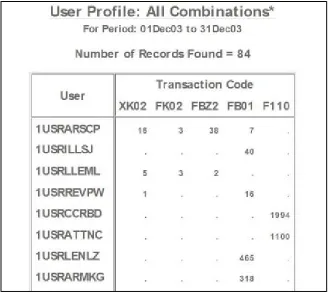
Figure 4.22: Visualisation – interaction between users and individual vendor ... 181
Figure 4.23: User-interface ... 182
Figure 4.24: Verification and validation... 184
Figure 4.25: Prototype logical design... 191
Figure 5. 1: User interface... 195
Figure 5.2: Process map – complete ... 198
Figure 5.3: Analysis process ...199
Figure 5.4: Dashboard... 200
Figure 5.5: User activity reports...202
Figure 5.6: Individual vendor reports ... 203
Figure 5.7: Number of records processed ... 226
Figure 6.1: Model of extended prototype ... 269
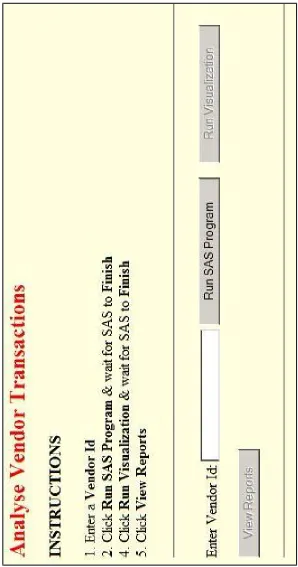
Figure A4.1: Start-up screen ... 296
Figure A4. 2: Accounts payable summary menu ... 297
Figure A4. 3: User profiles menu ...297
Figure A4. 4: Critical combinations menu... 298
Figure A4. 5: User activity analysis menu ... 298
Figure A4. 6: Detailed user activity analysis menu... 299
Figure A4. 7: User activity reports menu... 300
Figure A4. 8: Vendor analysis menu ... 301
Figure A4. 9: Analyse vendor transactions menu ...302
Figure A4. 10: Analysis of vendor transactions (reports) menu ...303
Figure A4. 11: Search vendor menu ...304
Figure A4. 13: Set date range for analysis menu ... 305
Figure A4. 14: Set approval limit for invoices & payments menu...306
Figure A4. 15: File processing menu... 306
Figure A4. 16: Data conversion & import menu... 307
Figure A4. 17: Update/create data warehouse selection screen ...307
Figure A5.1: Dashboard...309
Figure A5. 2: User activities summary ... 310
Figure A5. 3: User profile – vendor maintenance ... 310
Figure A5. 4: User profile – invoice transactions ... 311
Figure A5. 5: User profile – payment transactions... 311
Figure A5. 6: User profile – invoices or payment transactions... 312
Figure A5. 7: User profile – all combinations... 312
Figure A5. 8: Visualisation – all combinations... 313
Figure A5. 9: Violation of SoDs – users entering invoices and payments ...314
Figure A5. 10: Visualisation - users entering invoices and payments... 314
Figure A5. 11: Violation of SoDs – users performing vendor maintenance... 314
Figure A5. 12: Visualisation - users performing vendor maintenance... 315
Figure A5. 13: Violation of SoDs – users performing vendor maintenance... 315
Figure A5. 14: Visualisation - users performing vendor maintenance... 316
Figure A5. 15: Violation of SoDs – users performing vendor maintenance,... 316
Figure A5. 16: Visualisation - users performing vendor maintenance,...317
Figure A5. 17: Bank account changes by user - 1USRARSCP ... 317
Figure A5. 18: Invoice transactions by user - 1USRARSCP...318
Figure A5. 19: Payment transactions by user - 1USRARSCP...318
Figure A5. 20: Round dollar payments by user - 1USRARSCP...319
Figure A5. 21: Vendors touched by user - 1USRARSCP ... 319
Figure A5. 22: Visualisation – vendors touched by user - 1USRARSCP ... 320
Figure A5. 23: User 1USRARSCP interacting with vendor 0002000041... 321
Figure A5. 24: Vendors sharing bank accounts ...322
Figure A5. 25: Visualisation - vendors sharing bank accounts...323
Figure A5. 26: Vendors with multiple bank accounts ...324
Figure A5. 27: Visualisation - vendors having multiple bank accounts...325
Figure A5. 29: Vendors with multiple master records ... 327
Figure A5. 30: Top 5 vendors by sum of invoices ... 328
Figure A5. 31: Top 5 vendors by sum of payments ... 328
Figure A5. 32: Benford's Law – analysis of vendor invoices ...329
Figure A5. 33: Benford's Law – investigation of spike at digit 49 ... 329
Figure A5. 34: Benford's Law – analysis of vendor payments ...330
Figure A5. 35: Benford's Law – investigation of spike at digit 22 ... 330
Figure A5. 36: Transaction history for vendor – showing flipping...331
Figure A5. 37: Visualisation - users interacting with vendor ...331
Figure A5. 38: Visualisation – vendor transaction history ...332
Figure A6.1: Dashboard...334
Figure A6. 2: User activities summary ... 335
Figure A6. 3: User profile – vendor maintenance ... 335
Figure A6. 4: User profile – invoice transactions ... 336
Figure A6. 5: User profile – payment transactions... 336
Figure A6. 6: User profile – invoices or payment transactions... 337
Figure A6. 7: User profile – all combinations... 337
Figure A6. 8: Visualisation – all combinations... 338
Figure A6. 9: Violation of SoDs – users entering invoices and payments ...339
Figure A6. 10: Violation of SoDs – users performing vendor maintenance... 339
Figure A6. 11: Visualisation - users entering invoices and payments... 340
Figure A6. 12: Visualisation - users performing vendor maintenance... 340
Figure A6. 13: Violation of SoDs – users performing vendor maintenance... 341
Figure A6. 14: Violation of SoDs – users performing vendor maintenance,... 341
Figure A6. 15: Visualisation - users performing vendor maintenance... 342
Figure A6. 16: Visualisation - users performing vendor maintenance,...342
Figure A6. 17: Vendors sharing bank accounts ...343
Figure A6. 18: Vendors with multiple bank accounts ... 343
Figure A6. 19: Visualisation - vendors sharing bank accounts...344
Figure A6. 20: Visualisation - vendors having multiple bank accounts...345
Figure A6. 21: Vendors with multiple changes...346
Figure A6. 22: Vendors with multiple master records ...346
Figure A6. 24: Top 5 vendors by sum of payments ... 347
Figure A6. 25: Benford's Law – analysis of vendor invoices ...348
Figure A6. 26: Benford's Law – investigation of spike at digit 36 ... 348
Figure A6. 27: Benford's Law – analysis of vendor payments ...349
Figure A6. 28: Benford's Law – investigation of spike at digit 22 ... 349
Figure A7.1: Dashboard...350
Figure A7. 2: User activities summary ... 351
Figure A7. 3: Risky user list ... 351
Figure A7. 4: Benford's Law – analysis of vendor invoices ...352
LIST OF TABLES
Table 2.1: Categories of occupational fraud and abuse ...48
Table 2.2: Sub-categories of asset misappropriation (US Data) ...49
Table 2.3: Sub-categories of asset misappropriation (Oceania Data) ...50
Table 2.4: Control weakness that contributed to fraud...50
Table 2.5: Fraud matrix (FM) ...66
Table 3.1: Research paradigms ...104
Table 3.1: Mapping of research questions, propositions and process ... 116
Table 3.2: Methods to detect known fraud symptoms... 125
Table 4.1: Source of data to detect known fraud symptoms ...145
Table 4.2: SAP transaction codes... 152
Table 4.3: Violation of SoDs principle 1 ... 153
Table 4.4: Violation of SoDs principle 2 ... 153
Table 4.5: Known AP fraud symptoms ...155
Table 4.6: Risk Index variables ... 175
Table 4.7: Activity summary... 180
Table 5.1: Source of data to detect known fraud symptoms ...196
Table 5.2: Control values - activities performed by users ... 206
Table 5.3: Control values - violation of segregation of duties ...206
Table 5.4: Control values - activities performed by user 1USRARSCP ...206
Table 5.5: Control values - summary of vendor transactions ... 207
Table 5.6: Control values – Benford's Law ...207
Table 5.7: Activities performed by users ... 208
Table 5.8: Violation of segregation of duties... 209
Table 5.9: Activities performed by user 1USRARSCP... 209
Table 5.10: Summary of vendor transactions ...210
Table 5.11: Correspondence between control values and experimental values... 212
Table 5.12: Activities performed by users ...213
Table 5.13: Violation of segregation of duties ...213
Table 5.14: Summary of activities by 1USRA...214
Table 5.16: Summary of activities by 1USREEWAH...216
Table 5.17: Summary of activities by 1USRN... 216
Table 5.18: Summary of vendor transactions ...217
Table 5.19: Activities performed by users ... 219
Table 5.20: Violation of segregation of duties ... 219
Table 5.21: Summary of vendor transactions ...220
Table 5.22: Processing time - stage 1 test... 223
Table 5.23: Number of records processed ... 224
Table 5.24: Processing time – stage 2 test ... 224
Table 5.25: Number of records processed ... 225
Table 5.26: Processing time – stage 3 test ... 225
Table 5.27: Number of records processed ... 226
Table 5.28: Summary of records processed for all tests ...226
Table 5.29: Average processing time for all tests ... 227
Table 5.30: Operation ... 231
Table 5.31: Reports... 232
Table 5.32: Visualisations...232
Table 5.33: Accuracy, efficiency and performance... 233
Table 5.34: Auditor productivity... 233
Table 5.35: Time to process data manually ... 234
Table 5.36: Time to process data with other software... 234
Table 5.37: Time to process data with prototype ... 235
Table 5.38: Overall evaluation ...235
Table A8.1: SAP tables and field requirements ... 353
Table A8.2: Summary data extraction procedure...354
CHAPTER 1
Introduction
1.0. Background
According to the Association of Certified Fraud Examiners (ACFE) Report to the Nations on Occupational Fraud & Abuse, "a typical organisation loses five percent of its annual revenue to fraud. Applied to the estimated 2009 Gross World Product of $58.07 trillion, this figure translates to a potential total fraud loss of more than $2.9 trillion" (ACFE 2010 p.4). Within Australia this figure is approximately $3 billion annually (Standards Australia 2008). These figures are clear evidence that fraud is a major problem, which requires serious study by researchers to minimise illegal activities. A fundamental first step in studying the fraud problem is to unambiguously define fraud itself.
There are two principal methods of getting something from others illegally. They can either be physically forced, or they can be deceived into giving up their assets. The first type is called robbery and the second is fraud. Albrecht et al. (2009) defines fraud as a deception made for personal gain. "Deception" is key. The most common definition of fraud according to Webster's Dictionary (2001 p.380) is:
"Fraud is a generic term that embraces all the multifarious
means which human ingenuity can devise, which are resorted
to by one individual, to get an advantage over another by
laid down as a general proposition in defining fraud, as it
includes surprise, trickery, cunning and unfair ways by which
another is cheated. The only boundaries defining it are those
which limit human knavery."
Australian Government Fraud Control Guidelines define fraud as (ComLaw 2011 p.4):
"theft; accounting fraud (false invoices, misappropriation etc); unlawful use
of, or obtaining property, equipment, material or services; causing a loss, or
avoiding and/or creating a liability; providing false or misleading
information, or failing to provide it when there is an obligation to do so;
misuse of assets, equipment or facilities; making, or using false, forged or
falsified documents; and wrongfully using information or intellectual
property."
Furthermore, the Government identifies fraud as targeting revenue, benefits, property, information and intelligence, funding and grants, entitlements, facilities, and money or property. Benefits obtained fraudulently are not restricted to monetary or material benefits, and may be tangible or intangible, including unauthorised provision of access to or disclosure of information. Benefits may also be obtained by third parties in addition to the fraud perpetrator.
assets. Fraudulent financial reporting involves deliberate misstatements or omissions of amounts or disclosures of financial statements to deceive investors and creditors, increase share price, meet cash flow needs or hide company losses and problems (Romney and Steinbart 2009 ; Wells 2008 ; Casabona and Grego 2003). The ACFE extends this definition by classifying frauds and the methods used to commit them.
The ACFE (2010 p.6) defines occupational fraud as:
"…the use of one's occupation for personal enrichment
through the deliberate misuse or misapplication of the
employing organization's resources or assets…"
Occupational fraud is very broad and it encompasses a range of transgressions by employees at all levels of an organisational hierarchy. These include i) asset misappropriations, which involve theft or misuse of an organisation's assets; ii) corruption, in which employees wrongfully use their influence in business transactions to gain some benefit for themselves or another person, contrary to their duty to their employer; and iii) fraudulent statements, which usually involve falsification of an organisation's financial statements.
dissatisfaction among employees. Affected employees may seek relief by resorting to fraudulent behaviour when an opportunity presents itself.
Owners incur costs in order to monitor opportunistic behaviour of employees. By implementing an accounting system, owners are able to leverage an essential in-built business function of providing adequate controls to safe guard organisational assets. An accounting system provides a means of implementing and improving the internal control structure of an organisation (Romney and Steinbart 2009). An effective accounting system provides an audit trail that allows frauds to be discovered and makes concealment difficult. Potential fraud can be discovered in accounting records by examining transactions that are anomalous or appear otherwise unreasonable.
Implementing a well-designed internal control policy enables an organisation to reduce opportunities for employees to commit occupational fraud. Further reduction in fraud may be achieved by introducing proactive fraud detection mechanisms that use computer-based technology (Broady and Roland 2008) to monitor and analyse business processes at an "unprecedented level of detail" (Alles et al. 2006 p.138).
1.1. Research problem
2009). Fraud prevention is not perfect, therefore fraud detection is crucial. Fraud detection strategies are intended to quickly and efficiently identify those frauds that have circumvented preventative measures so that an organisation can take appropriate corrective action (Standards Australia 2008).
A review of various fraud surveys reveals that fraud is a crisis that is being faced by organisations internationally. Of all frauds detected in organisations, only 17% were attributed to the internal audit function (PwC 2009). According to PwC, internal audit is the primary method of detecting frauds, however the trend is that fewer frauds are being consistently detected. Opportunities to commit fraud are increasing, yet insufficient resources are being deployed to improve internal controls. Many organisations are considering the use of data analytics and information technology (IT) to detect fraud (KPMG 2008). Using IT to proactively detect fraud enables organisations to monitor and analyse large transaction datasets in real or near real time, a task that cannot be accomplished, practically, if done manually (Alles et al. 2006).
financial transactions in enterprise systems (Kotb and Roberts 2011 ; Debreceny and Gray 2010 ; Kuhn Jr and Sutton 2010).
An issue often raised in the literature relates to information overload from alerts when implementing continuous fraud detection systems (Alles et al. 2008 ; Alles et al. 2006 ; Kuhn and Sutton 2006 ; Hunton et al. 2004). A related issue deals with the integrity of data used for continuous fraud detection (Kuhn Jr and Sutton 2010). These are important issues, as there appears to be potential demand for efficient and effective implementation of continuous fraud detection in organisations.
The modern global digital economy has significantly changed the way business is conducted and therefore the traditional approach to auditing can no longer be of real value to business performance or regulatory compliance. Most organisations conduct their business activities online and in real-time. This necessitates continuous monitoring and auditing thereby enabling internal auditors to perform their analyses of key business systems in real- or near real-time (Kotb and Roberts 2011 ; Kuhn Jr and Sutton 2010 ; Alles et al. 2006 ; Coderre 2005 ; Alles et al. 2002 ; Rezaee et al. 2002 ; Kogan et al. 1999).
company assets or bribe suppliers. Physical possession of stolen property is no longer required and it is just as easy to program a computer to embezzle $1 as it is $1 million. Consequently, the best way to reduce the incidence of fraud is to implement fraud prevention and detection mechanisms. Industry intelligence (by means of Google searches and literature review) indicates that several accounting systems have integrated fraud prevention mechanisms built-in to software. However, there appears to be a lack of generic tools that proactively detect potential fraud in enterprise systems. The focus of this research is therefore on developing a generic model for proactive detection of potential fraud in enterprise systems. Actual fraud occurring can only be confirmed once potential fraudulent activities are fully investigated. Thus, the primary research question for this study is:
Can a generalised model for proactive detection of potential fraud
in enterprise systems be developed?
1.2. Study design
This research aims to answer the question whether "a generalised model for proactive detection of potential fraud in enterprise systems can be developed". The research methodology for this study consists of the following separate yet interdependent stages.
i). Literature review – to recognise theories and concepts that underpin this research and to identify gaps in the literature.
iii). Identify data requirements to detect fraud in enterprise systems, in general and SAP, in particular.
iv). Design, develop and implement prototype software on a stand-alone computer system.
v). Perform experiments with simulated test data and case study data to verify program functionality of the prototype.
vi). Seek support from experts for validity of the prototype.
The primary objective of this research is to explore and develop innovative methods for proactively detecting potential fraud in enterprise systems. The intention is to build a model for detection of potential fraud based on analysis of patterns or signatures1. This research proposes a methodology for proactive detection of potential fraud that exploits audit trails in enterprise systems. The concept is demonstrated by developing a prototype. The aim of the prototype is to confirm the feasibility of implementing proactive detection of potential fraud in practice. The prototype is a software application that analyses transaction data from an SAP enterprise system for indicators of potential fraud. Reports and visualisations highlighting anomalous activities are produced. Further investigation of these findings may be initiated at the discretion of an auditor.
1.3. Key definitions (In alphabetical order)
To ensure that terms used throughout the thesis are understood, they are defined here.
1
Audit trails – provide a record of users' activities within an information system. They provide a means to accomplish several security related goals such as review of access, review of changes in security, review of attempts to bypass security and fraud detection. For the purpose of fraud detection they can be used to identify 'red flags' or anomalous activities perpetrated by real users acting in their own name, acting in collusion with other users, or by real users masquerading as others. In each case, the actions of these 'users' are recorded in audit trails (Albrecht et al. 2009).
Asset misappropriation – includes schemes in which perpetrators steal or misuse organisational resources, for example, skimming cash receipts, falsifying expense reports, shell company schemes, or payments to non-existent or ghost employees (ACFE 2010).
Billing schemes – perpetrators use false documentation, such as invoices, purchase orders or credit cards, to cause their employer to issue payments for some fraudulent purpose. Disbursement of funds is performed by an organisation in the same manner as a legitimate disbursement. The key to this scheme is the ability of a perpetrator to deceive an employer into willingly and unwittingly making a bogus payment (ACFE 2010).
source. Dashboards may be customised in a multitude of ways and named accordingly, for example the fraud analytics dashboard developed in this research organises and presents data about various indicators in the accounts payable system (Marane 2008).
Data - qualitative or quantitative attributes of a variable or set of variables. Data are typically the results of measurements and can be the basis of graphs, images, or observations of a set of variables. Data are often viewed as the lowest level of abstraction from which information and then knowledge are derived. Raw data or unprocessed data refers to a collection of numbers, characters, images or other outputs from devices that collect information to convert physical quantities into symbols. Data on its own carries no meaning. For data to become information, it must be interpreted and take on a meaning (Oxford 2012). (Also see information).
Embezzlement – an employee wilfully takes company's money or property by reason of employment or position of trust. Embezzlement may be direct or indirect. Direct embezzlement involves theft of company cash, inventory or other assets. Indirect embezzlement occurs when an employee establishes a shell corporation and issues false invoices to their employer for payment of goods and/or services that are not actually delivered (Albrecht et al. 2009 ; Wells 2008).
Enterprise systems – also referred to as enterprise resource planning (ERP) systems, integrate internal and external management information across all areas of an organisation. Business areas may include financial, accounting, manufacturing, sales, customer relationship management, human resources and so on. These systems facilitate flows of information within organisational boundaries and manage connections to external business partners (Kamhawi 2008 ; Koch and Wailgum 2008 ; Norris et al. 2000).
Internal controls – are controls within an organisation that ensure data is processed correctly. They perform three important functions. Preventative controls deter problems before they arise. Detective controls discover problems as soon as they arise. Corrective controls remedy problems that have been discovered. Internal controls are an integral part of any organisations operating activities. They provide reasonable, rather than absolute assurance because providing complete assurance is difficult to achieve and prohibitively expensive (Romney and Steinbart 2009).
Materiality – the importance or significance of an amount, transaction, or discrepancy. The objective auditing financial statements is to enable an auditor to express an opinion whether financial statements are prepared in conformity with an identified financial reporting framework such as Generally Accepted Accounting Principles (GAAP). The assessment of what is material is a matter of professional judgment. Information is considered material if its omission or misstatement could influence the economic decision of users taken on the basis of financial statements (CPA 2009).
Module – in software, a module is part of a larger program. Modules are interchangeable components that perform specific functions. An individual module contains everything needed to accomplish a specific function. Modules may be integrated into larger programs through interfaces (Velastin 1991).
Ponzi scheme – a type of fraudulent investment scheme that pays investors returns from their own money or monies paid by subsequent investors, rather than from profits earned by an individual or organisation running an investment scheme. The purpose of the scheme is to entice new investors to hand over funds by offering high short-term returns (Albrecht et al. 2009).
Red-flags – early warning symptoms or indicators of fraud. These symptoms may include changes in an employee's lifestyle, a general ledger being out of balance, an employee behaving suspiciously, or an anonymous tip that fraud is occurring. Investigation of these fraud symptoms may result in early detection of frauds (Albrecht et al. 2009).
Shell corporation – a company which serves as a mechanism for business transactions without itself having any significant assets. They are not in themselves illegal and have legitimate business purposes; however, fraudsters use them to commit fraud. Fraudsters create these fictitious entities and submit false invoices, in the name of the entity, to an employer for payment (Wells 2008).
Validation - is an attempt to ensure that the right product is built and that it fulfils its specific intended purpose (IEEE 2004).
Vendor fraud - includes a broad range of schemes, from perpetrators that create fictitious shell companies and submit invoices for payment, to trusted suppliers that overcharge an organisation for more than is actually supplied or done. Some vendors may even collude with an organisation's own employees to help commit the fraud as part of a kickback scheme. An example of a non-accomplice vendor fraud scheme is when a perpetrator changes vendor payment details to a personal account, submits invoices for payment, and subsequently changes payment details back to the original values, causing payment to be misdirected to a personal bank account (Best et al. 2009 ; Wells 2002a).
Verification - is an attempt to ensure that a product is built correctly and that outputs of activities meet specifications imposed on them during the design phase (IEEE 2004).
Visualisation tools go beyond standard charts and graphs, displaying data in more sophisticated ways such as dials and gauges, heat maps, tree maps and detailed bar and pie charts. Visualised data is frequently displayed in dashboards (TechTarget 2010).
White collar crime – a crime committed by a respectable person in a high position in an organisation during the course of their occupation. An individual personally benefits from the crime to the detriment of an organisation (Wells 2008).
1.4. Delimitations of scope
There is some delimitation of scope of this study to ensure that it concentrates on the research questions, propositions and objectives only. When considering an automated solution for proactive fraud detection, the focus has to be on questions that can be answered with the aid of computerised tools (Lanza 2007). Some questions are too subjective, for example, "Are the vendor's goods or services of good quality?" Any effort to develop an automated solution will require evidence that is documented in an enterprise system's audit trails and that can be investigated using data analytics tools. Transactions that occur outside an enterprise system cannot be investigated using this methodology.
; KPMG 2009 ; PwC 2009). Cash assets were more frequently targeted than non-cash assets and billing schemes were the most common method used to misappropriate cash assets. This research examines the feasibility of developing a model for proactive detection of potential billing fraud schemes involving shell companies and non-accomplice vendors within accounts payable. Hereinafter these schemes are referred to as ‘vendor frauds.’
fraud schemes. [Testing and evaluation of the prototype will provide evidence that the concept of proactive detection of potential fraud is feasible in practice.]
The prototype developed in this research is intended to address the primary research question by providing evidence that "a generalised model for proactive detection of potential fraud in enterprise systems can be developed". Such a prototype is meant to demonstrate that the "concept of proactive detection of potential fraud" is feasible in practice. It is a limited version meant for showcasing the concept and for testing purposes only. Some functions may be incomplete, not implemented or may not even work at all.
The prototype makes no assumption about individual SAP installations. It relies exclusively on transaction data obtained from the financial module to perform its analysis. Other factors that are not considered by the prototype include; sophistication of fraudsters, posting of transactions by system and security administration staff, collusion between fraudsters to circumvent internal controls, and organisations wherein segregation of duties may not be feasible due to small numbers of staff. These situations require additional compensating manual processes to safeguard against inappropriate activities.
have occurred, Throughout this thesis the term 'fraud', 'fraud detection', or 'fraud detection tool' means 'potential' fraud not 'actual' fraud.
1.5. Research significance
Australia has an estimated $3 billion per year financial fraud problem that continues to worsen (Standards Australia 2008). This research directly addresses the national research priority of safeguarding Australia, in particular the priority goals of critical infrastructure and protecting Australia from terrorism and crime (ARC 2011). Australian criminal codes define fraud as 'crime' and prescribe prison terms of up to ten years where fraud is committed by an employee or company director.
Although fraud surveys reveal that fraud is increasing, it is difficult to know for sure. It is impossible to know what percentage of perpetrators are caught. There may be frauds that are never discovered. Many frauds that are detected are handled quietly by the victim organisations as they are more concerned about reputation, and costs associated with fraud investigations
Enhancing the ability of organisations in the private and public sectors to detect fraud is important for the following reasons:
• Detecting financial fraud will enhance the stability of businesses and the economy. Extraordinary impacts have been observed on stock exchanges both in the United States and Australia following major financial frauds (for example, Enron, WorldCom, HiH Insurance and Lehman Brothers).
profit margin at the time of the fraud was ten percent, the firm would have to generate ten times more revenue to restore the effect on net income.
• Outcomes of this research will enhance protection for stakeholders (shareholders, lenders, and employees) that stand to lose a great deal when major financial frauds are detected.
• This research is of particular relevance to financial institutions and the retail and public sectors (for example, Queensland Health Hohepa Morehu-Barlow Fraud Case) as they appear to be major financial fraud targets in Australia. These organisations represent a major component of the nation's critical infrastructure.
appropriate corrective action thereby reducing the propensity for losses associated with future fraud.
1.6. Structure of dissertation
Chapter 1 - Introduction. This first Chapter discusses the background to this study which includes the research problem, study design, definitions of key terms used throughout this dissertation, delimitation of the scope, and significance of this study.
Chapter 2 - Literature review. This Chapter discusses the relevant literature on fraud, its theoretical underpinnings that constitute this research and its detection in enterprise systems. Previous studies in this area of research are discussed and relevant gaps in the literature are identified. The primary research question is developed from the gaps identified in the literature.
Chapter 3 - Research methodology. Based on the literature review, a theoretical framework is developed and discussed in this Chapter. The research methodology used during the course of this study for data collection, methods to detect fraud, and analysis are also discussed. An expert panel protocol and instrument for collecting evidence for validation of the prototype are also developed.
specifications are produced. A logical design and detection algorithms are subsequently developed from the design specifications.
Chapter 5 - Prototype implementation and testing. This Chapter addresses research propositions RP2a, RP2b and RP2c. Implementation and test results of the prototype are described with reference to a number of appendices. Verification of the prototype is achieved by performing a series of tests using test data involving simulated activity. Case study data from a large international manufacturing company is processed using the prototype, exposing it to live data. Validation is achieved by obtaining independent reviews from auditing practitioners and an expert panel demonstration. Timing experiments are conducted to provide evidence in support of auditor productivity.
Chapter 6 - Conclusion and future research. The final Chapter summarises conclusions of this study, contributions to the literature and auditing practice, limitations, and recommendations for future research and extensions to the prototype.
1.7. Conclusion
proactive and continuous monitoring for potential fraud without difficulties. Research is required to develop innovative approaches for proactive detection of potential fraud, and to demonstrate how this can be done efficiently and effectively. Information overload from alerts produced by automated fraud detection systems also appears to be a problem.
CHAPTER 2
Literature Review
2. Literature Review
2.0. Introduction
Fraud is inherent in all organisations. Edwin H. Sutherland, a criminologist at Indiana University, coined the phrase "white-collar crime" in 1939 (Sutherland 1940). Donald R. Cressey, a student of Sutherland, was especially interested in embezzlers, whom he referred to as "trust violators". He was intrigued by what led these people to be overcome by temptation. Upon completion of his work, Cressey developed the classic model for the occupational offender. This model, more commonly referred to as the 'fraud triangle', underpins the theoretical foundation for this study (Cressey 1950).
2007 ; KPMG 2004). Fraud prevention is not perfect therefore, fraud detection is crucial. Fraud detection strategies are intended to quickly and efficiently identify those frauds that have circumvented preventative measures so that an organisation can take appropriate corrective action (Standards Australia 2008).
methods of using information technology to proactively detect potential fraud in enterprise systems. A fundamental first step in studying the fraud problem is to unambiguously define fraud itself.
2.1. Definition of fraud
There are two principal methods of getting something from others illegally. They can either be physically forced, or they can be deceived into giving up their assets. The first type is called robbery and the second is fraud. Albrecht et al. (2009) defines fraud as a deception made for personal gain. "Deception" is key. The most common definition of fraud according to Webster's Dictionary (2001 p.380) is:
"Fraud is a generic term that embraces all the multifarious
means which human ingenuity can devise, which are resorted
to by one individual, to get an advantage over another by
false representations. No definite and invariable rule can be
laid down as a general proposition in defining fraud, as it
includes surprise, trickery, cunning and unfair ways by which
another is cheated. The only boundaries defining it are those
which limit human knavery."
Australian Government Fraud Control Guidelines define fraud as (ComLaw 2011 p.4):
"theft; accounting fraud (false invoices, misappropriation etc); unlawful use
of, or obtaining property, equipment, material or services; causing a loss, or
information, or failing to provide it when there is an obligation to do so;
misuse of assets, equipment or facilities; making, or using false, forged or
falsified documents; and wrongfully using information or intellectual
property."
Furthermore, the Government identifies fraud as targeting revenue, benefits, property, information and intelligence, funding and grants, entitlements, facilities, and money or property. Benefits obtained fraudulently are not restricted to monetary or material benefits, and may be tangible or intangible, including unauthorised provision of access to or disclosure of information. Benefits may also be obtained by third parties in addition to the fraud perpetrator.
The ACFE (2010 p.6) defines occupational fraud as:
"…the use of one's occupation for personal enrichment
through the deliberate misuse or misapplication of the
employing organization's resources or assets…"
Occupational fraud is very broad and it encompasses a range of transgressions by employees at all levels of an organisational hierarchy. Occupational fraud can be divided into three categories: fraudulent statements, corruption and asset misappropriation (ACFE 2010) (Figure 2.1).
The three broad categories of occupational fraud generally correspond to the three broad levels of hierarchy in an organisation. The production of fraudulent statements is often orchestrated at board/executive-level, while corruption mostly affects people in management positions, i.e. people who have the power to influence company's decisions in favour of the corrupting party. Asset misappropriation is most common among non-management employees, primarily because these employees do not have opportunities to commit fraud at the previous two levels (ACFE 2010 ; KPMG 2010 ; Albrecht et al. 2009 ; Wells 2008).
2.1.1. Asset misappropriation
Figure 2.1: Categories of occupational fraud
Asset misappropriation involves the misuse and appropriation of company assets for personal gain. It is divided into two subcategories: a) misappropriation of cash, and b) misappropriation of inventory and other assets that can usually be turned into cash. Cash schemes involve larceny, skimming and fraudulent disbursements. Non-cash schemes involve misuse and larceny (ACFE 2010 ; Albrecht et al. 2009 ; Coenen 2008 ; Wells 2008 ; Potla 2003).
Larceny involves taking an employer's cash or other assets without the consent and against the will of the employer, after it has been recorded in the company's records. The two main methods are: a) theft of cash on hand, and b) theft from the cash bank deposit. In order to prevent detection, the fraudster will have to create or modify accounting documents explaining the cash shortage. Skimming schemes are schemes where cash is stolen before a book entry is made. This may involve not recording or understating of sales. Receivables schemes involve write-off and lapping schemes. In write-off schemes an employee collects money for receivables but writes off the receivables instead of recognising them as paid. In lapping schemes an employee steals one client's payment and later covers it by paying their account with another client's payment. This type of fraud is difficult to perpetrate as it requires ongoing maintenance. Fraudulent disbursements are methods where the misappropriation of funds appears to be for legitimate business events. There are five groups under fraudulent disbursements i.e. billing schemes, payroll schemes, expense reimbursement schemes, and cheque tampering and register disbursements.
redirect the money back to oneself. Billing schemes may involve the use of a shell company (i.e. a company created for the sole purpose of committing fraud) which submits fictitious invoices for payment. The fraudster must be able to influence approval of vendors and invoices. Non-accomplice vendors may also be used by intercepting payments to them, intercepting refunds or by stealing legitimate payments made to them. Purchasing (credit) cards are another method for making personal purchases at the company's expense. Payroll schemes may involve ghost employees being entered into the system. This scheme is similar to shell vendors. Alternatively, employees may falsify the amount of hours they work or inflate the commission they should be paid for sales. Another method involves claiming compensation for fictitious injuries.
businesses such as retail, restaurants or bars where employees may void an order provide customers with ordered goods and keep monies for themselves.
Non-cash assets such as inventory and equipment may be misappropriated in a number of ways that can range from taking home a box of pens to theft of millions of dollars of property. Company assets may be misused ('borrowed') or stolen. Assets such as company vehicles, supplies, computers and other office equipment may be misused by employees to do personal work during company time. Costs of non-cash asset misuse are difficult to quantify. Company assets may also be stolen. Employees may create false documentation to ship company merchandise to personal addresses, or they may simple take company assets without trying to account for their absence.
2.1.2. Corruption
adversely affects an organisation, for example the employee has a stake in a company that his employer is transacting with possibly through a family relationship i.e. spouse, uncle, cousin, and so on.
2.1.3. Fraudulent financial statements
Financial statement fraud is the intentional misstatement or omission of material information from an organisation's financial statements with the intention of deceiving investors and creditors (ACFE 2010 ; Wells 2008). Common schemes involve recording of fictitious revenues, concealing liabilities or expenses and artificially inflating reported assets.
2.2. Occurrence and cost of fraud
The number and value of fraud incidents in Australia and New Zealand continues to increase significantly (ACFE 2010 ; KPMG 2008). Forty five percent of organisations experienced incidents of fraud between 2006 and 2008. The level of fraud suffered was higher in large organisations. Sixty-two percent of organisations with 1,000 to 10,000 employees experienced at least one fraud, while 89% of organisations employing more than 10,000 people experienced at least one fraud (KPMG 2008). The median loss suffered by organisations worldwide annually was $139,000 for organisations with 1,000 to 10,000 employees, and $164,000 for organisations with more than 10,000 employees. More than 40% of privately owned companies and more than 30% of publicly owned companies were victims of fraud (ACFE 2010).
Asset misappropriation is the most common type of fraud, occurring in more than 86% of all cases (ACFE 2010) (Table 2.1). The median loss from asset misappropriation was $135,000. (Note: the sum of percentages in Table 2.1 exceeds 100% because several cases involved schemes from more than one category).
Table 2.1: Categories of occupational fraud and abuse
Category % of all Cases Median Loss
Asset Misappropriation 86.3% $135,000
Corruption 32.8% $250,000
Fraudulent Statements 4.8% $4,100,000
Source: ACFE (2010)
cash in vault) were more frequently targeted (83.7%) than non-cash assets i.e. inventory, supplies, fixed assets, intellectual property, investments and proprietary information (16.3%)
Fraudsters use various schemes to misappropriate assets from their employees. The ACFE (2010) survey classified asset misappropriation into nine sub-categories i.e. cash larceny, skimming, billing, payroll, expense reimbursements, cheque tampering, cash register disbursements, cash on hand misappropriation and non-cash misappropriation. Of all cases reported in the United States of America, billing schemes occurred most frequently (26%).
Table 2.2: Sub-categories of asset misappropriation (US Data)
Category % of all Cases Median Loss
Billing 26.0% $128,000
Non-Cash Misappropriations 16.3% $90,000
Expense Reimbursements 15.1% $33,000
Skimming 14.5% $60,000
Cheque Tampering 13.4% $131,000
Cash on Hand Misappropriations 12.6% $23,000
Cash Larceny 9.8% $100,000
Payroll 8.5% $72,000
Cash Register Disbursements 3.0% $23,000
Source: ACFE (2010)
Table 2.3: Sub-categories of asset misappropriation (Oceania Data)
Category % of all Cases
Non-Cash Misappropriations 30.0%
Billing 27.5%
Cheque Tampering 17.5%
Skimming 12.%%
Expense Reimbursements 10.0% Cash on Hand Misappropriations 10.0%
Cash Larceny 7.5%
Payroll 5.0%
Cash Register Disbursements 2.5% Source: ACFE (2010)
The main factor that contributed to fraudulent activities in an organisation was a lack of internal controls (37.8%) e.g. poor segregation of duties. The second highest contributing factor was overriding existing internal controls (19.2%) (Table 2.4).
Table 2.4: Control weakness that contributed to fraud
Category % of all Cases
Lack of Internal Controls 37.8%
Override of Existing Internal Controls 19.2%
Lack of Management Review 17.9%
Poor Tone at the Top 8.4%
Lack of Competent Personnel in Oversight Roles 6.9% Lack of Independent Checks/Audits 5.6% Lack of Employee Fraud Education 1.9% Lack of Clear Lines of Authority 1.8%
Lack of Reporting Mechanism 0.6%
Source: ACFE (2010)
Position of Perpetrator
16.9%
41.0% 42.1%
0.0% 5.0% 10.0% 15.0% 20.0% 25.0% 30.0% 35.0% 40.0% 45.0% Owner Manager Employee P o s it ion
Percent of Cases
Figure 2.2: Position of fraud perpetrator
Source: ACFE (2010)
More than 80% of all frauds were committed by employees in six departments, namely accounting, operations, sales, executive/upper management, customer service and purchasing. The frauds in these six departments accounted for 95% of all losses (Figure 2.3).
Fraud Cases by Department
6.2% 7.2% 13.5% 13.5% 18.0% 22.0%
0.0% 5.0% 10.0% 15.0% 20.0% 25.0%
Purchasing Customer Service Sales Executive/Upper Management Operations Accounting D e p a rt m e nt
Percentage of Cases
Figure 2.3: Fraud cases based on perpetrator's department
Source: ACFE (2010)
Median Loss by Department
Executive/Upper Management, $829,000.00 Operations, $105,000.00
Accounting, $180,000.00
Purchasing, $500,000.00
Customer Service, $46,000.00
Sales, $95,000.00
Figure 2.4: Median loss by perpetrator's department
Source: ACFE (2010)
The most common fraud schemes perpetrated in the accounting department were cheque tampering (33.2%) and billing fraud (30.8%). In the operations department corruption (30.8%) and billing fraud (22.1%) were the top two schemes. In the sales department it was corruption (33.8%) and theft of non-cash assets (23.6%). Executives mostly engaged in corruption (48.7%), billing (40.6%) and expense reimbursement schemes (29.9%). Corruption (21.7%), skimming (19.2%), theft of cash on-hand (18.3%) and fraudulent register disbursements (8.3%) were the top ranked fraud schemes perpetrated by customer service employees.
internal controls. According to KPMG (2010), there was a 6% increase in poor internal controls as a contributing factor to fraud when compared to their previous fraud survey (KPMG 2008). Identifying the underlying reasons that motivate these individuals to deliberately violate their position of trust is essential in understanding the concept of fraud and its detection.
2.3. Motivation to commit fraud
Human needs can be satisfied by either honest or dishonest means. What is it that motivates an employee to choose dishonest methods to meet or satisfy their needs within an organisation? A factor in understanding human behaviour in organisations is why organisations exist in the first place.
Owners' abilities to effectively identify selfish and opportunistic behaviours by management are diminished because of information asymmetry i.e. the 'principal-agent' problem. Information asymmetry occurs as a result of agents (management) having more information about operational activities of an organisation than a principal (owner) (Fama and Jensen 1983 ; Jensen and Meckling 1976). Contractual relationships exist between principal and agent in an organisation (Adams 1994 ; Jensen and Meckling 1976). Both parties use this relationship to maximise their wealth. This means that agents with self-centred motives may violate their position of trust by acting against the interests of the principal (Adams 1994).
Behaviours of individuals in organisations are a set of complex social interactions which is explained by Frederick Herzberg's 'Theory of Motivation' (1959) and Abraham Maslow's 'Hierarchy of Needs' (1943). Herzberg's (1959) two factor theory (motivation-hygiene theory) examines factors that affect people's attitudes about work. Factors such as company policy, supervision, interpersonal relations, working conditions, and salary are hygiene factors i.e. factors that do not give positive satisfaction although their absence results in dissatisfaction. Conversely, motivators such as achievement, recognition, the work itself, responsibility, and advancement, determine job satisfaction. Some of his key findings were:
i). people become dissatisfied by a poor environment, but they are seldom satisfied by a good environment;
iii). hygiene factors operate independently of motivation factors; an individual could be highly motivated in his job yet dissatisfied with his work environment.
Maslow's (1954) 'Hierarchy of Needs'2 describes how people satisfy various personal needs within contexts of their jobs. There is a general pattern of needs recognition and satisfaction that people follow in the same sequence. A person cannot recognise or pursue the next higher need in the hierarchy until their current need is satisfied (Maslow 1943). Individuals in an organisation commonly have difficulty expressing what they want from their job. Employers may impose conditions that they believe to be in the best interests of employees (Green 2000), leading to dissatisfaction among employees They may seek relief and satisfy their needs by violating their position of trust and resorting to fraudulent behaviour.
Donald R. Cressy was interested in studying employees that violate their position of trust to satisfy to satisfy their needs. He was especially interested in identifying circumstances that led employees to be overcome by temptation. Cressey hypothesized that (Cressey 1953 p.30):
"Trusted persons become trust violators when they conceive of
themselves as having a financial problem which is
non-shareable, are aware this problem can be secretly resolved by
violation of the position of financial; trust, and are able to
apply to their own conduct in that situation verbalizations
which enable them to adjust their conceptions of themselves
2
as trusted persons with their conceptions of themselves as
users of entrusted funds or property."
Cressey's work provided valuable insight into why people commit fraud and it led to the development of the 'fraud triangle' (Figure 2.5) (Cressey 1950). The three key elements of the fraud triangle are pressure (an un-shareable need), rationalisation (of personal ethics), and opportunity (lack of adequate controls and knowledge to commit a fraud). All three elements must be present in order for a fraud to be perpetrated (Albrecht et al. 2008 ; Cressey 1950).
Pressure is related to an employee's perceived immediate need for an asset due mainly to financial difficulties. This causes a person to take significant risks in order to obtain the desired resource. While it is not within the scope of an auditor's responsibilities to resolve issues leading to pressures associated with fraud, it is important to bring these situations to management's attention if uncovered. It is a reasonable assumption that pressure is not a factor that can be captured in transaction data within an enterprise system. It tends to be more a human condition for organisational behaviour and psychology researchers to study.
Figure 2.5: Fraud triangle
Opportunities to commit fraud arise when an employee is in a position of trust, internal controls are weak or non-existent and when an employee has the applicable knowledge to commit a fraud. An employee perceives that an opportunity to commit fraud exists, commits it and conceals it. Good controls are important in limiting opportunities to commit fraud, but they are not fool proof. Flaws in internal controls provide opportunities for committing fraud however digital 'footprints' or 'signatures' of these activities are recorded in transaction data and audit trails within an enterprise system. These 'footprints' can be analysed in order to determine whether a fraud has potentially occurred. Interestingly, the ease with which a fraud can be perpetrated in a digital environment provides the tools to investigate and identify fraud i.e. computer technology.
Rationalisation or integrity is the third element of the fraud triangle. Individuals do not commit fraud unless it is consistent with their own personal code of ethics or belief. This limiting factor prevents most employees from committing fraud even though an opportunity may exist. When fraud is committed and detected most perpetrators rationalise their behaviour to match with their personal beliefs and/ or pressures they face. Again, this factor cannot be captured in transaction data within an enterprise system.
discussed i.e. organisational behaviour theory, theory of the firm, agency and contracting theory, purely inform the research in providing evidence for opportunities to commit fraud based on the fraud triangle theory. The concept of opportunity is the main factor of the fraud triangle theory that provides a basis for this research as this concept and its antecedent characteristics are identifiable in a digital environment. These characteristics can be used to proactively detect potential fraud in an enterprise system by analysis of its transaction data and audit trails.
Perpetrating a fraud requires more than just an awareness of the types of fraud that can occur in an organisation. Even though all of the conditions of the fraud triangle may support the occurrence of a fraud, explicit knowledge of how to perpetrate fraud is required. Understanding the way fraudsters think after taking the decision to perpetrate a fraud is essential in the design and development of an efficient and effective model for proactive detection of potential fraud.
2.4. Framework for perpetrating fraud