Evaluation of the Early Years
Sector-Endorsed Foundation Degree:
Statistical Profile of Students and Institutions
(Report of the Wave 2 Survey)
Dawn Snape, Emily Tanner, Helen MacKenzie
National Centre for Social Research
Evaluation of the Early Years
Sector-Endorsed Foundation Degree:
Statistical Profile of Students and Institutions
(Report of the Wave 2 Survey)
Dawn Snape, Emily Tanner, Helen MacKenzie
National Centre for Social Research
The views expressed in this report are the authors’ and do not necessarily reflect those of the Department for Education and Skills.
Acknowledgements
We are particularly grateful to the Course Co-ordinators who took time out of their busy schedules to fill in and return the questionnaires to us. We would also like to thank colleagues at NatCen who played an important role in the project, particularly Gursharanjit Gill who provided computing support and Sandra Laver and other members of the Pink Team in the Operations Department.
Contents
1 INTRODUCTION AND BACKGROUND ...7
1.1 Background and aims of the administrative database ...7
1.2 Research methods...7
1.3 The responding institutions...8
1.4 Subject coverage ...9
1.5 Guidance for interpretation...10
1.6 Structure of the report ...10
2 INSTITUTIONAL SETTINGS...12
2.1 Types of institutions offering the degree ...12
2.2 Proportions of lead HEIs and affiliated colleges offering the EYSEFD...12
2.3 Distribution of students across institutions...14
2.4 Number of institutions with no students during one or more intake period and reason why...14
2.5 When institutions first offered the degree...16
3 DEMOGRAPHIC CHARACTERISTICS OF CURRENT STUDENTS .18 3.1 Gender ...18
3.2 Ethnicity ...20
3.3 Disability and learning support needs ...20
4 DEMOGRAPHIC CHARACTERISTICS OF FORMER STUDENTS....22
4.1 Student retention, achievement and loss ...22
4.1.1 Reasons for leaving the course... 22
4.2 Characteristics of former students ...24
4.2.1 Gender of former students... 24
4.2.2 Age of former students... 25
4.2.3 Ethnicity of former students... 26
4.2.4 Learning support needs of former students... 27
5 MODE OF ATTENDANCE AND RECEIPT OF APL / APEL CREDIT.29 5.1 Percentages of current full-time and part-time students ...29
5.2 Receipt of APL and APEL credit ...31
5.2.1 Receipt of APL credit ... 32
5.2.2 Receipt of APEL credit... 33
6 ROUTES THROUGH THE DEGREE ...35
6.1 The routes offered by the institutions...35
6.1 Students following each route ...37
7 FINANCIAL ASSISTANCE FOR STUDENTS ...39
7.1 Receipt of fee waivers...39
7.2 Receipt of help with childcare costs...41
7.3 Financial support by type of institution...42
8 CONCLUSIONS ...45
8.1 Institutional settings ...45
Executive summary
Introduction and background
As part of the wider programme of research which comprises the evaluation of the introduction of the Early Years Sector-Endorsed Foundation Degree
(EYSEFD), the Department for Education and Skills (DfES) commissioned the National Centre for Social Research (NatCen) to compile an administrative database of statistical information. This involved the collection of aggregate statistical information on students taking the EYSEFD at all DfES recognised institutions and their affiliated partners during the first two academic years in which the course was run (2003/4 and 2004/5).
Key aims of the database were:
• to provide an updated source of statistical information about student
take-up of the EYSEFD, retention throughout the course and achievement of the Foundation Degree;
• to enable monitoring of student participation in the Foundation Degree
according to a variety of individual characteristics such as age, gender, ethnicity, disability and learning support needs; and
• to provide aggregate information about how the EYSEFD is being
delivered across institutions (e.g. types of institutions offering the Foundation Degree, proportions of institutions offering various ‘routes’ through the Foundation Degree).
This report provides the findings of the second annual administrative database data collection exercise. Data were collected from course co-ordinators via a postal survey which took place between April and June of 2005. The findings relate to students who began the course for the first time from September 2003 onwards.
The intention was that the administrative database would include all
institutions and their affiliated partners that had received DfES recognition by the end of February 2005. In the event, a response was obtained from 100 institutions, representing a response rate of 71%.
Among the responding institutions, a total of 2,590 students were enrolled and started the EYSEFD course between September 2003 and February 2005. According to DfES data, a total of 6,662 students are thought to have started the course during this period, suggesting that the database provides
Institutional settings
Two-thirds of responding institutions at Wave 2 are FE colleges (65%) while most of the remaining third are higher education institutions (34%). This was a similar picture to that obtained at Wave 1.
Also consistent with the Wave 1 profile of institutions is that 14% of institutions at Wave 2 are lead HEIs that confer the Foundation Degree but are not
directly involved in course delivery on site.
In terms of where students are based, just under two-thirds (63%) of all students who started the course at responding institutions between
September 2003 and February 2005 were based at FE colleges. Most of the remaining 37% were based at HE institutions, with 1% based at some other type of institution.
Three-quarters (74%) of responding institutions offered the course for the first time between September 2003 and February 2005, that is in the first two years since the course was widely introduced. The remaining 26% of the responding institutions first offered the course during the pre-pilot or pilot phases (from 2001 until the spring of 2003). This is different to the profile of institutions at Wave 1 in which the pilot and pre-pilot institutions constituted a much larger proportion of responding institutions (41%). The implication of this is that the Wave 2 responding institutions include more of those that have fairly recently started the course and fewer institutions with longer term
experience of delivering it.
Across each intake period in the two academic years of 2003-4 and 2004-5, many more students started the course in the autumn rather than the spring intake periods.
Just over half (54%) of students at responding institutions started the course in 2003-4 while the remaining 46% began the course in 2004-5.
Demographic characteristics of all students
Similar to the findings at Wave 1, students at responding institutions at Wave 2 were almost exclusively female (99%).
Overall, the age profile of students who have started the EYSEFD course at responding institutions was normally distributed around the most common age group of 36-40 years. This was similar to the findings at Wave 1.
less likely to be in the oldest age group than those who started the course in 2003-4.
Over nine-tenths of students at responding institutions were White (91%). This is a broadly similar picture to that obtained at Wave 1.
Overall, the number of students identified as having learning support needs among responding institutions at Wave 2 was small (3%). This was a similar proportion to that reported at Wave 1. Also similar to Wave 1 is that students most commonly required learning support because of ‘learning difficulties’ such as dyslexia.
Demographic characteristics of former students
Overall, approximately 16% of students who started the course at responding institutions between September 2003 and February 2005 had left the course by the time of the survey. Of these, nearly four-fifths (79%) were described as taking a ‘temporary break’ from the course and were expected to return to it at some future point. Most of the remaining fifth (17%) had completed the
course already and only a small proportion (4%) were described as having left the course without finishing it (and are not expected to return to it).
There were no notable findings in relation to the ages of former students except that those in their early twenties were most likely to leave the course and those aged 51 and older were least likely to do so.
The ethnicity of those who left the course at Wave 2 is similar to the ethnic profile of all those starting the course during the reference period at
responding institutions. The base sizes of students from minority ethnic groups are too small to enable meaningful sub-group analysis.
Those with learning support needs did not appear to be more likely than students without learning support needs to leave the course, but the base size of former students with learning support needs was very small.
Mode of attendance and receipt of APL/ APEL
Among the responding institutions, just over two-thirds (69%) of students were registered part-time, while just under a third (31%) were registered full-time. These proportions are quite different to the Wave 1 findings in which 82% of students were registered part-time and 18% full-time. This suggests that it may be becoming more common for students to take-up the course on a full-time basis.
Only a small minority (4%) of students at responding institutions received either APL or APEL credit towards the course in the two academic years covered by the Wave 2 survey. Most of those receiving this type of credit were based at higher education institutions rather than FE colleges.
Routes through the Foundation Degree
Responding institutions at Wave 2 offered a broader range of routes through the EYSEFD course than was the case among the Wave 1 institutions. Particularly notable was the increased number of institutions offering the playwork option (75% of institutions offered this at Wave 2 compared to only 22% of the Wave 1 institutions). The most frequently offered course route was the general Senior Practitioner (Foundation Stage) route, offered by 82% of the Wave 2 institutions, but all routes were offered by at least
three-quarters of the Wave 2 institutions.
Take-up of the playwork option was extremely low among responding institutions with less than 1% of students following this route.
Financial assistance for students
A small minority of students (4%) at responding institutions were reported to have received help with childcare costs. This was a similar picture to Wave1.
There has been a notable decline in the proportion of students receiving fee waivers from 82% of students in 2003-4 to 32% in 2004-5. This decline can largely be accounted for by the changing role of DfES as a provider of financial support.
1 INTRODUCTION AND BACKGROUND
1.1 Background and aims of the administrative database
As part of the wider programme of research which comprises the evaluation of the introduction of the Early Years Sector-Endorsed Foundation Degree
(EYSEFD), the Department for Education and Skills (DfES) commissioned the National Centre for Social Research (NatCen) to compile an administrative database of statistical information. This involved the collection of aggregate statistical information on students taking the EYSEFD at all DfES recognised institutions and their affiliated partners during the first two academic years in which the course was run (2003/4 and 2004/5).
A key aim of the database was to provide an updated source of statistical information about student take-up of the EYSEFD, retention throughout the course and achievement of the Foundation Degree.
The database also provides the opportunity to monitor student participation in the Foundation Degree according to a variety of individual characteristics such as age, gender, ethnicity, disability and learning support needs. Data have also been collected on student receipt of various types of assistance, both from the DfES and other sources.
Finally, the database provides aggregate information about how the EYSEFD is being delivered across institutions (e.g. types of institutions offering the Foundation Degree, proportions of institutions offering various ‘routes’ through the Foundation Degree).
1.2 Research methods
This report provides the findings of the second annual administrative database data collection exercise. Data were collected from course co-ordinators via a postal survey which took place between April and June of 2005. Course co-ordinators at each institution were asked to complete and return the questionnaire focusing only on students based at their institution for teaching purposes. This was done in order to minimise the potential of ‘double counting’ students who, for example, are registered at a lead institution that confers the Foundation Degree but are regularly based at a local affiliate college for teaching purposes. An explanatory letter
accompanying the questionnaire asked course co-ordinators to consult with other colleagues (such as a registrar) if they did not have access to all the student information required to complete the questionnaire. In order to
The findings reported here relate to students who began the course for the first time from September 2003 onwards. Data have been collected for each intake of students who began the course since that point, providing
information on students who began the course in four separate cohorts (i.e., autumn 2003, spring 2004, autumn 2005, spring 2005). To provide a clear picture of trends over time, the findings are reported in terms of students starting the course in each academic year (i.e. 2003-4 and 2004-5).
Finally, although the first administrative database survey provided findings relating to the autumn 2003 intake period, data from this cohort was obtained again during this second annual survey. The findings reported here relate to the 2003-4 academic year overall (including both the autumn and spring intakes) and are based upon data provided in this year’s survey.
Discrepancies between the picture obtained of the autumn 2003 intake from last year’s survey and this year’s may therefore arise because: (1) the spring 2004 intake period is also included in the 2003-4 academic year figures, unlike last year’s survey which related only to the autumn 2003 intake, or (2) course co-ordinators have provided figures of the autumn 2003 intake this year which vary slightly from those they provided last year.
1.3 The responding institutions
The intention was that the administrative database would include all
institutions and their affiliated partners that had received DfES recognition by the end of February 2005. Questionnaires were therefore sent to 1461 institutions but completed questionnaires were received from only 100. Among these were two institutions that submitted forms including figures of students based at ‘satellite institutions’. In these cases, the satellite
institutions provide a venue only with no administrative support for the
EYSEFD on site and no teachers permanently based there. Therefore, while completed questionnaires were returned by 100 institutions, the figures reported refer to students based at 103 separate sites for teaching purposes.
This represents a response rate of 71%. Among the responding institutions, a total of 2,590 students were enrolled and started the EYSEFD course
between September 2003 and February 2005. According to the data on profiled student enrolment collected by the DfES a total of 6,662 students are thought to have started the course during this time period. The database therefore provides information on 39% of students who began the course between September 2003 and February 2005 (inclusive).2
1 Questionnaires were sent originally to 147 institutions, but one of these had not received DfES
recognition and should not therefore have been included in the data collection exercise. The overall response rate should therefore be calculated on a base of 146 institutions.
2 The database does not include students undertaking the course at the Open University as there were
1.4 Subject coverage
Similar to the first questionnaire, the second annual administrative database survey included questions about the students themselves as well as the responding institution. The following subjects were included:
• Total number of students based at the institution who started the course in:
- September-October 2003
- January-February 2004
- September- October 2004
- January- February 2005
• If no students were recorded as having started during any intake period,
reasons for this
• Total number of students starting during each intake period who were still
on the course at the time of the survey
• Number of students who left the course for various reasons, according to
intake period
• Characteristics of students who started the course and of those who left
the course according to intake period, focusing on:
- Gender
- Ethnicity
- Age
- Learning support needs
• Number of current students registered as full or part-time students, by
intake period
• Course routes (i.e. early years birth to 3, early years foundation stage,
teaching assistants, playwork) offered at the institution
• Number of full-time and part-time students following each route
• Number of students receiving APL and APEL credit towards the
Foundation Degree, according to intake period.
• Financial and other assistance for students, according to intake period
- Number of full-time and part-time students receiving fee waivers from the DfES or another source
• Number of full and part-time students receiving assistance with childcare
costs from the DfES or another source
- Whether institution confers the Foundation Degree and if not, the institution through which the Foundation Degree is conferred
- When the EYSEFD was first offered at the institution
- When regular student intake is planned
• Respondent’s contact information (for follow-up purposes).
1.5 Guidance for interpretation
The percentages presented in the tables have been calculated from the responding bases. Base sizes and descriptions are shown at the bottom of the table, along with any notes appropriate for guiding interpretation.
Institutions with missing data because respondents did not answer a question have been excluded from the calculations, unless stated otherwise.
Due to rounding, percentage figures may not add up to exactly 100%, but may total between 98% and 102%.
In some tables, particularly where base sizes are small, the number of cases to which percentages relate is provided in parentheses next to the percentage in order to aid interpretation.
The following symbols have been used in the tables:
* to indicate a percentage value of less than 0.5%
- to indicate a percentage value of zero
1.6 Structure of the report
The report has eight chapters. Chapter 2 focuses on the institutional settings where the EYSEFD is offered. It explores the proportion of lead institutions and affiliated partners and the different types of institutions offering the Foundation Degree. The distribution of students across institutions is also considered as is the length of time institutions have been offering the EYSEFD.
Chapter 3 explores the characteristics of students who began the Foundation Degree during the two academic years covered in the survey (i.e. 2003-4 and 2004-5). It focuses on a range of demographic characteristics to provide an aggregate profile of students from these cohorts who enrolled on the course. Chapter 4 goes on to consider the demographic characteristics of those
students who have left the course and highlights any implications the profile of leavers may have for student retention.
Chapter 5 focuses on mode of student attendance, both in terms of the
Chapter 6 presents the findings about routes available through the EYSEFD. It considers both the number of institutions offering each different route and the numbers of full and part-time students taking each route.
Chapter 7 looks at financial assistance received by students in the form of fee waivers and help with childcare costs. For all students, the source of the assistance is specifically explored, particularly the extent to which students received help from the DfES versus other sources.
2 INSTITUTIONAL SETTINGS
This chapter focuses on the institutional settings where the EYSEFD is
offered and the distribution of students at different types of institutions. Of the 146 recognised institutions that were sent a questionnaire, 100 completed and returned the statistical profile forms.
2.1 Types of institutions offering the degree
As Table 2.1 shows, two-thirds (65%) of responding institutions are further education colleges. Most of the remaining third are higher education
institutions – universities (22%), university colleges (6%) or higher education colleges (6%). This is virtually unchanged from the Wave 1 administrative database findings.
Table 2.1 Types of institutions offering the EYSEFD
Type of institution Proportion of
institutions
% College of further education 65
University 22
University college 6 College of higher education 6
Other 1
Base 100
Base: All responding institutions
2.2 Proportions of lead HEIs and affiliated colleges offering the EYSEFD
Table 2.2 shows that half of the responding institutions conferred the
Table 2.2 Institutions conferring the EYSEFD
Whether institution confers the Foundation Degree
% Yes, confers the Foundation Degree 50 No, does not confer the Foundation Degree 50
Base 100
Base: All responding institutions
Fourteen per cent of the responding institutions at Wave 2 (or 14 institutions) are lead HEIs which confer the Foundation Degree for partner colleges but which are not directly involved in course delivery. Again, this is similar to the profile of institutions obtained at Wave 1 (15% of responding institutions at Wave 1 were lead HEIs with no teaching on site – equivalent to 17
institutions).
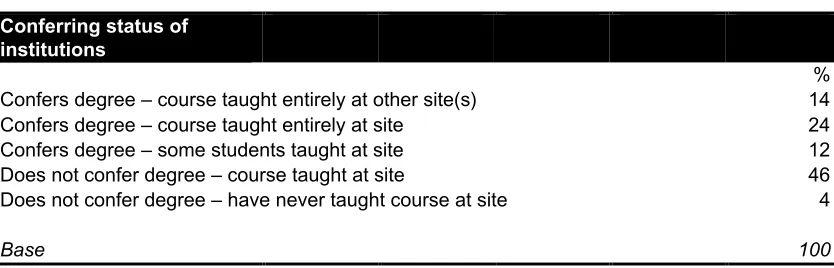
Table 2.3 gives an overview of the responding institutions according to whether they conferred the EYSEFD and taught it on site. This shows that the most common arrangement among responding institutions was that which would be associated with partner colleges, that is delivering the course on site, but not conferring the Foundation Degree (46%).
About a quarter of the responding institutions (24%) conferred the Foundation Degree and taught the course entirely at their site and a further 12% of
[image:18.595.90.507.588.722.2]institutions conferred the degree and taught some students on site. As noted above, 14% were lead HEIs only – that is, they conferred the Foundation Degree for partner colleges but were not directly involved in course delivery. The remaining 4% did not confer the EYSEFD and had never taught the course at their institution. These are likely to be partner colleges that have not yet had any student intake.
Table 2.3 Conferring and teaching status of institutions
Conferring status of institutions
% Confers degree – course taught entirely at other site(s) 14 Confers degree – course taught entirely at site 24 Confers degree – some students taught at site
Does not confer degree – course taught at site
12 46 Does not confer degree – have never taught course at site 4
Base 100
2.3 Distribution of students across institutions
Just over half (52%) of all students who started the EYSEFD course between September 2003 and February 2005 at responding institutions were based at lead HEIs while the remaining 48% were based at affiliated colleges.
Focusing only on those students who were still on the course at the time of the survey, 51% attended a lead HEI and 49% attended an affiliated college.
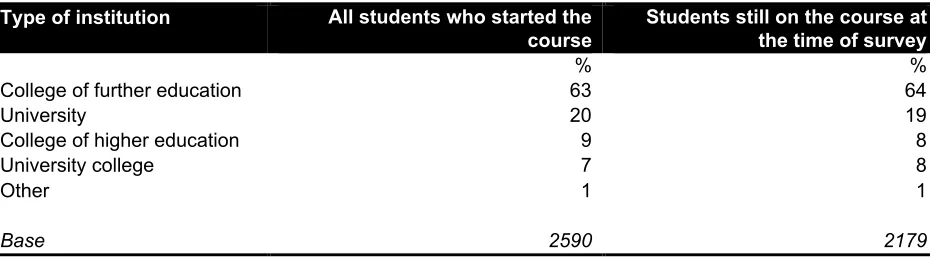
[image:19.595.90.555.397.526.2]In terms of the types of institutions where students were based, Table 2.4 shows that students most commonly attended a further education college with just under two-thirds (63%) of all students who started the EYSEFD between September 2003 and February 2005 based at FE colleges. The remaining 37% attended Higher Education institutions – universities (20%), university colleges (7%), or higher education colleges (9%), or other types of institutions (1%). Comparing these findings to those in the second column of Table 2.4, which focuses only on current students at the time of the survey, there are no notable differences to observe in terms of where current students were based. This suggests that students did not tend to leave the course more if they were based at particular types of institutions.
Table 2.4 Proportions of EYSEFD students based at different types of institutions
Type of institution All students who started the course
Students still on the course at the time of survey
% %
College of further education 63 64
University 20 19
College of higher education 9 8
University college 7 8
Other 1 1
Base 2590 2179
Base: All students at responding institutions
2.4 Number of institutions with no students during one or more intake period and reason why
The EYSEFD was piloted in 2001 and 2002 with the first post-pilot intake in the autumn of 2003. The survey covered two possible student intake periods per academic year since the autumn of 2003 (i.e. September-October and January-February) and asked whether there was any student intake during each of these periods. Institutions recording no student intake during one of the four periods3 were asked to state why this was the case.
3Period 1: September-October 2003; Period 2: January-February 2004; Period 3: September-October
Of the 100 institutions that returned completed questionnaires, 78 reported having no student intake for at least one of the two enrolment periods in 2003-4 and 76 reported no student intake for at least one of the two enrolment periods in 2004-5. Just under three quarters (74%) of the institutions reporting no students during one or more intake period in the academic year 2003-4 attributed this to the fact that there were simply no students (Table 2.5). For the remaining 26%, the reason for no students was that the course was not yet running. As might be expected, in the following academic year (2004-5), there were fewer institutions reporting that the course was not yet running. For nearly all the institutions reporting no
students during one or more intake period (93%), the reason given was that there were simply no students.
Table 2.5 Reasons for no EYSEFD students during one or more intake period
Reason 2003-4 2004-5)
% (n) % (n)
The course was not running yet 26 (20) 7 (5)
No student intake during this period 74 (58) 93 (71)
Base 78 76
Base: All responding institutions with no students during one or more intake period between September 2003 and February 2005.
Table 2.6 provides an overview of student intake patterns across the
responding institutions. The table includes data from the 82 institutions where the degree is taught on site and which may have had a student intake during each of the relevant periods. Not included in this table are the 14 institutions that are lead HEIs only (i.e. that confer the Foundation Degree on behalf of other institutions but do not deliver the course on site) and a further four institutions that have never yet taught the degree on site and do not confer it (i.e. affiliated colleges that had not yet run the course by the time of the survey).
Table 2.6 Institutional student intake, by intake period Sept/Oct 2003 Jan/Feb 2004 Sept/Oct 2004 Jan/Feb 2005
% (n) % (n) % (n) % (n) Student intake recorded 70 (57) 12 (10) 83 (68) 13 (11)
No student intake 31 (25) 88 (72) 17 (14) 87 (71)
Base 82 82 82 82
Base: All responding institutions where the course is taught on site (82).
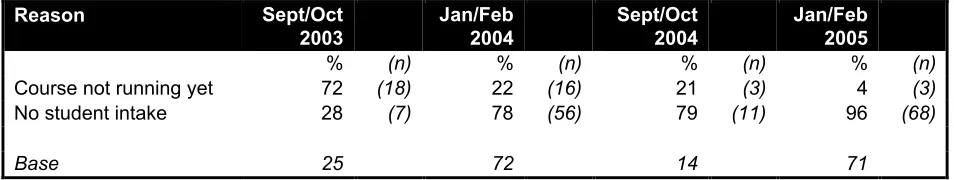
Table 2.7 shows the reasons why institutions recorded no students during each intake period. Looking at the first row of the table, it is clear that among responding institutions, the actual number of institutions indicating that the course is not yet running is declining. This is to be expected given that the course is becoming more established over time and an increasing number of institutions are offering and delivering it on site.
[image:21.595.83.560.491.581.2]The second row of the table again reflects the popularity of the autumn intake period, with many more institutions having no student intake in the spring than in the autumn. However, it is unclear from this data whether a lack of student intake is due to a lack of interest on the part of prospective students in starting the course in the spring or whether it is a function of institutions being less inclined to offer a spring course start as an option.
Table 2.7 Reason for institutions recording no students, by intake period
Reason Sept/Oct 2003 Jan/Feb 2004 Sept/Oct 2004 Jan/Feb 2005
% (n) % (n) % (n) % (n)
Course not running yet 72 (18) 22 (16) 21 (3) 4 (3)
No student intake 28 (7) 78 (56) 79 (11) 96 (68)
Base 25 72 14 71
Base: All responding institutions in each cohort that recorded no students starting the course during that period
2.5 When institutions first offered the degree
Almost three-quarters (74% or 60 institutions) of the responding institutions that deliver the Foundation Degree on site first offered the EYSEFD course between the autumn of 2003 and the spring of 2005 (53% in 2003-4 and 21% in 2004-5). The remaining 26% (21 institutions) offered the degree for the first time between the autumn of 2001 and the spring of 2003, that is during the pre-pilot or pilot phases.
Date EYSEFD first offered Proportion of institutions
%
Autumn 2001 6
Spring 2002 1
Autumn 2002 11
Spring 2003 7
Autumn 2003 49
Spring 2004 4
Autumn 2004 19
Spring 2005 2
Base 81
Base: All responding institutions where the course is delivered on site. Note: This information was not provided by 1 institution which has been
3 DEMOGRAPHIC CHARACTERISTICS OF CURRENT
STUDENTS
This chapter describes the demographic characteristics of students who started the EYSEFD course at responding institutions between the autumn of 2003 and the spring of 2005. The demographic information is broken down by intake period in order to illuminate any patterns in take up of the course during the first two (post-pilot) years in which it has run.
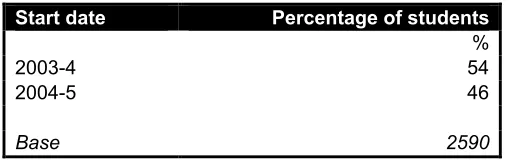
[image:23.595.88.349.344.425.2]As of spring 2005, two and a half thousand students had commenced the EYSEFD course at the responding institutions, most of them beginning in the autumn terms. There has been a slight decrease in enrolment numbers at the responding institutions over these two academic years, from 1,396 in the 2003-4 academic year to 1,194 in 2004-5.
Table 3.1 Percentage of students by year of intake
Start date Percentage of students
%
2003-4 54
2004-5 46
Base 2590
Base: All students starting the course at responding institutions
3.1 Gender
Women constituted the vast majority of the students at responding institutions. There has been no change in the proportion of men joining the course during the two academic years covered by the survey.
Table 3.2 Gender of students by year of intake
2003-4 2004-5
% (n) % (n)
Females 99 (1383) 99 (1180)
Males 1 (13) 1 (14)
Base 1396 1194
Base: All students listed by responding institutions
practical work experience in anearly years education or childcare setting. The distribution also tailed off at the upper end, with 6% of students aged 46-50 and 3% aged 51 or older.
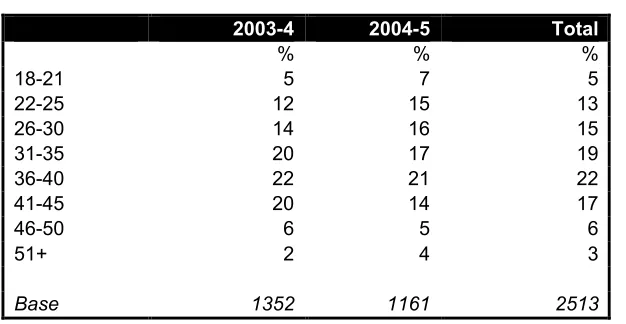
[image:24.595.83.396.332.494.2]Comparing the ages of students who began the course in 2003-4 and in 2004-5 (Table 3.3), those starting in 2004-2004-5 were more likely to be in the younger age groups than those starting in 2003-4. For example, 17% of those starting the course in 2003-4 at responding institutions were aged 25 or younger compared to 22% of those starting in 2004-5. A similar difference appears at the older end of the age spectrum as well where 28% of those starting the course in 2003-4 were aged 41 or older compared to 23% of those starting in 2004-5. Both of these differences were statistically significant, possibly suggesting that the most experienced early years practitioners were among the first cohort of students while subsequent cohorts may increasingly attract practitioners who are younger and perhaps less senior in their workplaces.
Table 3.3 Age of students by start date
2003-4 2004-5 Total
% % %
18-21 5 7 5
22-25 12 15 13
26-30 14 16 15
31-35 20 17 19
36-40 22 21 22
41-45 20 14 17
46-50 6 5 6
51+ 2 4 3
Base 1352 1161 2513
Figure 3.1 Age distribution of EYSEFD students
Base: All students that started the course between September 2003
and February 2005 at responding institutions which also provided data on student ages (2,513).
3.2 Ethnicity
The overwhelming majority of the students (91%) at responding institutions were White. Of the remaining 9%, 4% were Asian, 2% were Black and the remainder were of mixed or other ethnicity4.
Table 3.4 Ethnicity of students by start date
2003-4 2004-5
% (n) % (n)
White 93 (1295) 90 (1063)
Black 2 (31) 2 (29)
Asian 3 (41) 5 (61)
Mixed 1 (12) 1 (11)
Other 1 (17) 2 (18)
Declined * (1) - (0)
Base 1397 1183
Base: All students starting at responding institutions between September 2003 and February 2005 and for whom ethnicity information was provided (2,580).
3.3 Disability and learning support needs
The survey also collected information about the number of students requiring learning support because of a physical illness or disability or learning
difficulties (such as dyslexia) or both. Overall, the number of students
4 Information about ethnicity was not provided for 11 students (0.4% of the total).
5
13 15 19
22
17
6 3
0 5 10 15 20 25
18-21 22-25 26-30 31-35 36-40 41-45 46-50 51+
[image:25.595.83.438.469.602.2]identified as having learning support needs among the responding institutions was small (3%).
Most commonly, students required learning support because of ‘learning difficulties’. This was the case both among those who started the course in 2003-4 and in 2004-5. A higher proportion of students in 2004-5 were identified as having learning support needs related to a physical illness or disability than among those who started the course in 2003-4. However, as the base sizes are very small a doubling in the proportion of students
identified as having a physical illness or disability between the two intake years still only equates to a small number of individuals (15 students in 2004-5 compared to 6 in 2003-4).
Table 3.5 Number of students requiring learning support by intake year
2003-4 2004-5
% (n) % (n)
Physical illness/disability 19 (6) 38 (15)
Learning difficulties 75 (24) 60 (24)
Both 6 (2) 3 (1)
Base 32 40
4 DEMOGRAPHIC CHARACTERISTICS OF FORMER
STUDENTS
The previous chapter described the characteristics of students starting the EYSEFD course at responding institutions. This chapter moves on to addresses the issue of retention and loss, by exploring the demographic characteristics of students who have left the course. Throughout this chapter, analysis focuses on all students who have left the course as the data does not allow for differentiation between those who left the course early and those who may have completed the course.
4.1 Student retention, achievement and loss
Table 4.1 shows the proportion of students who started the course in each intake period at responding institutions who were still on the course at the time of data collection (i.e. spring of 2005). As would be expected, the retention rate increases in accordance with the start date. Therefore those students who began the course most recently (in 2004-5) are most likely to still be on the course (89% of those who started in 2004-5 compared to 80% of those who started in 2003-4). A fifth of those who started the course in 2003-4 at responding institutions were no longer on the course by the spring of 2005.
Table 4.1 Number of students leaving the course by intake period
2003-4 2004-5 Total
% % %
Students still on course 80 89 84 Students who have left course 20 11 16
Base 1396 1194 2590
Base: All students starting the course between September 2003 and February 2005 at responding institutions (2,590).
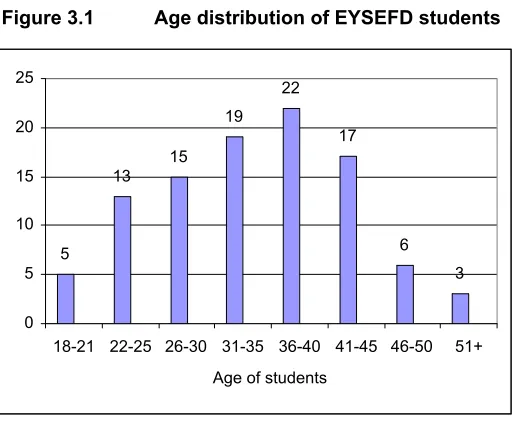
4.1.1 Reasons for leaving the course
In order to understand the rate of retention, it is important to consider the different reasons why students have left the course. The survey asked for information about how many students who started during each intake period had left the course because: (1) they had completed it; (2) they had left without completing it (and were not expected to return); or (3) they had taken a temporary break from the course (and were expected to return). The
answers to this question indicated that a total of 4145 students had left the
5Responses to this question indicated that 414 students left the course for one of the reasons given.
course by the spring of 2005, representing 16% of all thosewho had started the course at responding institutions between the autumn of 2003 and spring of 2005. Figure 4.1 shows the proportions of students who left the course for each of the reasons outlined.
Figure 4.1 Reasons for leaving the course
Base: All students leaving the course between September 2003 and February 2005 at responding institutions (414).
Most commonly, students who had left the course were recorded as taking a temporary break from it and were expected to return (79% of all those who left the course; 80% of those who have left from the 2003-4 intake and 75% of those who have left from the 2004-5 intake, as shown in Table 4.2).
A total of eighteen students who started the course at responding institutions were described as leaving the course without completing it and they were not expected to return (6% of those who started with the 2003-4 intake and had subsequently left). This constitutes 4% of all those who left the course and 1% of the total student intake at responding institutions between September 2003 and February 2005.
Finally, those who had already completed the course accounted for 17% of all leavers at responding institutions. In terms of intake year, 13% of those who had left from the 2003-4 intake had completed the course and (somewhat unexpectedly) 25% of those who had left from the 2004-5 intake had
completed the course. The latter suggests that some students are completing the course in a year or less. Overall, about 3% of those who started the course between September 2003 and February 2005 at responding institutions had completed it by the spring of 2005.
The responses to this question indicate that 436 of those who started the course between September 2003 and February 2005 had left the course by the spring of 2005 (or 17% of all those who started the
4%
79% 17%
didn't complete course
temporary break
These early data look promising in terms of retention to the course, but it is unclear whether those who have taken a break from the course will in fact return to it. At one extreme, if none of these students returned to the course, then the rate of student loss from the course would be approximately 13% of the overall intake among the responding institutions. At the other extreme, if all of these students returned to the course, then the rate of loss could be very small indeed (less than 1%). It is likely that the actual rate of loss will lie somewhere in between these two figures, but this implies that the student retention rate will be fairly high.
Table 4.2 Reasons for leaving the course, by intake year
2003-4 2004-5
% (n) % (n)
Left without completing course 6 (18) - (0)
Temporary break 80 (227) 75 (98)
Completed the course 13 (38) 25 (33)
Base 283 131
Base: All students leaving the course between September 2003 and February 2005 at responding institutions (414).
4.2 Characteristics of former students
The following tables describe the demographic characteristics of the students who have left the course at responding institutions (including those who have completed the course). The data about course leavers are presented in two ways for each type of demographic characteristic. First, the total of leavers is broken down to show the proportions in each category (e.g. the proportion of leavers who are male and female). This approach informs us about the characteristics of leavers but does not take into account the profile of those starting the course. Therefore, the second approach is to show what proportion of students enrolling in each category left the course (e.g. what proportion of females and males starting the course have since left). This second approach provides a better indication of whether students with particular characteristics were more or less likely than others to leave the course.
4.2.1 Gender of former students
A far greater proportion of those leaving the course were females than males (Table 4.3) which simply reflects the high proportion of women among
problems are greater for male students, but student-level data is required to explore this type of issue.
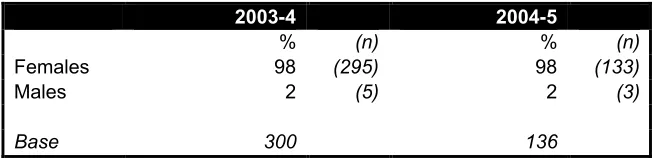
Table 4.3 Gender of former students
2003-4 2004-5
% (n) % (n)
Females 98 (295) 98 (133)
Males 2 (5) 2 (3)
Base 300 136
Base: All leaving students at responding institutions who started the course between September 2003 and February 2005 and had left it by Spring of 2005 (436).
Table 4.4 Comparing course status by gender
Females Males
% (n) % (n)
Still on course 83 (2135) 70 (19)
Left course 17 (428) 30 (8)
Base 2563 27
Base: All students leaving responding institutions who started the course between September 2003 and February 2005 and left it by Spring of 2005 (436).
4.2.2 Age of former students
Table 4.5 provides an overview of the age profile of students who have left the course at responding institutions. Caution needs to be exercised in
Table 4.5 Age of former students
2003-4 2004-5
% (n) % (n)
18-21 5 (13) 5 (7)
22-25 13 (33) 23 (32)
26-30 16 (39) 12 (17)
31-35 18 (46) 18 (25)
36-40 19 (48) 17 (24)
41-45 21 (52) 19 (26)
46-50 6 (14) 3 (4)
51+ 2 (5) 3 (4)
Base 250 139
Base: All students leaving responding institutions who started the course between September 2003 and February 2005 and left
it by Spring of 2005 and for whom age information was provided (389).
A different way to examine the age data is to determine what proportion of those enrolled in each category left the course (Table 4.6). The age group with the highest proportion of leavers was those in their early twenties and the group with the smallest proportion of leavers was those aged 51 and over. However, from the data it is not possible to determine for each age category whether people left because they finished the course, took a break or left without completing and therefore, conclusions cannot be drawn about retention rates by age.
Table 4.6 Comparing course status by age group
18-21 22-25 26-30 31-35 36-40 41-45 46-50 51+
% % % % % % % %
Still on course 86 80 85 85 87 82 88 88
Left course 15 20 15 15 13 18 13 12
Base 138 332 367 467 551 439 144 75
Base: All students starting the course at responding institutions between September 2003 and February 2005 and for whom age information was provided (2,513).
Note: Percentages may total more than 100 due to rounding.
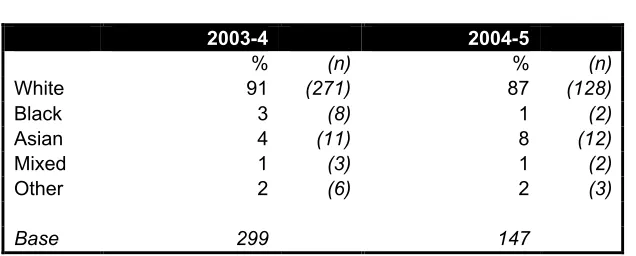
4.2.3 Ethnicity of former students
slightly higher proportion of students in the other ethnic categories left the course, but again caution needs to be exercised in interpreting small numbers.
Table 4.7 Ethnicity of former students
2003-4 2004-5
% (n) % (n)
White 91 (271) 87 (128)
Black 3 (8) 1 (2)
Asian 4 (11) 8 (12)
Mixed 1 (3) 1 (2)
Other 2 (6) 2 (3)
Base 299 147
[image:32.595.83.401.159.287.2]Base: All students leaving responding institutions who started the course between September 2003 and February 2005 and left it by Spring of 2005 and for whom ethnicity information was provided (446).
Table 4.8 Comparing course status by ethnicity
White Black Asian Mixed Other
% (n) % (n) % (n) % (n) % (n)
Still on course 83 (1959) 83 (50) 77 (79) 78 (18) 74 (26)
Left course 17 (399) 17 (10) 23 (23) 22 (5) 26 (9)
Base 2358 60 102 23 35
Base: All students at responding institutions who started the course between September 2003 and February 2005 and for whom information on ethnicity was provided (2,578).
4.2.4 Learning support needs of former students
Table 4.9 Breakdown of course leavers by learning support needs
2003-4 2004-5
(n) (n) Physical illness/disability 2 1 Learning difficulties 5 2
Both 0 0
Base 7 3
[image:33.595.87.412.129.219.2]Base: All leaving students with learning support needs listed by responding institutions
Table 4.10 Comparison of course status by learning support needs
Physical
illness/disability
Learning difficulties Both
(n) (n) (n) Still on course 18 41 3
Left course 3 7 0
Base 21 48 3
5 MODE OF ATTENDANCE AND RECEIPT OF APL / APEL
CREDIT
This chapter focuses on the proportions of students taking up full and part-time study modes and compares the proportions taking up each mode at each institution type. This chapter also reports on the proportions of students who received accreditation of prior learning (APL) or accreditation of prior
experiential learning (APEL) towards the EYSEFD.
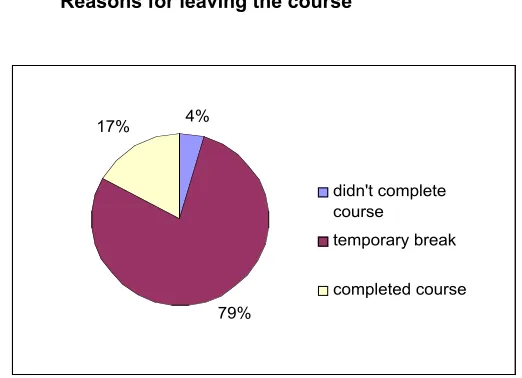
5.1 Percentages of current full-time and part-time students
Among the responding institutions, the part-time mode of attendance for the EYSEFD course was more common than the full-time mode. This is
[image:34.595.133.395.372.550.2]illustrated by Figure 5.1 which shows that just over two-thirds (69%) of students were registered for the EYSEFD course on a part-time basis, while just under a third (31%) were registered as full-time students.
Figure 5.1 Proportions of full-time and part-time students
Base: All students still on the course in spring of 2005 at responding institutions (2,179).
There is little variation in the proportions of full and part-time students
between each of the two academic years (2003-4 and 2004-5) although there was a slight increase in the number of full-time students and a slight decrease in the number of part-time students in 2004-5 (Table 5.1).
Full-time 31%
Table 5.1 Proportions of institutions with full-time students and part-time students, overall and by intake year
Mode of attendance 2003-4 2004-5 Total
% % %
Full-time 29 33 31
Part-time 71 66 68
Base 100 100 100
Base: All responding institutions
[image:35.595.90.540.425.554.2]Having ascertained that there are far more part-time than full-time students overall, it is important to establish at what types of institutions students are enrolled. The majority of both full-time and part-time students were studying at colleges of further education. Only 16% of full-time students were studying at higher education institutions (including universities, university colleges and colleges of higher education), while there was a more even spread for the part-time students (Table 5.2). Just over half (54%) of part-time students were based at further education colleges and most of the remainder are based at one of the three types of higher education institutions (44%).
Table 5.2 Proportions of full and part-time students, by type of institution
Type of institution Full-time
students
Part-time students
% (n) % (n)
University 7 (47) 25 (373)
University college 3 (18) 10 (153)
College of higher education 6 (39) 9 (139)
College of further education 85 (572) 54 (801)
Other - (0) 2 (23)
Base 676 1489
Base: All students at responding institutions (2,165).
Table 5.3 Proportions of full and part-time students, by type of institution and intake year
2003-4 2004-5
Type of institution Full-time
students
Part-time students
Full-time students
Part-time students
% % % %
University 12 24 2 26
University college 0 8 5 13 College of higher education 5 11 6 8 College of further education 83 56 86 52
Other 0 1 0 2
Base 326 792 350 697
Base: All students who started the course at responding institutions between September 2003 and February 2005 and who were still on the course in Spring 2005 (2,165).6
5.2 Receipt of APL and APEL credit
One of the key aspects of the design of the EYSEFD was that students could be accredited for prior learning as well as prior experiential learning. This was detailed in the Statement of Requirement, the DfES guidance issued to
institutions for use when designing the EYSEFD. Through accreditation of prior learning (APL) students have the opportunity to gain credits for courses taken in the past whereas APEL credit may be awarded for prior practical experience of relevance to the course.
Overall a very small minority of students at responding institutions had received APL credit or APEL credit in the two academic years between 2003 and 2005. Together, only 4% of students received APL or APEL credit. Figure 5.2 illustrates that 3% of students had received APL credit, and only 1% had received APEL credit at responding institutions.
6 Institutions were asked to record how many full-time students and how many part-time students were
Figure 5.2 Receipt of APL / APEL
Base: All students at responding institutions who started the course between September 2003 and February 2005 and were still on it in spring of 2005 (2,179).
5.2.1 Receipt of APL credit
Of the three per cent (76 students) who received APL credit, almost three-quarters (73%) were based at a higher education institution (including universities, university colleges, and HE colleges) and the remaining 28% were based at further education colleges. Given that most students among the responding institutions were based at FE colleges, this would appear to indicate that a disproportionately high number of those receiving APL credit were based at higher education institutions. Conversely, it could also be said that a lower than expected proportion of those based at FE institutions
received this type of accreditation. However, due to low base sizes, the differences in receipt of APL credit between students based at FE colleges and HE institutions are not statistically significant.
Received APEL
1% Received
APL 3%
Did not receive APL or APEL
Table 5.4 Proportions of students who received APL credit, by type of institution
Type of institution Students receiving APL credit
% (n)
University 58 (44)
College of further education 28 (21)
University college 12 (9)
College of higher education 3 (2)
Other - (0)
Base 76
Base: Students at responding institutions who received APL credit (76).
When considered as proportion of students starting the course in each academic year, there are only slight differences between the two academic years (Table 5.5). In both years, the largest group of students receiving APL credit were at universities. Among the responding institutions, fewer students received APL in 2004-5 than in 2003-4 , but base sizes are too small for these differences to reach statistical significance.
Table 5.5 Proportions of students who receive APL credit, by type of institution and intake year
Type of institution Receives APL 2003-4
Receives APL 2004-5
% (n) % (n)
University 66 (31) 45 (13)
University college 9 (4) 17 (5)
College of higher education 2 (1) 3 (1)
College of further education 23 (11) 34 (10)
Other 0 (0) 0 (0)
Base 47 29
Base: All students at responding institutions
5.2.2 Receipt of APEL credit
[image:38.595.86.468.444.572.2]Table 5.6 Numbers of students who receive APEL credit, by type of institution
Type of institution Receives
APEL credit
(n) College of further education 18
University 5
Other 1
University college 0
College of higher education 0
Base 24
Base: All students at responding institutions
[image:39.595.87.468.460.587.2]The majority of students who started the course in both academic years and received APEL were based at a college of further education. However, as Table 5.7 shows, the numbers are too small for meaningful comparisons to be made between the two academic years.
Table 5.7 Numbers of students who receive APEL credit, by type of institution and by cohort
Type of institution Receives APEL – 2003-4
Receives APEL – 2004-5
(n) (n)
University 3 2
University college 0 0
College of higher education 0 0 College of further education 10 8
Other 0 1
Base 13 11
6 ROUTES THROUGH THE DEGREE
The EYSEFD course is designed to offer four routes through the Foundation Degree. These are:
• Senior practitioner in early years working with children from birth to three
years
• Senior practitioner in early years working with Foundation Stage children • Teaching assistant
• Playwork (ages four to eight)
Not all routes are offered at each institution. Furthermore, at some institutions, students had not yet been asked to choose a route as this
happens at a later stage in the course. This chapter reports on the number of institutions offering each route, the amount of time the course has been offered at the institution and whether this has a bearing on the number of routes available, and the number of students on each of the routes.
6.1 The routes offered by the institutions
Among the 100 institutions indicating which routes through the degree they offered, the most common route was that of Senior Practitioner (Foundation Stage) (Table 6.1) and the least common route was Playwork (4 – 8).
However, the variation was fairly narrow. For each of the four routes, at least three-quarters of the responding institutions offered the route. This stands in contrast to the findings of the first evaluation report when only 22% of
institutions offered the playwork route, indicating how the EYSEFD has expanded as it has bedded down.
Table 6.1 Percentage of institutions offering each route
Percentage of institutions offering each route
% Senior practitioner (0 – 3) 80 Senior practitioner (foundation stage) 82
Teaching assistant 79
Playwork (4 – 8) 76
Base 100
Base: All responding institutions offering the Foundation Degree at their site (100).
There is some evidence to suggest that the amount of time that an institution has offered the Foundation Degree is related to the number of course routes offered (Table 6.2). All the institutions that started in the first two academic years offer all four course routes, whereas some of the institutions starting to offer the degree in the most recent two academic years offer a smaller
number of courses.
Table 6.2 Number of course routes offered by start date
Number of routes offered
1 2 3 4 Total
n n n n n
2001-2 0 0 0 6 6
2002-3 0 0 0 15 15
2003-4 1 3 3 36 43
2004-5 1 0 0 16 17
Base 2 3 3 73 81
Base: All responding institutions that reported both the course start date and the course routes offered
Data were collected on the different types of institutions offering the EYSEFD and Table 6.3 demonstrates the variation in course routes offered. Further education colleges (which were most numerous among the responding institutions), were most likely to offer each of the routes and lead higher education institutions least likely. (The base sizes for university colleges and higher education colleges are too small to be statistically meaningful.)
Table 6.3 Percentage of institutions offering each route
University University college HE college FE college
% (n) % (n) % (n) % (n)
SP (0 – 3) 50 (11 )
83 (5) 100 (6) 89 (58)
SP
(foundation stage)
55 (12 )
83 (5) 83 (5) 91 (59)
Teaching assistant
50 (11 )
67 (4) 67 (4) 91 (59)
Playwork (4 – 8)
50 (11 )
50 (3) 67 (4) 89 (58)
Base 22 6 6 65
Base: All responding institutions offering the Foundation Degree at their site
6.1 Students following each route
A little over half of the students in the responding institutions were following the route leading to senior practitioner at foundation stage. One-quarter were training to be teaching assistants and one-fifth to be a senior practitioner with children aged 0 – 3. Only 8 students were following the playwork route. This distribution is not related to the routes offered by the institutions; over three-quarters of them offered each of the course routes. As demonstrated in Table 6.5, there was little change in the distribution of students by course route between the two most recent intake years.
Table 6.4 Percentage of students following each route
Percentage of students following each route
% (n)
Senior practitioner (0 – 3) 19 (412)
Senior practitioner (foundation stage) 54 (1134)
Teaching assistant 26 (558)
Playwork (4 – 8) * (8)
Base 2112
[image:42.595.86.517.268.386.2]Base: Students at the responding institutions
Table 6.5 Percentage of students following each route by intake year
2003-4 2004-5
% (n) % (n)
Senior practitioner (0 – 3) 19 (211) 20 (201)
Senior practitioner (foundation stage) 54 (608) 53 (526)
Teaching assistant 27 (298) 26 (260)
Playwork (4 – 8) * (2) 1 (6)
Base 1119 993
Base: Students at the responding institutions
Again, there was little change between the two academic years in the distribution of full-time and part-time students across the course routes (Tables 6.7 and 6.8).
Table 6.6 Percentage of full-time and part-time students following each route
Full-time
Part-time
% (n) % (n)
Senior practitioner (0 – 3) 11 (70) 23 (342)
Senior practitioner (foundation stage) 55 (338) 53 (796)
Teaching assistant 33 (205) 24 (353)
Playwork (4 – 8) * (3) * (5)
Base 616 1496
[image:43.595.85.514.379.495.2]Base: Students on the course in the responding institutions
Table 6.7 Percentage of full-time students following each route by intake year
2003-4 2004-5
% (n) % (n)
Senior practitioner (0 – 3) 10 (30) 13 (40)
Senior practitioner (foundation stage)
56 (167) 54 (171)
Teaching assistant 34 (103) 32 (102)
Playwork (4 – 8) - (0) 1 (3)
Base 300 316
[image:43.595.80.513.572.687.2]Base: Full-time students at the responding institutions
Table 6.8 Percentage of part-time students following each route by intake year
2003-4 2004-5
% (n) % (n)
Senior practitioner (0 – 3) 22 (181) 24 (161)
Senior practitioner (foundation stage)
54 (441) 52 (355)
Teaching assistant 24 (195) 23 (158)
Playwork (4 – 8) * (2) * (3)
Base 819 677
7 FINANCIAL ASSISTANCE FOR STUDENTS
Students on the EYSEFD course may receive financial assistance to help defray the costs of their studies from various sources. These include national student support measures, support provided by the institution attended and support provided by the DfES specifically to students on the EYSEFD course. Two types of support were specifically explored in the administrative database survey. These were the provision of fee waivers and financial help with the costs of childcare.
7.1 Receipt of fee waivers
Since the first post-pilot student intake to the EYSEFD course in September 2003, two key changes have taken place in funding arrangements for
students on the course. Firstly, as part of an initial attempt to attract students to the course, the DfES offered full fee waivers to part-time students starting the course in 2003-4. Initially, the fee waivers were only available to part-time students as it was thought that full-time students would be able to access funding via national student support measures. However, by the spring of 2004, access to the DfES fee waivers was widened to include full-time students as well. The new arrangements were in response to perceived inequities between full and part-time students, as highlighted in the first report in the EYSEFD evaluation program7.
Secondly, although the fee waivers from the DfES were still available in the 2004-5 academic year for those who started the course the year before, this source of assistance was not available to those starting the course from September 2004 onwards. Although full or partial fee waivers are still available from individual institutions and from national student support measures, it was expected that the proportion of students from the 2004-5 intake receiving a fee waiver would be lower than that receiving such assistance from the 2003-4 intake for the reasons outlined.
The findings here show that this is the case. Among the responding institutions at Wave 2, a total of 1,259 students were reported to have
received a fee waiver for the 2004-5 academic year. This represents 58% of current students at the responding institutions.
Table 7.1 shows the proportions of students receiving fee waivers according to their mode of study (i.e. full-time or part-time) and the year in which they joined the course. As the table highlights, the number of students receiving fee waivers was substantially lower for students who joined the course in
2004-5. Indeed, taken as a proportion of those still on the course from each intake year, 82% of students in the 2003-4 intake period received a fee waiver last year, compared to 32% of students from the 2004-5 intake period.
[image:45.595.85.422.298.376.2]Although a much smaller proportion of students in the 2004-5 intake group among responding institutions received a fee waiver, full-time students were almost twice as likely to have done so among the 2004-5 intake group than among the 2003-4 group (37% of those receiving fee waivers in the 2004-5 intake were full-time students compared to 19% of those receiving fee waivers in the 2003-4 intake)8. That notwithstanding, across both intake groups, the majority of fee waivers were received by part-time students.
Table 7.1 Receipt of fee waivers in 2004-5, by mode of study and year of intake
2003-4 2004-5 Total
% % %
Full-time 19 37 23
Part-time Base 81 917 63 342 76 1,259
Base: All students receiving fee waivers at responding institutions in the 2004-5 academic year (1,259).
[image:45.595.87.496.514.624.2]Table 7.2 provides a more detailed picture, focusing on mode of study and sources of fee waivers for students who began the course in each year.
Table 7.2 Sources of fee waivers, by mode of study and intake year
2003-4 Full-time Part-time 2004-5 Full-time Part-time Total DfES % 65 % 90 % -% -% 62 Another source 35 10 100 100 38 Base 171 746 127 215 1,259 Base: All students receiving fee waivers at responding institutions in the 2004-5 academic
year (1,259).
Among those starting the course in 2003-4 at the responding institutions, the principal source of fee waivers has been the DfES. Indeed, the DfES
provided fee waivers for two-thirds (65%) of full-time students and nine-tenths (90%) of part-time students who received such assistance.
8 This increase cannot be accounted for by the overall proportions of full-time and part-time students as