Mapping in a City Environment Using a Single Hand-Held Digital Camera
Gabriel SCARMANA, Australia
Key words: Mapping, Digital Camera, Photogrammetry, Surveying
SUMMARY
Densely populated cities pose a problem for reliable navigation and tracking solutions using GPS. Narrow streets between high-rise buildings blocking GPS signal paths provide limited visibility to satellites and cause multipath effects, resulting in degraded navigation accuracy and reliability.
In this context this paper proposes a conceptual framework for a mapping process in an attempt to survey city blocks where the only sensory input is a single low-cost digital camera. This proof-of-concept measuring process begins with taking images of at least two known geo-referenced control points and involves taking sequential images as the user walks forward around a city block. Each image is linked to previous images of the same scene taken from a previously occupied location.
Bundle adjustments and registration algorithms compute the direction and orientation between sequential images that, in turn, allows the extraction of 3D information of selected target points visible in the images. Computations are carried out within an office environment using a consumer-grade photogrammetric software program.
Mapping in a City Environment Using a Single Hand-Held Digital Camera
Gabriel SCARMANA, Australia
1. INTRODUCTION
Mobile Mapping Systems (MMSs) have become an emerging trend in mapping applications. The trend towards MMSs is motivated by the high demand for a fast and cost-effective 3D data acquisition method, and by technological developments in both digital imaging and navigation sensors. Essentially, an MMS has two main components: the mapping sensors and the navigation system. Mapping sensors are typically digital cameras, but may include additional sensors such as laser scanners, multi-spectral scanners, or radar.
Based on the measurements from the mapping sensors, the location of features of interest relative to the platform on which they are mounted can be estimated either by direct range measurements - when laser scanners are employed – or indirectly, by space intersection, where 3D coordinates of the points are established for example by the intersection of two ray paths using at least two photos (stereo images) of the same object taken from two different locations or camera stations. If the carrying platform (the camera) is, in turn, directly geo-referenced by the navigation component (i.e. a GPS unit), then the absolute position of the mapped features can be determined (La Flamme et al., 2006).
A technique which makes use of stereo images is referred to as close-range photogrammetry. It is an accurate, cost effective procedure of collecting measurements of real world objects and conditions, in different environments, directly from photographs. Applications of close-range photogrammetry are abundant and include industrial installations, shipbuilding, construction, forensics, civil engineering, architecture, deformation measurements and topographic surveys (Mitchell, 2007).
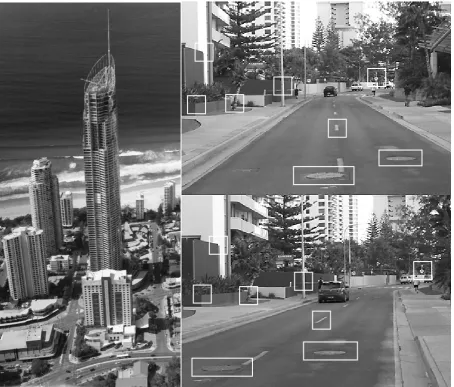
This paper investigates and tests a conceptual framework for a mobile mapping device which was experimentally used for geo-referencing public assets located within of a busy city area characterised by relatively narrow streets and high-rise buildings. In this environment, the use of hand held GPS equipment was limited due to loss of satellite “visibility” and/or erroneous signals due to multi-path effects. Public assets in this city environment may range from landscape areas, street lights, trees, fire hydrants, recreational facilities such as small park areas and other public venues. Figure 1 gives an indication of this type of environment.
Figure 1: Overall oblique view of the city environment showing the area included in this study (left) and (right-above and below) are respectively two images of the same street depicting common objects. These two images are taken from different angles as the user advances along the street.
2. CAMERA AND SOFTWARE REQUIREMENTS
The camera model used in the experiment is the Fuji A500. The camera has a solid state CCD (Charged Coupled Device) image sensor of 5 megapixels and can be purchased for less than AUS$100 (2008). Additional information on this camera and detailed specifications can be found at www.fuji.com.
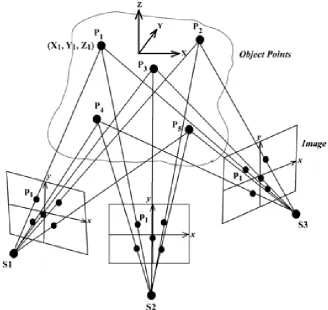
The 3-D models or coordinates produced by this software can be exported in .DXF format to an AutoCAD or MapInfo environment. The process that Photomodeler uses to convert two-dimensional (2D) coordinate (x,y) information of points of interest recorded in two or more images of a photographed scene into three-dimensional (3D) coordinates (X,Y,Z) is illustrated in basic form in Figure 2.
If three images of an object are photographed from three different viewing directions, with any camera, such that points of interest (i.e., points P1 to P5 in Figure 2) appear in all images. Intuitively, it is clear that if the positions of the camera stations S1, S2 and S3 are known in a 3D reference system, with the X, Y and Z axes as illustrated, and the directions of the three imaging rays to a feature point are also known, then the position, say P1, will lie at the point of intersection of the three rays at coordinates (X1, Y1, Z1).
[image:4.595.138.467.350.660.2]To achieve this mutual intersection of all matching rays, it is necessary to determine the same relative orientation between the images at the time of photography. This reconstruction of the spatial orientation of images, with the 3D reconstruction of the true shape represented by the object points, is termed photogrammetric orientation. With Photomodeler, any number of images, any number of points, and a wide variety of camera viewing directions are accommodated in the 3D coordinate determination.
Two geometric constraints should be fulfilled in order to perform the relative orientation of one image with respect to another. The first is that the camera stations are separated such that the angle between the two intersecting rays at each point is greater than a few degrees (i.e., the rays are not near parallel). The second is that there must be at least six corresponding points referenced for the two images and these cannot all lie within a straight line.
While these conditions are necessary, they may not be sufficient to ensure a robust relative orientation, since the process of intersecting the bundles of rays is a complex mathematical process, which can lead to either a failed solution, an incorrect solution or even multiple possible solutions in cases of very poor ‘geometry’ (Gontran et al, 2007, Clemente et al, 2008). For additional information on optimal geometric measuring schemes as well as the full range of capabilities of this photogrammetric software the reader is referred to the manual of instructions for Photomodeler.
3. CALIBRATION OF CAMERA-LENS SYSTEM
Photogrammetric measurement cannot be accurately performed without knowing the interior characteristics of the camera. The process of determining the optical and geometric characteristics of a camera is called calibration. In general, camera calibration may serve to evaluate the performance or stability of a lens and to determine the parameters of a lens or camera-lens system or image collection process. A simple procedure is used in Photomodeler to carry out a camera calibration by analysing a grid of targets projected onto a flat wall.
A total of eight images taken from different angles are needed for calibration purposes. Processing of the eight photographs (or more) in Photomodeler produces the following camera parameters: (1) principal point coordinates (the intersection of the optical axis with the image sensor); (2) principal distance (the distance from the centre of the lens to the principal point); (3) lens distortion characteristics (radial and tangential); and (4) sensor format size (pixel size and number of pixels). The calibration process takes into consideration the actual extent and dimensions of the project and the results are saved and later used for photogrammetric analysis.
Self-calibration of the camera could have also been performed in Photomodeler, which would have provided for higher measurement accuracy. In a self-calibration, camera parameters are determined based on points measured on the actual object; however, self-calibration was not used in this proof-of-concept study given that many more artificial targets would have been required (Fryer, 1996).
4. FIELD TEST AND ACCURACY ASSESSMENT
street lights and major trees) located along the streets. Local and state government authorities routinely carry out periodic surveys of public assets in order to update and monitor the state of these public facilities for planning capital expenditures and for safety purposes.
The mapping/measuring scheme starts from well defined landmarks or reference points. Three initial control points were established and consisted of natural permanent targets such as the corner of tiles on building walls or stable street signs. The 3D coordinates of these control points were measured with a total station and converted to the cartographic projection designated for this job (GDA94 – Geodetic Datum Australia, Zone 56). The total station used in this experiment was the Leica TC2002. The reference marks selected for initial orientation were well spread in three directions and would not lie on the same plane.
This instrument is designed for work requiring a high angular accuracy (+/- 2 arc seconds) and a high distance measuring accuracy (+/- 5.0 mm / 300 m). The built-in laser system measures distance by emitting laser pulses that reflect off the targets and control points. As a result of the consistency of positional accuracy of the Leica TC2002, and for the purposes of this study, the values of the coordinates obtained from this instrument were considered as errorless and thereby used to quantify statistically the accuracy of the results obtained from the photogrammetric process.
The first three images of the sequence were taken of these control points in progression so as to bring forward along the street the correct scaling and orientation. The images were taken forward every 10-15 meters approximately and recorded in the memory stick of the camera. Shorter distances may be considered when the user enters or turns at street corners to proceed along a new street. Images may also be taken in a zigzag pattern as long as the objects of interest are present in at least two images.
These relatively short distances were selected because of geometric and visibility constraints found in street environments. When taking the images there were often few target points traced in the whole image (in particular near the image borders) while there were often several points traced but located in the central part of the image. Hence, the homologous rays intersected with a very small angle thus compromising the positional accuracies of selected targets. In other words, the intersecting rays would only change slightly even if they were traced along the whole sequence; others could not be determined at a certain stage, but only later, if traced by using a sufficient number of images.
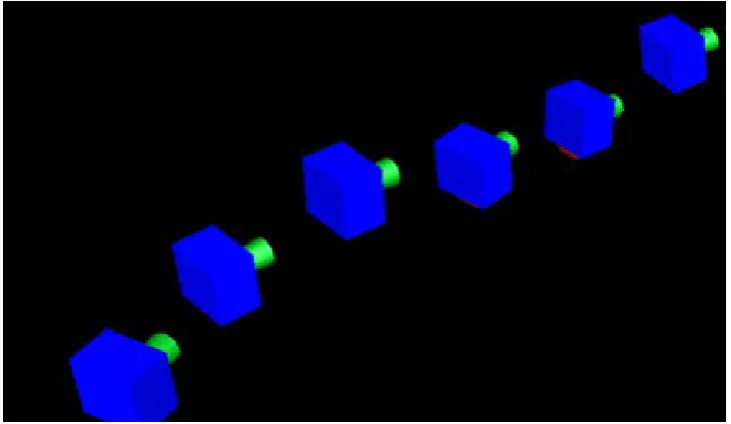
Moreover, points with too poor geometry were often eliminated or not considered in the calculations of the bundle adjustment of Photomodeler. Figure 3 is an example of the trajectory of the camera (X, Y and Z) locations as it takes images in progression. The 3D coordinates of the camera are computed by the software.
performed off-site using a personal computer and the Photomodeler software. In order to ensure that all feature points were visible in a sufficient number of images (2 is the minimum) more images than necessary were recorded in this study. Images not needed do not have to be included in the computations, but the recording of an insufficient number of images is a more difficult situation to recover from.
Figure 3: Trajectory reconstruction of a camera using Photomodeler.
The total cost of the basic photogrammetry system used in this research, including the consumer-level digital cameras and non-industrial software, was less than $1200. After loading the photographs into PhotoModeler, the first step of the Photogrammetric assessment is the “marking” of points (i.e., natural target points) in the images. A helpful, sub-pixel marking tool is provided in PhotoModeler to determine the centroid of circular targets; in general, the point marking is accurate to about 1 pixel using this tool. In addition, street features can be selected and marked using line and edge marking tools. Figure 4 illustrates one of the three images taken along a street showing the position of common assets.
Fig. 4: Natural targets points are referenced in two or three images with Photomodeler.
[image:8.595.114.472.467.673.2]Once all the artificial targets were referenced and computed the 3D coordinates of these points were compared with the coordinates obtained from the survey of the same points carried out with an electronic total station. The graph in Figure 6 summarizes the cumulative positional errors based on the overall differences of coordinates for the 80 test points determined by the surveying total station measurements and those determined using the photogrammetric reconstruction.
Figure 5: Overall directional standard errors (m.) in X, Y and Z.
0 0.2 0.4 0.6 0.8 1 1.2 1.4 1.6 1.8
5. CONCLUSIONS
In this paper, a photogrammetric reconstruction has been presented for trajectory reconstruction without GPS navigation tools. The technique merges sequential images taken along busy city streets using as the only sensor a consumer-grade digital camera. Notable findings encountered in this study are:
- The positional accuracy of selected target points of interest deteriorated with the distance covered. Cumulative positional accuracies in the order of 1 metre in all coordinate directions were obtained for a specific segment (300 m.) of a busy city block. These positional errors directly depended on the distance covered, the number of observation or camera stations, the precision of the system components, and on the measuring geometry. How each component precisely influences the final positional accuracy is the subject of ongoing research and improvements in this area are forthcoming.
- Further studies with additional camera stations, increased resolution and improved camera angles would be useful to test the effect they may have on improving accuracy.
- The speed and convenience of the imaging process compared to measuring coordinates with a surveying total station are very attractive. As camera resolutions increase, the accuracy of low-cost photogrammetry will increase and may be more widely utilized.
- Photogrammetric measurements were completed by means of site photography with no contact of the specific points of interest. All measurements and data processing were performed in an office environment using a personal computer and the Photomodeler software. The total cost of the basic photogrammetric system used in this research, including the camera and the non-industrial photogrammetric software, was less than AU$1200.
- The results so far are encouraging and the plan is now to extend the proposed mapping system to include automatic image registration and to integrate pictorial and navigation data to include 3D shapes rather than just point features. Future work will also include the use of GPS enabled digital cameras and thereby the application of object-space constraints that will enhance the reconstruction accuracy.
REFERENCES
La Flamme C., Kimgston T and McCuaig R. (2006). “Automated Mobile Mapping for Asset Managers”. TS 38 – Engineering Surveys for Construction Works I. XXIII FIG Congress, Munich, Germany, October 8-13.
Mitchell H. (2007). “Fundamentals of photogrammetry”. Applications of 3D Measurements from images”. Whittles Publishing. Chaithness KW6 6EY. Scotland. UK.CRC Press. Taylor and Francis Group. Edited by J.G Fryer, H.L Mitchell and J. H. Chandler.
Clemente L., Davison A., Reid I. D., Neira J. and Tardós J. (2008). “Mapping Large Loops with a Single Hand-Held Camera”. Robotics: Science and Systems III, June 27-30, 2007, Georgia Institute of Technology, Atlanta, Georgia, USA 2008.
Gontran H., Skaloud J and P.Y. Gilliéron P.Y. (2007). “A mobile mapping system for road data capture via a single camera”. Advances in Mobile Mapping Technology, Tao & Li © 2007 Taylor & Francis Group, London, ISBN 978-0-415-42723-4.
BIOGRAPHICAL NOTES
Gabriel Scarmana is presently employed as a Senior Spatial Sciences Officer with the Queensland Government (Australia) within the Department of Transport and Main Roads (South Coast Region). He completed his PhD in 2004 from the University of Newcastle (Australia). Gabriel maintains an active research interest in the areas of image processing and mobile mapping technology.
CONTACTS
Gabriel Scarmana (PhD)
Department of Transport and Main Roads, Queensland, Australia PO Box 442 | Nerang Qld 4211
Gold Coast, Queensland AUSTRALIA
Tel: int+61+0755613818 Fax: int+61+075596 9511