Exploration on Feature Extraction Schemes and
Classifiers for Shaft Testing System
Kyungmi Lee
School of Business, James Cook University, Cairns, Queensland 4870, Australia Email: [email protected]
Abstract— A-scans from ultrasonic testing of long shafts are complex signals, thus the discrimination of different types of echoes is of importance for non-destructive testing and equipment maintenance. Research has focused on selecting features of physical significance or exploring classifier like Artificial Neural Networks and Support Vector Machines. This paper summarizes and reports on our comprehensive exploration on efficient feature extraction schemes and classifiers for shaft testing system and further on the diverse possibilities of heterogeneous and homogeneous ensembles.
Index Terms—Signal Classification, Non-Destructive Testing, Signal Feature Extraction
I. INTRODUCTION
Applications of machine learning demand exploration of feature extraction methods and classifier types in order to obtain systems with reliable high accuracy. The industrial application discussed in this paper is the classification of ultrasonic echoes in an A-scan for testing shafts. The application is particularly challenging as A-scans are taken from the end of a long large complex shaft. Although several pattern analysis and machine learning techniques have been used with success in analyzing ultrasonic A-scan data [1-2], they are typically in the context of very short signals where the task is simply detecting the existence of an echo indicating a fault in the material. In long shafts there are many kinds of echoes including echoes where there is no fault. These mode-converted echoes are the result of reflection and other artifacts of the ultrasonic signal navigating and filling the shaft. They may cause misjudgement of the position of real faults (cracks) of shafts, thus it is important to distinguish them from genuine echoes.
Therefore, the problem is to discriminate efficiently the different types of reflectors among the large volumes of ultrasonic shaft test data, and classify them into a) those that correspond to flaws, cracks and other defects (CR) and b) the multiple reflections and mode-converted echoes (MC) of other reflectors. A main problem in the field is that the signal echoes caused by CR can be confused with fainted echoes caused by MC and vice versa. Consequences of misclassification are catastrophic with enormous cost in downtime, consequential damage
to associate equipment and potential injury to personnel [3]. Conventional Non-Destructive Testing (NDT) techniques, which are based on the heuristic experiencebased echo-dynamic pattern identification methods, bring about costly, lengthy and error-prone analysis and thus lead to inconsistencies in results.
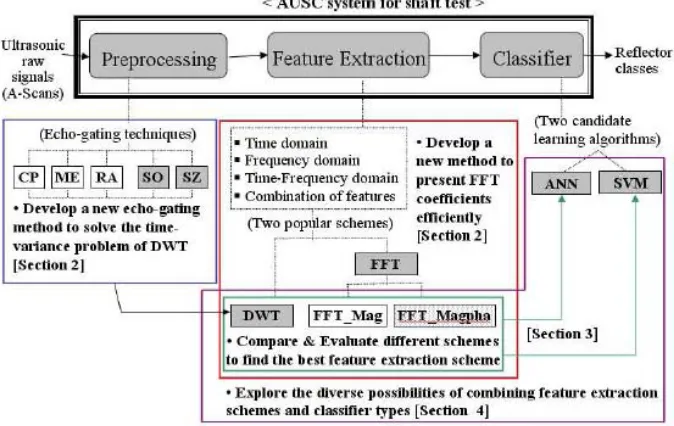
To address such a need, industry demands new innovative NDT techniques for shaft-typed steel pieces, and furthermore requires novel algorithms for the analysis of large volumes of ultrasonic shaft test data. More specifically, this paper aims to develop a more advanced and consistent Automatic Ultrasonic Signal Classification (AUSC) paradigm for testing shafts. Figure 1 highlights our comprehensive analysis and the research points corresponding to each stage of developing an AUSC system for testing shafts.
Section II is concerned with the extraction of informative features from ultrasonic signals, particularly focussing on two top approaches; namely, Fast Fourier Transform (FFT) and Discrete Wavelet Transform (DWT) both of which have been explored and compared each other by many researchers in their quest for better sets of features for AUSC. In Section III, the comparison analysis between two feature extraction schemes (FFT and DWT) is expanded through the intensive experiment of the classification performance by employing Artificial Neural Networks (ANNs) and Support Vector Machines (SVMs) as learning algorithms. We report results of our investigation into whether DWT can outperform FFT at extracting features for ultrasonic shaft test data. Section IV deals with an open issue: which generation and combination method to choose for constructing the most effective and reliable multi-model systems for our application domain. It suggests guidelines for the choice of ensemble structure for ultrasonic shaft signal classification through the experimental analysis. Conclusions are followed in Section V.
II. FEATURE EXTRACTION SCHEMES FOR ULTRASONIC
SIGNALS
A. FFT coefficients using magnitude and phase
In their quest for better sets of features for AUSC, many researchers have commonly employed two different preprocessing techniques using coefficients of FFT and coefficients of DWT in order to extract feature sets, and compared the classification performance using each feature set. Most results of comparing FFT and
DWT showed a superiority of DWT over FFT in discriminating the type of flaw (or its non-existence) in the context of comparatively shorter and simpler signals [4–6]. However, those previous claims are subject to debate because most previous comparison studies used only the magnitude component of the transformed signals using FFT and their phase components were naturally excluded through the process of using FFT coefficients as feature vectors for classifiers (we named this type of FFT coefficients “FFT_Mag”). Therefore, in order to make a fairer comparison, we formed a new set of FFT feature vectors which effectively represent both magnitude and phase information of FFT sequences (we named this type of FFT coefficients “FFT_Magpha”).
A flowchart showing the process of constructing “FFT_Mag” and “FFT_Magpha” is presented in Figure 2. The final feature vector has the same number of elements
[image:2.595.126.463.97.310.2]because we apply down-sampling (by at least two) on the FFT sequence for the “FFT_Magpha” method. This adjustment of the length of the feature vectors is especially required for using them for the comparison experiment between two FFT schemes. Figure 3 presents the result of our experiment for comparing the classification performances of using “FFT_Mag” and “FFT_Magpha” respectively as feature vectors to ANN. The result implies that “FFT_Magpha” is a more efficient FFT based feature extraction approach than “FFT_Mag” thus confirms that the phase components of FFT sequences are important information carriers and must not be ignored. Therefore, in order to investigate whether DWT can outperform FFT as a feature extraction scheme in this application, it is more appropriate to compare the feature extraction schemes using DWT with the ”FFT_Magpha” approach than with the ”FFT_Mag”.
Figure 1. The categorization of our research aims corresponding to each stage of developing an AUSC system.
[image:2.595.115.478.591.767.2]B. DWT coefficients preprocessed using a new echo-gating technique
Many of the recent work on ultrasonic flaw classification employed the DWT as part of its feature extraction scheme [4–8] and demonstrated the potential of DWT as a useful feature for AUSCs. DWT, however, exhibits a time-variance problem that has resulted in reservations about its wide acceptance [9-10]. To overcome this problem, we developed new techniques (SO1and SZ2) to derive a preprocessing method for time-domain A-Scan signals.3This techniques offer consistent extraction of a segment of the signal from long signals that occur in the NDT of shafts. It has been investigated if the newly developed method for gating a signal section and singling out an echo plays an effective role in overcoming the timevariance problems of DWT [11]. This investigation also included the comparison of the performance of the newlydeveloped technique (SO and SZ) with other alternatives (RA, CP and ME)4, and established experimentally that DWT coefficients can be used as a feature extraction scheme more reliably by using our new preprocessing technique.
III. FFTVSDWT USING ANN OR SVM CLASSIFIER
Once the feature extraction process has been completed, a suitable decision making algorithm for classification is applied to determine and classify the flaw type information. Among the various learning mechanisms for ultrasonic signal classification, ANNs have gained more popularity due to their ability to generate complex decision boundaries in the multidimensional feature space [12]. This is attractive, especially in ultrasonic flaw classification, because the relationship between ultrasonic signal characteristics and their defect class is not straightforward [1, 13].
In order to evaluate which feature extraction scheme is best for an AUSC system for shaft testing using ANNs as its classification algorithm, we investigated into whether DWT can outperform FFT at extracting features in ultrasonic signals from shafts. Other previous reports [4, 14] have compared the DWT based features with the FFT with limited feature components. Typically, those previous reports considered only short signals and they paid little attention to the phase components of FFT sequences. As explained in Section II, we approached to represent both the magnitude and phase of the FFT sequences in a feature vector and compared these newly proposed FFT based feature sets (FFT Magpha) not only with the conventional FFT feature sets (FFT Mag) but also with DWT based feature sets.
1 Systematical echo capturing method with preservation of original
neighbouring grass.
2
Systematical echo capturing method with zero-padding.
3 The details about these two techniques are presented in the author’s
previous work [11]
4 RA: Random Positioning; CP: Central-Peak positioning; ME: Main
Energy capturing.
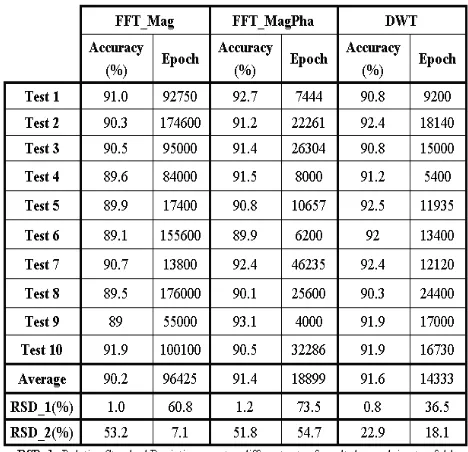
More precisely, three feature extraction schemes (FFT Mag, FFT Magpha and DWT) were used to represent the signal data feature and all parameters of the ANN classifiers were kept constant to focus on the feature extractions scheme. Thus, the data features have the same number of components and are presented to ANNs with the same architecture and parameters. The effectiveness of all feature extraction schemes were compared by their classification accuracy for ultrasonic shaft signal echoes. To test the performance of each feature extraction scheme, we recorded three result sets. Each result set corresponds to applying FFT Mag, FFT Magpha and DWT, and it is derived from each of the ten times of 10-fold cross validation tests (a total of one hundred tests for each network). The derived information consists of the following indicators.
1) The percentage of correct classification over the validation set.
2) The number of epochs required to train to the given error rate or to the lowest validation error rate before overfitting happens.
Table I lists the result values for each cross validation test set. The presented values for each test (from the 1st row to the 10th row of Table I) are the averages calculated for ten runs of test by setting up different initial weights on ANNs. An overall average is also calculated and put on the 11th row of Table I. We also calculated the corresponding standard deviation divided by this mean value (relative standard deviation) both over cross validation test sets and over different weighting runs for each test sets. They are presented on this table as RSD_1 and RSD_2.
The visual comparison between the classification
TABLE I
[image:3.595.305.539.512.738.2]
Figure 3. Relative comparison of performance of ANNs using three different feature extraction schemes: FFT_Mag vs FFT_Magpha vs DWT
performance of using three different feature extraction schemes is offered by Figure 3, which shows histograms presenting relative values of the results shown in Table I.
In order to judge the statistical significance of the test results, we conducted ANOVA [15], [16] tests for the results at the p=0.05 level and the results are summarized in Table II. The statistical significance of the results is determined by comparing the F value produced through F-test with its corresponding F-test critical value. That is, if F value is bigger than the critical value, the evidence of statistical significance is produced and then the test results can be supported. The results from our experiments with three different feature sets suggest the following pair wise comparison.
First, does phase information count for something on long signals? That is, using only the magnitude of the FFT sequences as a feature set rather than using the magnitude and phase together as FFT based feature sets (but reduced sampling rate). Because we separated the magnitudes component and phase component of complex FFT sequences and rearranged them by concatenation, we can compare this feature extraction technique (FFT_Magpha) with the more generally used FFT based
feature extraction technique (FFT_Mag). Secondly, does DWT buy more information than phase information? That is, a comparison between feature extraction schemes using FFT and DWT. From the analysis of the results the following conclusions can be drawn.
• Our experiments show that the FFT_Magpha provided the better result in classification performance. This experimental result is also supported by its ANOVA test result in Table II. Moreover, clearly a smaller number of epochs is required for convergence (for equivalent error tolerance) in the validation set when using the FFT Magpha scheme.
• This result implies that FFT Magpha is a more efficient FFT based feature extraction approach than FFT_Mag. If the “phase” components of FFT sequences, which can usually be ignored in the process of extracting the frequency components, are represented in the FFT based feature vectors, the precision as well as their training and execution time are highly enhanced.
• Therefore, in order to investigate whether DWT can outperform FFT as a feature extraction scheme in this application, it is more appropriate to compare the feature extraction schemes using DWT with the FFT_Magpha approach than with the FFT Mag. We can also say that FFT Magpha provides the benchmark for the FFT-related feature extraction scheme.
• With respect to classification accuracy, the DWT_based feature extraction method also provides results as good as the FFT Magpha method.
• The DWT also showed more reliability by producing comparatively stable results in different runs of cross validation tests. This implies that the DWT has potential as feature extraction scheme for training ANNs with arbitrary training data and using the networks for in-field ultrasonic shaft signal classification.
Though the demonstrated superiority of DWT was initially tested on ANNs as the classifier, this raises the issue about the synergy created by the DWT as a feature selector and the ANN as the classifier; namely, is this a feature extraction that is too much fit for ANN and not useful for other classifiers? That is, can the superiority of DWT be validated by the comparison of its classification performance with FFT’s only through ANN classifiers? Though ANNs have been popularly employed as classifiers for AUSC, we also need to consider the many difficulties inherent in the ANN learning paradigm (such as generalization control, overfitting and parameter tuning) thus should be careful in claiming DWT’s predominance.
In order to confirm the potential of DWT as an efficient feature extraction scheme for ultrasonic shaft test signals, we made a new comparative experiment involving SVM approach instead of ANN models. SVM has gained a strong reputation for its generalization control capability, thus avoiding overfitting, and more
TABLE II
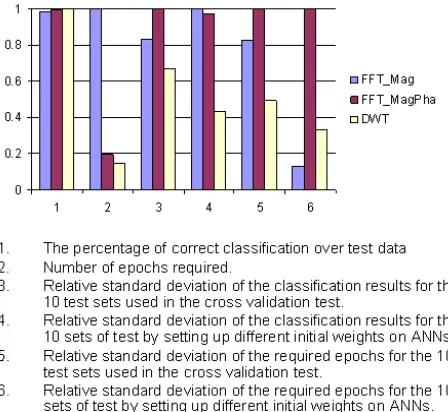
[image:4.595.60.284.144.350.2]confidence can be placed in comparison results using SVM modelling than in those using ANN modelling, especially when there are only a limited number of training examples. We also analysed the classification results from both schemes (FFT and DWT) to investigate whether different feature extraction schemes affect the classification performance in different classes. That is, we recorded the classification accuracy for each of 10 test runs as well as the average accuracy, and also analysed how many instances of each class (CR and MC) were classified correctly. We summarize the classification results (as accuracy percentages) in Table III. Figure 4 offers a visual comparison between the classification performance of the two different feature extraction schemes. It displays the corresponding histograms of relative values for the results shown in Table III. In order to judge the statistical significance of the test results, we also conducted ANOVA tests for the results at the p=0.05 level and the test results are summarized in Table IV.
Through the analysis of the experimental results, we gained several noteworthy points as follows:
• The SVM classification performance of DWT is superior to that of FFT in every different test run. This matches the result of the previous comparison applying ANN models. It implies that DWT is a more reliable feature extraction scheme; that is, it can be employed for constructing a better classifier for in-field ultrasonic shaft signal tests. The result also dissipate any doubt that the DWT feature extraction methodology is too far suited for ANN.
• We can observe some differences for specific classes of echoes when reflecting upon the classification result from using each feature extraction scheme. DWT shows better performance in classifying CR than MO, while FFT shows a preference for the other way around. That is, using DWT one rarely gets a CR incorrectly classified (either a CR as something else or something else as a CR). Symmetrically, using FFT one rarely gets an MO incorrect.
• This result can provide useful prior knowledge when constructing a hybrid AUSC system for testing shafts using a combined feature extraction scheme. In this system, the FFT, in spite of lower accuracy for overall classification, could complement the decisions based on DWT features.
IV. ENSEMBLES FOR ULTRASONIC SIGNAL CLASSIFIERS
While we have focussed on finding the best single classifier model by determining the best selected feature extraction scheme (FFT or DWT), we also try to learn multiple models of the shaft test data and combine their outputs for making a final decision for classification. The reason for combining multiple models (ensemble of classifiers) constructed by a single feature extraction scheme (FFT or DWT) and a single learning algorithm (ANN or SVM) is that FFT might reflect physical properties that are different from those that DWT shows. We suspect that including the FFT as another informant of the decision process, even if the accuracy using DWT has shown to be superior, should improve accuracy.
There are various approaches (homogeneous or heterogeneous) for generating multiple classifiers and for combining the outputs of multiple models [17-18]. The issue raised by this diversity of methods for generating and combining multiple models is to pursue the best
TABLE III
ACCURACY CLASSIFIYING EACH CLASS (CR AND MC) FOR TWO DIFFERENT FEATURE EXTRACTION SCHEMES FFT VS DWT
TABLE IV
A SUMMARIZED RESULT OF THE ANOVA TEST CONDUCTED FOR THE RESULTS PRESENTED ON TABLE III
[image:5.595.60.293.342.685.2] [image:5.595.62.290.585.686.2]generation-combination method for constructing the most effective and reliable multi-model AUSC system for our application domain. Therefore, in order to construct an effective multi-classifier system, we need to decide a scheme for creating models and also a combination method for decision making.
To determine guidelines for the construction of an integrated multi-classifier model using both feature schemes (FFT and DWT) effectively. we explored the diverse possibilities of heterogeneous and homogeneous ensembles, combining techniques, feature extraction methods and classifier types. The whole experimental setting consists of the following steps
1) Map shaft inspection data into feature domains using two feature extraction schemes (FFT and DWT).
2) Train them through SVM models and ANN models using five-fold cross-validation learning and recorded their performance as single models. 3) Combine single models across two dimensions: a)
combining the decisions of the FFT model and the DWT model trained by a single learning paradigm and b) combining the decisions of the SVM model and the ANN model with the same feature scheme. We applied three different traditional combining methods (DS, BC and LC) for each combination. 4) Compare the classification accuracy results from
the three combined models with the results of using a single model.
Note that the first and second steps constitute procedure for generating multiple models. The third step is the procedure for combining those multiple models. Figure 5 graphically summarizes those two procedures (model generation and model combination) of our experiment and Figure 6 presents the whole procedure in our experiment in summary.
In order to investigate if the combined model performs more accurately in classifying input data than a single model does, we compared the decision error rate of the combined model with the decision error rate of each individual participant model. Table V shows the comparison of the decision error rate between combined models and single classifier models by calculating the difference of both error rates. c(A,B) indicates a combined classifier of two individual classifiers model A and model B. The figures in rows (1) to (3) indicate the difference of error rates between the combined model and the first single model participant while those in (4) to (6)
are the difference of error rates between the combined model and the second participant. Among these six rows, (1) and (4) are the results for classification performance for overall data. On the other hand, (2) and (5) are result figures for classifying CR while (3) and (6) are for classifying MC.
Figure 6. Overall procedure of our experiment for building an ensemble of classifiers
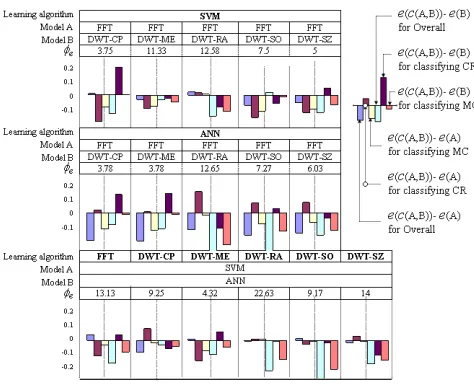
Figure 7 graphically presents this comparison result, and displays the amount of improvement in the classification performance in a form of bar charts. The Bars where the combination is an improvement point downwards while if a single classifier remains better, the bar points upwards. We also computed a value e which indicates the “fraction of correlated errors” [19] and is also listed in Table V and Figure 7. The value of e is generally used to measure the degree to which the errors made by models of the ensemble are correlated.
The following points are remarkable from this experimental result.
• Combined models show better performance than single models in the classification accuracy for the whole test set across schema for generating or combining multi-classifiers.
• Combining two classifiers trained by different feature sets becomes more advantageous when we use SVM as a learning algorithm than when we use ANN.
• Though the overall accuracy of combined models is higher than the accuracy of single models across most types of combinations, their performance in classifying each class data (MO and CR) is diverse. Especially, most FFT and DWT ensembles trained by ANN perform worse than single models in classifying CR data; whilst corresponding combined models trained by SVM perform reliably on both classes except for one combination (the FFT and DWT-CP ensemble).
• Amongst the five types of DWT data combined with FFT data, DWT-SZ shows most reliability in classifying both classes regardless of the learning paradigm. This implies that different echo gating preprocessing for extracting DWT features plays a role in structuring the DWT feature sets. We
[image:6.595.53.291.662.794.2]Figure 7. Bar charts for the comparison of the performance of combined models. c(A,B) indicates a combined classifier of two individual classifiers, model A and model B. e(A) indicates the classification error rate of the classifier model A.
suspect there are some implicit differences in DWT.
• The performance of the heterogeneously
combined classifiers is different depending on which feature sets were used to train them.
• The value of e is related to the amount of error reduction made by combining multi-classifiers. As shown in Figure 7, the value of e seems to be very relevant to the overall error reduction rate but not to have much relevance to the error reduction for each class data.
• The most suitable combination structure may depend on the interest of some particular class. For example, if accuracy for the CR class is the issue, then the SVM with DWT (single classifier) is not surpassed by the combination, although the combination does better over all the classes.
V. CONCLUSIONS
The industrial application discussed in this study is the classification of ultrasonic echoes in an A-scan. The application is particularly challenging as A-scans are taken from the end of long large complex metal shafts. The problem is then, to discriminate efficiently the different types of reflectors amongst the large volumes of digitalized ultrasonic shaft defect information. This paper reports on our experimental investigation on efficient feature extraction schemes and classifiers for shaft testing system. The following is a list of contributions made in this study.
• Introduction of a new FFT-based feature extraction scheme(FFT_Magpha) by which both magnitude and phase components of FFT
sequences are effectively represented. Through this newly developed feature extraction scheme, we can incorporate the “phase” component of FFT sequences (which can, in other schemes, usually be ignored in the process of extracting the frequency components) to the construction of the FFT-based feature vectors. The experimental comparison between this new scheme and the traditional scheme (FFT_Mag) by using them in a typical AUSC system, shows that the new scheme (FFT_Magpha) highly enhances the precision as well as improving their training and execution time.
• Analysis of DWT as a more beneficial feature extraction scheme than FFT in an AUSC system for testing shafts. This is analysed through the experimental comparison of the classification performance using DWT, not only with the classification performance using the traditionally-used-FFT with limited feature components, but also with the newly-proposed-FFT scheme (FFT_Magpha). This extended comparison between DWT and the state-of-the-art FFT provides a more reliable and trustworthy analysis about DWT as a feature extraction scheme for our application.
• Finding the potential of DWT as a more reliable feature extraction scheme, through the more stable classification results in different runs of cross validation tests compared to the results produced in the tests using FFT-based feature extraction scheme. This potential is especially beneficial for the practical NDT for shafts, as we can train a classifier with arbitrary training data and then use the classifier for in-field ultrasonic shaft signal tests.
• Demonstration of the superiority of using DWT as the feature extraction scheme in the ultrasonic shaft signal classification involving not only ANN but also SVM. These results dissipate any doubt that the DWT feature extraction methodology is too far suited for ANN which has been popularly employed previously in many similar experimental scenarios.
• Discovery of predisposition to distinguish a certain facility when specific classes of echoes are concerned with different combinations of feature extraction (FFT or DWT) and classifier (ANN or SVM), though DWT is superior to FFT and SVM is superior to ANN in terms of the overall classification accuracy. This finding leads into a hybrid classifier that will improve overall performance by giving more weight to the more trustworthy sub-classifier.
• Exploration of the diverse possibilities of heterogeneous and homogeneous ensembles by combining classifiers along the dimension of feature extraction mechanism, along the dimension of combination methods and along the dimension of type of classifier
φ
REFERENCES
[1] G. Katragadda, S. Nair, and G. P. Singh, “Neuro-Fuzzy Systems in Ultrasonic Weld Evaluation,” Review of Progress in Quantitative Nondestructive Evaluation, vol. 16, pp. 765–772, 1997.
[2] S. J. Song, H. J. Kim, and H. Lee, “A systematic approach to ultrasonic pattern recognition for real-time intelligent flaw classification in weldments,” Review of Progress in Quantitative Nondestructive Evaluation, vol. 18, pp. 865– 872, 1999.
[3] G. Cotterill and J. Perceval, “A New Approach to Ultrasonic Testing of Shafts,” in Proceedings of the 10th Asia-Pacific Conference on Non-Destructive Testing (APCNDT), [Online], 2001.
[4] R. Polikar, L. Udpa, S. S. Udpa, and T. Taylor, “Frequency Invariant Classification of Ultrasonic Weld Inspection Signals,” IEEE Transactions on Ultrasonics, Ferroelectrics, and Frequency Control, vol. 45, no. 3, pp. 614–625, May 1998.
[5] D. Redouane, K. Mohamed, and B. Amar, “The Investigation of Artificial Neural Network Pattern Recognition of Acoustic Emission Signals for Pressure Vessel,” in Proceedings of the 15th World Conference on Non-Destructive Testing, [Online], 2000.
[6] J. Spanner, L. Udpa, R. Polikar, and P. Ramuhalli, “Neural networks for ultrasonic detection of intergranular stress corrosion cracking,” The e-Journal of Nondestructive Testing And Ultrasonics, vol. 5, no. 7, [Online], July 2000. [7] M. S. Obaidat, M. A. Suhail, and B. Sadoun, “An
intelligent simulation methdology to characterize defects in materials,” Information Sciences, vol. 137, pp. 33–41, 2001.
[8] G. Simone, F. C. Morabito, R. Polikar, P. Ramuhalli, L. Udpa, and S. Udpa, “Feature extraction techniques for ultrasonic signal classification,” in Proceedings of the 10th Int. Symposium on Applied Electromagnetics and Mechanics (ISEM 2001), 2001.
[9] Y. Mallet, D. Coomans, J. Kautsky, and O. D. Vel, “Classification Using Adaptive Wavelets for Feature Extraction,” IEEE Transactions of Pattern Analysis and Machine Intelligence, vol. 19, no. 10, pp. 1058–1066, October 1997.
[10]S. Pittner and S. V. Kamarthi, “Feature Extraction From Wavelet Coefficients for Pattern Recognition Tasks,” IEEE Transactions on Pattern Analysis and Machine Intelligence, vol. 21, no. 1, pp. 83–88, January 1999.
[11]K. Lee and V. Estivill-Castro, “Feature extraction and gating techniques for ultrasonic shaft signal classification,”
Applied Soft Computing, vol. 7, no. 1, pp. 156–165, 2007. [12]F. W. Margrave, K. Rigas, D. A. Bradley, and P.
Barrocliffe, “The use of neural networks in ultrasonic flaw detection,” Measurement, vol. 25, pp. 143–154, 1999 [13]J. B. Santos and F. Perdig~ao, “Automatic defects
classification – a contribution,” NDT & E International, vol. 34, pp. 313–318, 2001.
[14]S. V. Kamarthi and S. Pittner, “Fourier and Wavelet Transform for Flank Wear Estimation - A Comparison,”
Mechanical Systems and Signal Processing, vol. 11, no. 6, pp. 791–809, 1997.
[15]G. Clarke and D. Cooke, A Basic Course in Statistics. Arnold, 1998.
[16]P. Cohen, Empirical Methods for Artificial Intelligence. MIT Press, 1995.
[17]T. G. Dietterich, “Machine-learning research: Four current directions,” AI Magazine, vol. 18, no. 4, pp. 97–136, 1997. [18]G. Valentini and F. Masulli, “Ensembles of Learning
Machines,” in Neural Nets WIRN vietri-2002, ser. Lecture Notes in Computer Science 2486, R. Tagliaferri and M. Marinaro, Eds. Springer-Verlag, 2002, pp. 3–19.
[19]K. M. Ali and M. Pazzani, “Error reduction through Learning Multiple Descriptions,” Machine Learning, vol. 24, no. 3, pp. 173–202, 1996.
.