Evidence Report 49
July 2012
Sector Skills Insight
s
:
Sector Skills Insights:
Digital and Creative
Matthew Williams, Jim Hillage
Institute for Employment Studies
Rachel Pinto, Richard Garrett
UK Commission for Employment and Skills
i
Foreword
The UK Commission for Employment and Skills is a social partnership, led by Commissioners from large and small employers, trade unions and the voluntary sector. Our mission is to raise skill levels to help drive enterprise, create more and better jobs and promote economic growth. Our strategic objectives are to:
• Provide outstanding labour market intelligence which helps businesses and people make
the best choices for them;
• Work with businesses to develop the best market solutions which leverage greater
investment in skills;
• Maximise the impact of employment and skills policies and employer behaviour to
support jobs and growth and secure an internationally competitive skills base.
These strategic objectives are supported by a research programme that provides a robust evidence base for our insights and actions and which draws on good practice and the most innovative thinking. The research programme is underpinned by a number of core principles including the importance of: ensuring ‘relevance’ to our most pressing strategic priorities; ‘salience’ and effectively translating and sharing the key insights we find; international benchmarking and drawing insights from good practice abroad; high quality analysis
which is leading edge, robust and action orientated; being responsive to immediate needs
as well as taking a longer term perspective. We also work closely with key partners to
ensure a co-ordinated approach to research.
This report contributes to the UK Commission’s work to transform the UK’s approach to investing in the skills of people as an intrinsic part of securing jobs and growth. It outlines the performance challenges faced in the Digital and Creative sector, the ‘real-life’ skills solutions implemented by leading and successful businesses to overcome them, and the benefits from doing so. Similar reports are available for the following sectors: Advanced Manufacturing; Construction; Education; Energy; Health and Social Care, Professional and Business Services; Retail; Tourism. Each report is summarised by an accompanying PowerPoint slide pack. By understanding the key performance challenges employers face and the skills solutions available to address them on a sector-by-sector basis the UK Commission can make better use of its investment funds to support economic growth.
ii
reporting our detailed analytical work. Each Evidence Report is accompanied by an executive summary. All of our outputs can be accessed on the UK Commission’s website at www.ukces.org.uk
But these outputs are only the beginning of the process and we will be continually looking for mechanisms to share our findings, debate the issues they raise and extend their reach and impact.
We hope you find this report useful and informative. If you would like to provide any feedback or comments, or have any queries please e-mail [email protected], quoting the report title or series number.
Lesley Giles Deputy Director
iii
Table of Contents
GLOSSARY ... vii
Executive Summary ... viii
Introduction ... viii
The importance of the sector ... viii
Key Challenges ... ix
Skill demand ... ix
Skills Supply ... x
Conclusion: growth through skills ... xi
1
The Economic and Policy Climate ... 1
2
The Importance of the Sector ... 4
2.1 Overall Output and Employment Performance ... 5
2.2 Employment structure ... 9
2.3 Self-employment and working hours ... 13
2.4 Distribution of Employment by Nation and Region ... 14
2.5 International Standing of the Sector ... 15
2.6 Conclusion ... 16
3
Key Developments in the Sector over the Medium Term ... 18
3.1 Digital technology ... 18
3.2 Creative ... 20
3.3 Conclusion ... 23
4
Employment and Skill Demand in the Sector ... 24
4.1 The Changing Demand for Employment ... 24
4.2 Factors Affecting the Demand for Skills ... 24
4.3 Changing Patterns of Skill Demand ... 30
4.4 Replacement Demand ... 38
4.5 Conclusion ... 39
5
Skills Supply ... 40
5.1 Trends in Skills Supply: Individuals ... 40
5.2 Employer Investment in Skills ... 47
5.3 Migrant labour supply ... 56
iv
6
Skill Mismatches ... 59
6.1 Defining Skill Mismatches ... 59
6.2 Evidence of employer reported skill deficiencies ... 59
6.3 Causes, Impacts and Remedies ... 64
6.4 Conclusion ... 68
7
CONCLUSION ... 70
7.1 The Sector Today and Tomorrow ... 70
7.2 The Performance Challenge ... 70
7.3 Growth through skills ... 72
7.4 Business benefits ... 79
v
Table of Graphs and Charts
Table 1.1 Four recent periods of recession in the UK ... 1
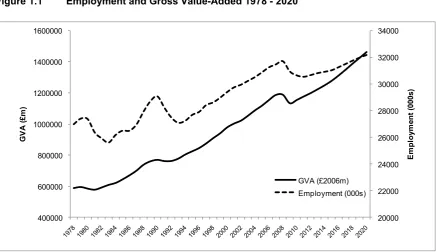
Figure 1.1 Employment and Gross Value-Added 1978 - 2020 ... 3
Table 2.1 Definition of the Digital and Creative Sector ... 5
Table 2.2 Key Output and Employment Indicators ... 6
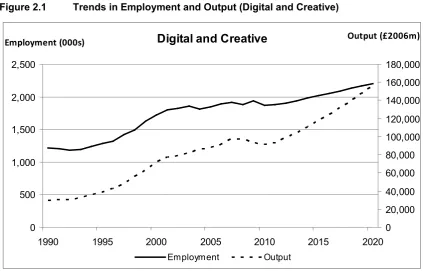
Figure 2.1 Trends in Employment and Output (Digital and Creative) ... 7
Figure 2.2 Trends in Employment and Output (Digital) ... 8
Figure 2.3 Trends in Employment and Output (Creative media and entertainment) ... 8
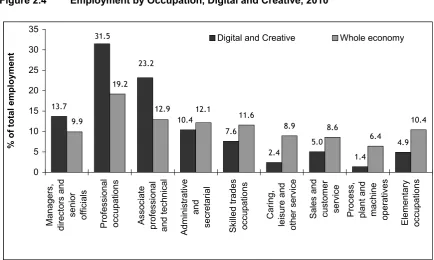
Figure 2.4 Employment by Occupation, Digital and Creative, 2010 ... 9
Figure 2.5 Employment by Qualification, Digital and Creative, 2010 ... 10
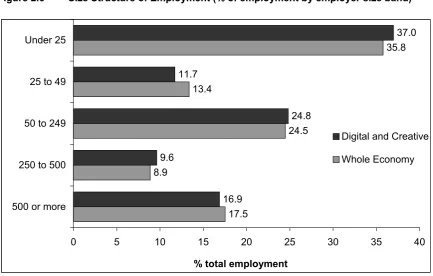
Figure 2.6 Size Structure of Employment (% of employment by employer size band) .... 11
Figure 2.7 Proportion of female employment ... 12
Figure 2.8 Age Structure of Workforce ... 12
Figure 2.9 Incidence of self-employment ... 13
Figure 2.10: Employment by nation and region for the digital and creative sector ... 14
Table 4.1 Changing Pattern of Skill Demand ... 31
Table 4.2 Changing Pattern of Skill Demand – Digital sub-sector ... 32
Table 4.3 Changing Pattern of Skill Demand – Creative sub-sector ... 33
Table 4.4 Changing Pattern of Skill Demand by qualification level ... 34
Table 4.5 Changing Pattern of Skill Demand by qualification level, Digital sub-sector . 36 Table 4.6 Changing Pattern of Skill Demand by qualification level, Creative sub-sector 36 Figure 4.1 Replacement Demand for skills to 2020 ... 38
Figure 5.1: Computer science acceptances at UK HEIs, 2005/06 to 2009/10 ... 41
Figure 5.2 Creative arts and design acceptances at UK HEIs, 2005/06 to 2009/10 ... 41
Figure 5.3 HE computer science qualifications attained in UK HEIs, 2005/06 to 2009/10 43 Figure 5.4 HE creative arts & design qualifications attained in UK HEIs, 2005/06 to 2009/10 43 Figure 5.5 Digital and creative apprenticeship starts and achievements (all levels), 2002/03 to 2010/11 ... 44
Table 5.1 Digital and creative apprenticeships starts by level and age between 2002/03 and 2010/11 45 Table 5.2 Number of employees in receipt of work-related training over the past 13 weeks 47 Figure 5.6 Percentage of employees in receipt of work-related training over the past 13 weeks 48 Table 5.3 Employer Investments in Skill Development ... 50
Table 5.4 Types of training funded or arranged for employees (%) ... 51
Table 5.5 Further Indicators of Training Activity ... 52
Figure 5.7 Reasons for not providing vocational qualifications ... 53
vi
Table 6.1 Skill Deficiencies... 60
Figure 6.1 Occupational Distribution of Skill Shortages in Digital and Creative ... 61
Figure 6.2 Occupational Distribution of Skill Gaps in Digital and Creative ... 63
Table 6.3 Skills found difficult to obtain ... 65
Table 6.3 Gross weekly earnings in the digital and creative sector ... 68
vii
GLOSSARY
This report uses data from several sources and uses a definition of the sector depending upon which data sources are available.
PRINCIPAL DATA SOURCES
Employer Perspectives Survey 2010 (EPS 2010)
The UK Commission’s Employer Perspectives Survey 2010 gathered the views of approximately 14,500 employers on the UK’s employment and skills system. The aim of the survey is to provide evidence to stakeholders operating in the system across the four UK nations to inform policy and improve service delivery.
http://www.ukces.org.uk/publications/er25-employer-perspectives-survey
The UK Commission’s UK Employers Skills Survey 2011 (ESS 2011)
The UK Commission’s UK Employer Skills Survey (UK Commission 2012) provides UK-wide data on skills deficiencies and workforce development across the UK on a
comparable basis. It was undertaken at the establishment level and involved over 87,500 interviews, with a follow up survey of over 11,000 employers focusing on employers’ expenditures on training.
http://www.ukces.org.uk/publications/employer-skills-survey-2011
Working Futures Database
Working Futures 2010-2020 (Wilson and Homenidou, 2011) is the most detailed and comprehensive set of UK labour market forecasts available. The results provide a picture of employment prospects by industry, occupation, qualification level, gender and
employment status for the UK and for nations and English regions up to 2020. The database used to produce the projections is held by the University of Warwick Institute for Employment Research and Cambridge Econometrics.
http://www.ukces.org.uk/assets/ukces/docs/publications/evidence-report-41-working-futures-2010-2020.pdf Labour Force Survey
The Labour Force Survey (LFS) is a quarterly sample survey of households living at private addresses in the United Kingdom. Its purpose is to provide information on the UK labour market that can then be used to develop, manage, evaluate and report on labour market policies. It is conducted by the Office for National Statistics. Figures quoted in this report are based on a four quarter average.
http://www.ons.gov.uk/ons/guide-method/surveys/respondents/household/labour-force-survey/index.html
SECTOR DEFINITION
The definition of the sector used in this report is given in the table below.
Digital technology Creative media and entertainment
SIC07 code Description SIC07 code Description
61 Telecommunications 58 Publishing 62 Computer programming, consultancy and related activities 59 Motion pictures
63 Information Service activities 60 Programming and broadcasting 95 Repair of computers and other goods 73 Advertising and market research
viii
Executive Summary
Introduction
This report examines the digital and creative sector in the UK, the challenges it faces over the medium term and how they can be addressed through skill development and thereby bring about growth and contribute to the recovery of the UK economy.
The sector comprises digital technology, and creative activities. The digital technology sub-sector provides the infrastructure and platforms through which creative content is often delivered. While the creative industries include film, TV, radio, computer games, publishing, advertising, music, performing/visual arts, design and cultural heritage. Over the years there has been greater synergy between the digital and creative sub-sectors. For instance, digital technology is transforming the creative sector (particularly creative media industries) as well as being an important driver behind the growth of ICT products and services.
The importance of the sector
The UK’s digital and creative sector makes a significant direct and indirect contribution to the UK economy.
• The net output of the sector in 2010 was £92billion, eight per cent of the UK total
having grown by 2.5 per cent per annum over the previous ten years, faster than the economy as a whole (Wilson and Homenidou, 2011). Productivity in the digital sub-sector is almost three times the national average and above average in the creative sub-sector (UKCES, forthcoming a).
• Employment in the sector accounted for around six per cent of total employment in
the UK in 2010, (Wilson and Homenidou, 2011). This is above the EU-27 average of 4% (Eurostat, 2011).
• The UK’s digital technology sector is ranked 6th in the world in terms of its
competitiveness (e-skills et al. 2009), and the UK has the largest creative sector in Europe (eg IPA, 2009, IFPI, 2009, UK Film Council 2009). Both components are major exporters.
• The sector was one of the fastest to recover following the recession of the early
ix
The 1.9 million people who work in the sector are much better qualified than average. One third work in professional occupations compared with a fifth in the labour market as a whole. Employment is focussed on small workplaces, particularly in the creative sub-sector, and there is a relatively large number of self-employed workers across the sector. Men are far more likely than women to work in the digital sub-sector while the gender profile in the creative sub-sector is more balanced and in keeping with the national picture. The digital sector therefore draws on only a fraction of the nation’s talent pool. The workforce as a whole is relatively young, though older in the digital sub-sector and there may be a need to replace skills as the existing workforce retires.
Key Challenges
A key challenge facing the digital and creative sector is to maximise its competitive advantage by not just keeping pace with technological and other innovations but leading them whilst at the same time meeting consumers’ expectations. This means investing in the quality of the consumers’ experience, taking advantage of technological change and exploiting the synergies between digital technology and creative content. At the same time businesses will need to protect their copyright and intellectual property rights. Creating sustainable businesses in a world where many expect unlimited access to content without being charged is a major challenge.
Skill demand
x
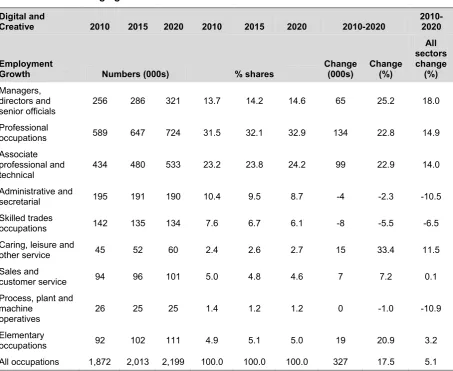
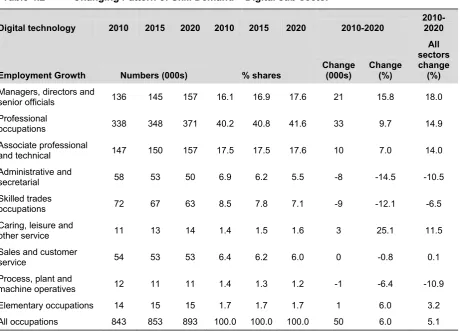
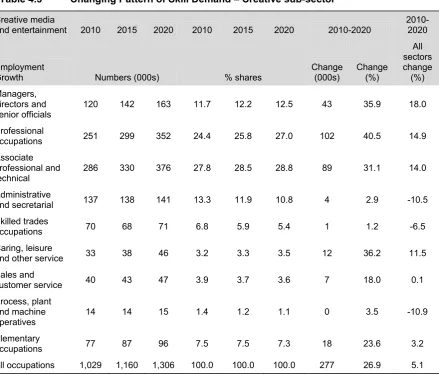
Employment projections for the sector as a whole indicate that there will be growing need for high level skills. It is expected that there will be 300,000 more managers, professionals, and associate professional occupations between 2010 and 2020 as the sector grows – an increase of over 20 per cent on the 2010 employment levels. In addition to meeting this expansion demand as the sector grows, there will also be the need to meet replacement demands as individuals leave the sector. Replacement demands are projected to be even greater than the expansion demands for managerial, professional and associate professionals. As a result, there is a total requirement for these three occupational groups of just under 800,000 between 2010 and 2020, 300,000 in the digital sub-sector, and just under 500,000 in the creative sub-sector.
A key challenge for the sector will be to ensure that its skills supply chain, through initial, secondary and tertiary education, through the vocational educational and training system and through ongoing workplace development generates both the quantity and the quality of skills to meet these growing demands.
Skills Supply
Applications to computing and IT courses are in decline and the quantity of graduates
may not be sufficient to meet the growing demand for professional and technical skills. Women make up only 15 per cent of the intake to computing-related courses. The number of creative graduates is rising and the majority are female. However employers are concerned about the quality of their education and whether they finish their studies with right sort of skills that employers want, particularly in fast-moving sectors such as visual effects. Apprenticeship numbers have risen rapidly in recent years, from a low base, particularly at advanced level although the numbers of higher-level apprenticeships is still very low.
Much of the training carried out in the sector is done informally, therefore relatively few employers arrange training for their staff in the sector compared with the economy as a whole, particularly training that leads to national recognised qualifications. The proportion of the workforce receiving formal training is also below average and falling. Despite the large proportion of digital and creative employees in managerial, professional or associate professional jobs the proportion of in receipt of work-related training is well below average and digital and management training is less available than in other sectors.
xi
Generally digital and creative employers tend to adopt a less formal approach to the development of their employees, although their employees are more likely to benefit from job autonomy and flexibility.
Conclusion: growth through skills
The evidence that indicates that skill demand exceeds supply in the digital sub-sector, particularly for highly qualified and experienced professional and technical staff, includes high average wages, persistent reports of skill shortages (some severe) and the use of migrant labour.
Part of the problem would appear to be related to a relative shortfall in the quantity of initial supply particularly for higher-level skills in the digital sub-sector. Other problems include: the quality of graduates in the creative sub-sector; getting employers to invest more in workplace training to enable employees to have the opportunity to refresh their technical skills in a fast-changing environment; and findings ways for the large number of small employers and free-lancers in the sector to work together to provide workplace training more efficiently
Employers can play a significant role in meeting these changes through:
• Widening their recruitment pool and, for instance, encouraging more women to
develop the skills to work in the digital sub-sector
• Helping to develop more high-level entry routes into the sector for example through
apprenticeships
• Helping improve the quality of information, advice and guidance available for people
interested in or already working in the sector
• Improving working environments through further high performance working
• Working more closely with education and training providers
• Working with providers to accredit courses
• Providing work experience placements
• Providing more in-house training and continuous professional development
• Collaborating with other employers to develop training solutions more effectively
1
1
The Economic and Policy Climate
Increasingly, the competitiveness of advanced industrial nations is explained with reference to the capabilities of their respective labour forces. Hence, national education and training systems are seen as providing comparative economic advantages. It is notable that over the recent past education and training have taken centre stage in policies designed to foster the UK’s competitiveness and lie at the heart of the current Government’s plans to kick start the recovery against a backdrop of challenging global economic conditions. To understand the role skills development might play in stimulating growth within the digital and creative sector requires some consideration of the current economic situation and current skills policy.
In 2012 the UK economy, and indeed the global economy, is still coming to terms with the repercussions of the 2008/9 economic recession. By comparison with previous recessions, 2008/9 was relatively deep and it continues to cast a long shadow over the country’s medium-term economic prospects (see Table 1.1). The economic climate at the time of the 2008/9 recession and in the period afterwards has been characterised by low interest rates and a depreciation of sterling against other currencies, notably the dollar and the euro. Whilst these would usually be sufficient to give a fillip to the economy by boosting demand and, given time, increasing output, the potential for export led growth has been seriously undermined by continuing weak demand conditions across the global economy, especially in the Eurozone and the USA. Also the difficulties households and businesses have had gaining access to finance as the banks have sought to increase their capital has restricted growth. Moreover, the markets’ continuing disquiet over developments in the Eurozone has contributed further to the climate of uncertainty in the global economy thereby further dampening demand.
Table 1.1 Four recent periods of recession in the UK
Start date Date of bottom of recession
Length of period from start to bottom
of recession Total decline in GDP (%)
Time taken for GDP to recover to level at start of
recession
1 1974 Q4 1975 Q3 4 Quarters 3.8 7 Quarters
2 1980 Q1 1980 Q4 4 Quarters 5.9 13 Quarters
3 1990 Q3 1992 Q2 8 Quarters 2.3 11 Quarters
4 2008 Q2 2009 Q1 6 Quarters 6.3 ?
2
As a consequence of the above developments, the rapid acceleration in growth observed after the recessions of the early 1980s and 1990s has failed to materialise and the UK has slipped back in to recession at the start of 2012. Nevertheless the economy is expected to resume its long-run growth path over time (see Figure 1.1) but in order to do so there are specific steps the UK economy needs to take. The UK Treasury has identified a number of weaknesses which need to be addressed if a sustained recovery is to be achieved (BIS, HM Treasury 2011):
i. the level of debt funded household consumption;
ii. the share of the economy accounted for by the public sector;
iii. weak business investment;
iv. an over-dependence upon financial and business services; and
v. unbalanced regional growth.
Government has identified four ambitions which need to be realised in order to restore long-term sustainable growth (BIS, HM Treasury 2011):
vi. creating the most competitive tax system in the G20;
vii. making the UK one of the best places in Europe to start, finance and grow a business;
viii. an over-dependence upon financial and business services; and
ix. creating a more educated workforce that is the most flexible in Europe.
Therefore, the role of skills in national economic policy is clearly an essential one; to bring about recovery and sustainability by creating jobs and growth.
3
Figure 1.1 Employment and Gross Value-Added 1978 - 2020
Source: Wilson and Homenidou (2011)
At a time when capital investments are constrained as a consequence of problems in the global banking system, investments in skills, and human resources more generally, made through programmes such as Apprenticeships and Investors in People, and funded through initiatives such as the Growth and Innovation Fund, may be the most amenable to employers.
Based on the latest evidence available, this report considers the specific situation in the Digital and Creative sector to provide:
• an overview of the size and structure of the sector and the principal drivers of change over the medium term which are likely to have some bearing upon skill demand;
• an outline of current and expected patterns of skill demand in the sector;
• a description of skills supply and how this has adapted to changing patterns of skill
demand;
• an analysis of mismatches between the demand for, and supply of skills, and the
implications of this for the sector.
In conclusion, the report identifies the performance challenges faced by the sector and highlights the skills solutions available to address them thereby delivering increased levels of growth and contributing to the recovery of the UK economy.
20000 22000 24000 26000 28000 30000 32000 34000
400000 600000 800000 1000000 1200000 1400000 1600000
Em
pl
oym
en
t (
000s)
G
VA (
£m
)
4
2
The Importance of the Sector
The UK’s digital and creative sector is a global leader. It was one of eight key sectors addressed in the Government’s first growth review (BIS, HM Treasury 2011, p. 41), reflecting the fact that it makes a significant contribution to the economy. Harnessing the potential of the sector will be crucial to the UK’s future competitiveness and prosperity. It already makes a significant contribution to the output of the economy, and employs 1.9 million people (approximately one in 14 workers), many of whom are highly skilled. Estimates indicate that 55 per cent of UK Gross Value Added (GVA) comes from technology-intensive sectors in the economy. Growth in technology occupations over the past ten years has been twice the average for the whole economy.
Within the sector there are two broad components: digital technology, and creative activities. The digital technology sub-sector provides the infrastructure and platforms through which creative content is often delivered. Creative industries cover film, TV, radio, animation, photo imaging, interactive content design, computer games, commercials, pop promos, publishing, advertising, music, performing/visual arts, design and cultural heritage.
Table 2.1 summarises the definition of the sector used in the analysis. It should be noted that this definition spans the footprints of three Sector Skills Councils (SSCs) that
represent employers in the sector1. Labour market intelligence provided by these SSCs
has been used to inform the analysis in this report.
Digital technology is transforming the creative sector (particularly creative media industries) and the business models it uses, but also digital content is an important driver behind the growth of ICT products and services. Both the technology and creative components will need to respond effectively to the opportunities posed by globalisation and advances in digital technology. One of the challenges for the sector is to ensure it has the high levels of skills and technical capability to make the most of the opportunities available, to underpin future economic growth and provide interesting and fulfilling jobs.
1 Three SSCs represent employers covered by the Digital and Creative Sector: e-skills UK covering (information and
5
Table 2.1 Definition of the Digital and Creative Sector
Digital technology Creative media and entertainment
SIC07 code Description SIC07 code Description
61 Telecommunications 58 Publishing
62 Computer programming, consultancy and related activities 59 Motion pictures
63 Information Service activities 60 Programming and broadcasting
95 Repair of computers and other goods 73 Advertising and market research
74 Other professional scientific and technical activities (nb: includes design, photographic, translation) 90 Creative arts and entertainment 91 Libraries, archives, museums, etc
Source : UKCES forthcoming a and b
2.1
Overall Output and Employment Performance
Table 2.2 highlights key output and employment indicators for the digital and creative sector over the last ten years, and projections for the coming decade.
Looking at net output first, the sector contributed £92 billion in 2010 (2006 prices), nine per cent of the UK total. Output had risen steadily, by 2.5 per cent per year on average, between 2000 and 2010. Future prospects look even brighter, and output from the sector is projected to grow by over five per cent per year to 2020.
The sector’s workforce grew steadily throughout the last decade but at a slower rate than output, at 0.9 per cent per year. However, nearly all of this growth was among the self-employed, whose numbers increased by over four per cent per year between 2000 and 2010, and the number of full-time workers fell very slightly over this period. Looking towards 2020, much of the growth will again be among the self-employed, although the full-time workforce is also expected to increase. Future employment increases are expected to be more marked among the female workforce than the male workforce, a reversal of the trend over the last ten years.
6
Table 2.2 Key Output and Employment Indicators
Digital and Creative 2010 level
Growth rate:
2000-2010
(% p.a.) (absolute) Changes
Growth: 2010-2020
(%)
Growth rate: 2010-2020
(% p.a.) (absolute) Changes
Output (£2006m) 91,798 2.5 20,134 70.4 5.5 64,609 Employment 1,871,940 0.9 155,985 17.5 1.6 326,964 Part time employment 264,567 0.3 8,194 20.2 1.9 53,456 Full time employment 1,121,824 -0.1 -8,461 9.1 0.9 101,802 Self employment 485,549 4.0 156,252 35.4 3.1 171,706 Male employment 1,197,032 1.5 166,925 14.2 1.3 170,458 Female employment 674,908 -0.2 -10,940 23.2 2.1 156,506
Source: Wilson and Homenidou (2011) Definition: see Table 2.1
7
Figure 2.1 Trends in Employment and Output (Digital and Creative)
Source: Wilson and Homenidou (2011) Definition: see Table 2.1
The trends and projections for the two sub-sectors are presented in Figures 2.2 and 2.3. Employment in the digital sub-sector increased rapidly in the second half of the 1990s, although since the early part of the 2000s it has fluctuated around 900,000. This is in contrast to the creative sub-sector, which has experienced a less rapid but more consistent increase in employment levels since 1990. For the UK as a whole average annual employment growth was slow in the decade to 2000 (0.1%) but accelerated to 2010 (0.4%).
Output in the digital sub-sector increased by over 400% between 1990 and 2008, and is projected to increase at a similarly fast pace between now and 2020. For the UK as a whole output increased by 47% between 1990 and 2008 and is forecast to increase by around 30% to 2020. Output in the creative sub-sector has grown at a slower pace than in the digital sub-sector, with output increasing by 90% between 1990 and 2008, although the rate of growth between 2010 and 2020 is projected to be very close to the rate in the digital sub-sector.
So the two sub-sectors have different trajectories: output in the digital sector is growing fast but employment is relatively flat, while in the creative sub-sector both output and employment are rising but at a steadier pace.
Digital and Creative
0 500 1,000 1,500 2,000 2,500
1990 1995 2000 2005 2010 2015 2020
Employment (000s)
0 20,000 40,000 60,000 80,000 100,000 120,000 140,000 160,000 180,000
Output (£2006m)
[image:20.595.80.504.61.332.2]8
Figure 2.2 Trends in Employment and Output (Digital)
Source: Wilson and Homenidou (2011) Definition: see Table 2.1
Figure 2.3 Trends in Employment and Output (Creative media and entertainment)
Source: Wilson and Homenidou (2011) Definition: see Table 2.1
Digital technology
0 100 200 300 400 500 600 700 800 900 1,000
1990 1995 2000 2005 2010 2015 2020
Employment (000s)
0 20,000 40,000 60,000 80,000 100,000 120,000
Output (£2006m)
Employment Output
Creative media and entertainment
0 200 400 600 800 1,000 1,200 1,400
1990 1995 2000 2005 2010 2015 2020
Employment (000s)
0 10,000 20,000 30,000 40,000 50,000 60,000
Output (£2006m)
[image:21.595.78.512.412.684.2]9
2.2
Employment structure
Jobs in the digital and creative sector tend to be high level and the workforce is generally well qualified and, in the digital sub-sector, predominantly male. In this section we look in more detail at the employment structure of the sector based on 2010 figures.
Employment by occupation and qualification level
The digital and creative workforce is concentrated in the higher level occupational groups, and is highly qualified, as Figures 2.4 and 2.5 show.
[image:22.595.80.515.462.722.2]Nearly one third of workers in the digital and creative sector work in professional occupations, compared to one fifth of workers across all sectors, and the proportion of workers in associate professional and technical occupations, at 23 per cent, is also considerably higher than the overall proportion of 13 per cent (Figure 2.4). There are also an above average proportion of managers in the digital and creative sector. There are differences in the occupational profile of the two sub-sectors, with a higher proportion of professional workers in the digital technology sector (40 per cent, compared with 24 per cent in the creative and media sector), and a lower proportion of associate professional in the digital technology sector (17 per cent, compared with 28 per cent in the creative media sector).
Figure 2.4 Employment by Occupation, Digital and Creative, 2010
Source: Wilson and Homenidou (2011) Definition: see Table 2.1
13.7 7.6 2.4 5.0 1.4 4.9 11.6 8.9 8.6 6.4 10.4 10.4 31.5 23.2 12.1 12.9 9.9 19.2 0 5 10 15 20 25 30 35 M anager s, di rec tor s and seni or of fic ia ls P rof es si onal oc cupat ions Asso ci at e pr of es si onal and t ec hni cal Ad mi ni st ra tive and sec ret ar ial S ki lled t rades oc cupat ions C ar ing, lei sur e and ot he r se rvi ce S al es and cus tom er se rvi ce Pro ce ss, pl ant and m ac hi ne oper at iv es E lem ent ar y oc cupat ions % o f t ot al e m pl oy m en t
10
[image:23.595.84.515.187.450.2]Turning to the qualification profile of the sector’s workforce, over 40 per cent of workers are qualified to at least first degree level or equivalent, compared with 24 per cent of the workforce as a whole. More than a quarter of the sector’s workforce has a first degree or equivalent (15 per cent across all sectors), and 15 per cent have a post-graduate qualification (nine per cent across all sectors). There is little difference between the two sub-sectors in their occupational profile, despite the different occupational structures.
Figure 2.5 Employment by Qualification, Digital and Creative, 2010
Source: Wilson and Homenidou (2011) Definition: see Table 2.1
Employment by size of employer
There are 266,000 establishments in the sector, making up 10 per cent of all establishments in the UK (UKCES forthcoming b). The distribution of employment by the size of employer in the digital and creative sector is shown in Figure 2.6. The size profile is very similar to the profile across all sectors, with 37 per cent of workers in firms with fewer than 25 employees (36 per cent across all sectors), and 17 per cent of workers in large firms with 500 or more employees (18 per cent across all sectors).
Employment in the creative sub-sector is more concentrated among smaller firms than it is in the digital sub-sector – 40 per cent of creative employment is in small firms with fewer than 25 employees compared to 35 per cent of digital employment, and only 15 per cent of creative employment is in the largest firms with 500 or more employees compared to 19 per cent of digital employment (data from an average of the four quarters of the
1.6
13.1
27.1
4.4 6.4 5.2
1.2 8.1 5.5 4.6 21.0 19.8 15.5 9.3 16.5 14.3 11.4 14.9 0 5 10 15 20 25 30 QCF8
Doctorate QCF7 Other higher degree QCF6 First degree QCF5 Foundation degree; Nursing; Teaching QCF4 HE below degree level QCF3 A level & equivalent QCF2 GCSE (A-C)& equivalent QCF1 GCSE (below grade C) & equivalent No qualific-ation % o f t ot al e m pl oy m en t
11
[image:24.595.82.516.190.466.2]2010 Labour Force Survey). Further evidence of the nature of the sector comes from data from the Inter-departmental Business Register which shows that 83 per cent of firms in the digital and creative sectors employ fewer than 10 people, compared with 74 per cent of firms across the economy as a whole. The relatively large number of sole traders/freelancers in the creative sector in particular, which gives the creative sub-sector a particular dynamic (UKCES, 2010), is discussed further in section 2.6.
Figure 2.6 Size Structure of Employment (% of employment by employer size band)
Source: Labour Force Survey, 2010 (average of four quarters)
The sector has a relatively high number of business start-ups, compared with other sectors indicating its vibrancy. Although there were a quarter more business closures than start-ups in 2009 in the digital sub-sector (UKCES forthcoming a), the number of start-ups outweighed the number of closures in the creative side of the sector (UKCES forthcoming b)
Employment by gender
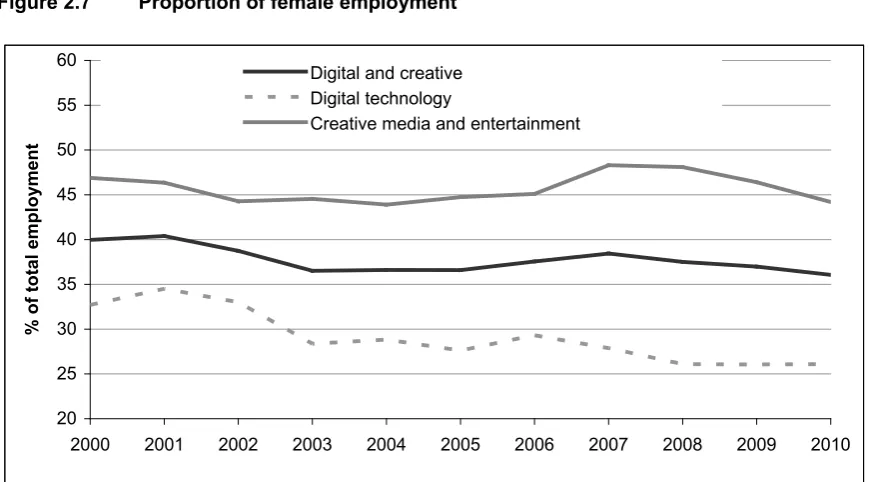
Employment in the digital sub-sector is male dominated, and has been becoming increasingly so in the last few years shown in figure 2.7. The proportion of female workers in the digital sub-sector stood at 26 per cent in 2010, down from 33 per cent a decade earlier. On the creative side there is a much more balanced gender breakdown, with the proportion of women just under the overall average of 46 per cent. Across the sector as a whole, the proportion of female employment has fluctuated between 35 per cent and 40 per cent over the last ten years.
37.0
11.7
24.8
9.6
16.9
35.8
13.4
24.5
8.9
17.5
0 5 10 15 20 25 30 35 40
Under 25
25 to 49
50 to 249
250 to 500
500 or more
% total employment
Digital and Creative
12
Figure 2.7 Proportion of female employment
Source: Labour Force Survey, 2010 (average of four quarters)
Employment by age
Figure 2.8 shows the age structure of the digital and creative workforce in comparison with the structure across all sectors. Employment is concentrated among those aged 25 to 44, who make up 55 per cent of the sector’s workforce, compared to 46 per cent of all workers across the economy. There are relatively few young workers aged under 25 in the digital and creative sector, eight per cent compared to 13 per cent across all sectors.
Figure 2.8 Age Structure of Workforce
Source: Labour Force Survey, 2010 (average of four quarters)
20 25 30 35 40 45 50 55 60
2000 2001 2002 2003 2004 2005 2006 2007 2008 2009 2010
% o f t ot al e m pl oy m en t
Digital and creative Digital technology
Creative media and entertainment
8.5 26.2 29.2 28.5 4.7 2.9 12.9 21.9 24.4 32.3 5.7 2.9
0 5 10 15 20 25 30 35
Under 25
25 to 34
35 to 44
45 to 59
60 to 64
65 or over
% of total employment
13
The digital technology sub-sector has an older age profile than the creative media and entertainment sub-sector, and the age profile in the former is getting older. The increasing need for hybrid technical/business capability, driven partly by globalisation, means the digital technology sector often favours workers with previous business experience over younger workers straight from education, and when employers do recruit leavers from education the preference is for graduates rather than school or college leavers; by contrast, many parts of the creative sector, such as advertising, music and design, have a young age profile with the majority of the workforce aged under 40 (e-skills UK et al., 2009).
2.3
Self-employment and working hours
There is a high incidence of self-employment in the digital and creative sector, compared to most other sectors and the economy as a whole, and the incidence of self-employment has been increasing in recent years. Self-employment accounts for nearly a quarter of total employment in the sector, compared to around 14 per cent across the whole economy (see Figure 2.9). There is substantial variation within the sector (by Sector Skills Council), with self-employment accounting for 31 per cent of the creative sector and 16 per cent of the digital technology sector (UKCES, forthcoming a and b).
The high proportion of self-employed workers in the sector presents a performance challenge for the sector, as self-employed workers are half as likely as employees to participate in work-related training or education (Meager et al., 2011). There are particular issues around fear of losing work through committing time to training in advance, and having to pay training fees themselves (UKCES, forthcoming b).
Figure 2.9 Incidence of self-employment
0 5 10 15 20 25 30 35 40 45 50 55 60
2002 2003 2004 2005 2006 2007 2008 2009
%
o
f t
ot
al
e
m
pl
oy
m
ent
14
Source: Labour Force Survey; UKCES (2011)
There is a similar pattern when looking at part-time working, with a low incidence in the digital sub-sector, at around 10 per cent of the workforce compared to 26 per cent across all sectors, but a much higher incidence of part-time working in the creative sub-sector.
2.4
Distribution of Employment by Nation and Region
Figure 2.10 shows the geographical distribution of employment in the digital and creative sector. Nine out of ten workers in the sector are located in England with London and the South East accounting for over half of all workers in England, whereas across all sectors 85 per cent of workers are in England and just over a third of these are in London and the South East. Digital sector employment in London and the South East is split evenly between the two regions, while in the creative sub-sector the greatest concentration of jobs is found in London, which accounts for 40 per cent of all creative sector employment in England. Relatively few digital and creative workers are based in the North East of England, Wales (although there is a creative cluster in Cardiff), or Northern Ireland. There is a growing digital and creative sector in North West England, partly related to the BBC’s decision to relocate a significant element of its facilities to Salford in Manchester.
Figure 2.10: Employment by nation and region for the digital and creative sector
Source: Wilson and Homenidou (2011)
33 19
9 8 8 6 6
8 3
3
7 1
0 5 10 15 20 25 30 35
London South East East South West West Mids East Mids Yorks/Hum North West North East Wales Scotland NI
15
2.5
International Standing of the Sector
The UK is in a strong position to take advantage of the opportunities of the digital and creative economy. Its levels of IT competitiveness are high and it has what has been described as ‘probably the largest creative sector in the world’ in relation to national GDP (Work Foundation, 2007).
The Economist Intelligence Unit’s (EIU) annual benchmarking (quoted in e-skills et al.,
2009) shows the UK to be 6th out of 66 countries in terms of global IT competitiveness in 2009, behind the US, Finland, Sweden, Canada and the Netherlands. Within the overall benchmarking, the UK’s best ranking was 3rd on the human capital indicator, behind the US and South Korea. An important element within this indicator was the capacity to develop the business skills as well as the mainstream IT skills of technology professionals.
The UK’s performance on other indicators was:
• ‘support for the IT industry’ (UK ranked 4th);
• ’IT infrastructure’ (6th);
• ‘overall business environment’ (7th);
• ‘legal environment’ (11th); and
• ‘innovation’ (12th).
The UK’s relatively poor performance in terms of the last two indicators is attributed, in part, to differing approaches to protection of Intellectual Property. The EIU’s report points out that patent proceeding costs are up to five times higher in the UK than in Germany, and that these high costs can be prohibitive, especially for SMEs, and may also be a problem for the self-employed who are particularly common in the digital and creative sector (e-skills UK et al., 2009).
16
Turning to the creative sectors, the UK is the largest producer of TV & Radio content in Europe, with only the US generating more value from TV exports. It has the largest publishing industry in Europe, and the third largest filmed entertainment market globally, after the USA and Japan. In 2008, almost one in six film viewings at cinemas globally was of a British film, equalling 15 per cent of the global box office (UK Film Council, 2009). Other world-leading creative sub-sectors include:
• Advertising. The UK is the third biggest market in the world after the USA and Japan,
with London overwhelmingly chosen as the European hub for major agencies. The UK advertising market has the largest share of internet advertising revenue of any market in the world, including the USA, at 14 per cent (IPA, 2009).
• Music. The UK is the 4th largest producer, behind the US, Japan, Germany (Creative
& Cultural Skills research). Digital sales account for 16 per cent of the UK music market, which is, in terms of proportion of domestic market, the third largest in the world (behind the US at 39 per cent and Japan at 19 per cent) (IFPI 2009).
• Design. The UK is currently rated as 4th in the world behind only the US, Japan and
Korea (International Design Scoreboard: Initial Indicators of International Design Capabilities, IFM and University of Cambridge).
Exports from across the creative industries are estimated to be worth £8.9 billion annually to the UK economy, 10.6 per cent of all service sector exports (DCMS, 2011).
Around six per cent of people are employed in the digital and creative sector in the UK. This is a higher proportion than the average for all EU countries of four per cent (Eurostat, 2011). Only Iceland and Denmark at seven per cent have a greater proportion of their employment in the sector than the UK.
2.6
Conclusion
The digital and creative sector makes a significant contribution to the UK economy. Its output has been growing rapidly for the last two decades. There is a growing synergy between the two sectors as digital technology transforms the creative media industries. In addition to its direct contribution, better use of technology can underpin significant productivity gains across the economy as a whole.
17
The structure of employment is different to that in the rest of the UK economy, with self-employment being more common, reflecting the dynamism of parts of the sector, and low levels of employment amongst women, particularly in the digital sub-sector. The creative workforce is on average younger and more likely to work for small organisations or be self-employed. However, the growing age of the digital workforce suggests that there may be a need to replace skills as the existing workforce retires.
18
3
Key Developments in the Sector over the
Medium Term
The previous chapter demonstrated the success the sector has experienced over the last few years. Its ability to continue that trajectory will depend on the sector’s ability to capitalise on future technological and business developments, which means that skill levels have to keep pace.
In the short-term, the impact of the economic downturn will have implications for the sector’s performance in the years to come whilst other issues which have been important for the industry in recent years will continue to present challenges and many will become increasingly important.
This section considers these key developments. Because of the differences between the two sub-sectors, the developments they face are considered separately.
3.1 Digital technology
Although the recession has affected all sectors, the employment of technology professionals has held up well, with the numbers increasing slightly between 2008 and 2009. The key reasons for this relatively strong performance include the adoption of increasingly flexible business models following the bursting of the dotcom bubble, the critical nature of technology systems for companies across all sectors, and the growing understanding of the potential of digital technology to help companies weather the downturn. Spending on software and services has been relatively resilient, compared to expenditure on hardware by both consumers and businesses, although small firms may suffer from limited capital availability.
19
Investment, innovation and R&D
Private sector investment in IT is still rising despite the current economic conditions. Private sector investment in IT rose by nine per cent during the final quarter of 2010 and at £3.4bn the level of investment was eight per cent higher than during the final quarter of 2009 and only five per cent below the level recorded in the fourth quarter of 2007, i.e. the equivalent, pre-recessionary quarter (e-skills UK, 2011a).
Technological innovation is pervasive. New developments occur at a rapid pace. Moore’s law (described by Intel executive Gordon E. Moore in a 1965 paper (Moore, G, 1965)) suggests that computing capacity doubles every two years and similarly other digital developments such as the number and size of pixels in digital cameras occur at a similar speed. Such innovation requires continual skill development among technology professionals and technicians and also has implications for technology users. Technological breakthroughs create opportunities to develop new products and services. Innovation also leads to new design and production and service delivery processes as well as cultural attitudes in the workplace and society towards new ways of working or collaborating.
Customers’ needs and wants can better shape the services they use and products they consume if technology helps inform suppliers. And the ability of IT & Telecoms professionals to enable greater information about customer wants and provider capabilities is key. New horizons in terms of the technology (or product or service) is one aspect, but there are also new horizons in terms of changing tastes (i.e. markets). New, less capital intensive technologies like cloud computing and “Software as a Service” (SaaS) make innovation easier because it requires less up-front investment by a firm, and the development of innovative enabling technologies like these will in turn foster further innovations (e-skills UK, 2011b).
20
Strategic role of management skills
There is very strong evidence that management is one of the most influential factors in achieving higher performance (Garrett et al., 2010), Management skills play a key role in how well digital firms can respond to the challenges presented above. In Chapter 2 we saw that the sector had a relatively high proportion of managers. The main development need for this group identified in the e-skills UK employer survey (e-skills UK, 2011b) is around programme management, supplier management, and service management and delivery at a senior level.
Other challenges
The data in Chapter 2 also indicated that the workforce in the digital sub-sector was considerably older on average than that in the creative sub-sector. Over the medium term, as the digital workforce ages and retires there will be an increasing need to attract new recruits to the sector to replace them (replacement demand) Similarly, as technology continues to develop at a rapid rate, skills and knowledge have to keep pace. To meet these demands the sector will need to draw on the widest pool of talent to maintain its global status.
3.2 Creative
Some parts of the creative sub-sector have been hit been hit relatively hard during the recession, particularly TV and advertising. Advertising and public relations managers have been one of the fastest declining occupations since the start of the recession, recording a fall in numbers of 30 per cent (UKCES, 2010).
21
Domestically the ‘experience’ economy – live performances, live theatre, museum visits etc. – has grown throughout the last decade including through the recession, and people’s consumption of entertainment, art and literature has continued to grow despite them cutting back on expenditure in other areas. Analysis of the sector’s performance following the 1990s recession showed that the cultural sector performed better than the economy as a whole (UKCES, 2010).
Investment, innovation and R&D
The creative sector is characterised as having high rates of innovation. Research from Nesta shows the creative industries are one of the most innovative sectors in the economy. However, it has been challenging to measure innovation in the creative industries because of both the pace of change and the changing nature of innovation, which is embedding the innovations of creative businesses across other sectors of the economy, and expanding their future economic reach and potential. Detailed case studies show that digitisation is driving innovation in the creative industries, and firms who are investing heavily in research and development (R&D), and devoting large numbers of their staff to technology intensive activities are benefiting most from this digital revolution (Nesta 2010).
One approach to help foster innovation in the sector is the promotion of clusters. These can take the form of individual sub-sector or complementary sub-sectors brought together through value chain linkages and shared infrastructures. The policy challenge is to identify existing clusters as building clusters up from scratch is far more difficult, and to help remove barriers to collaboration through the use of public services, training and higher education (Nesta, 20102).
The skills challenge is to continually renew the sectors skill base to both help generate and make the most of the high rates of innovation.
Links across the sector
2 The research identified clusters of creative industries across the country using a variety of data and conducted
22
The digital environment is fundamentally driving the business models of companies in the creative industries. There is rapid movement to a world where creative content is conceived, published, distributed, advertised and consumed digitally. The online environment erodes geographic boundaries and is causing a revolution for both producers and users. Ubiquity of broadband coverage, the availability of high quality mobile devices and the interactivity offered by Web 2.0 have changed the way individuals consume content.
Businesses using traditional business models and linear value chains from the analogue age are increasingly finding themselves ill-equipped to succeed. For creators of content, new ‘digital’ business models are increasingly viewed as the future in terms of both production and revenue. However, control over assets is problematic, with traditional approaches to copyright and intellectual property rights not necessarily effective in the online environment. Peer sharing and piracy are significantly challenging content creators’ ability to earn from their own intellectual property. Creating sustainable businesses in a world where many expect unlimited access to content without being charged is a major challenge.
‘The good thing is we're sitting on the hottest currency in the digital age – music. Lots of the Web 2.0 destinations are driven by music - MySpace, YouTube, there are tons of those destinations. The bad news is it's damn hard to make money.’ Marcel Engh, Sony Music Europe,2009 (e-skills et al., 2009)
The role of skills in overall competitiveness
The extent and pace of innovation is a significant, if not the biggest, driver of skill needs in the sub-sector. Not only does the workforce need the creative skills to generate content, but also the business skills to make money under the new business models. The ability to create sustainable business models by monetising intellectual property in a digital environment are critical to survival. This depends on business skills, understanding of intellectual property legislation globally, and a grasp of the strategic potential of technology. An additional skill need is the ability to understand and exploit digital technological advances, and new skills are needed to meet demand for quality content on
any platform.
23
Management skills play a key role in how well creative firms respond to the challenges presented above, and there is strong evidence across all sectors that management is a key influence in achieving higher performance (Garrett et al., 2010). Management and leadership skills to take advantage of and monetise digital content in the new business models are a priority for the sector. They are also important in relation to project and production management for multi-platform development, and gaps in negotiation and leadership skills are frequently associated with the challenges of managing the change from traditional to digital methods of distribution. The sector has to compete with the rest of the economy for generic management skills.
3.3 Conclusion
Investment in research and development and innovation will underpin the future success of the sector especially as the synergies between digital technologies and creative content and activities continue to grow exponentially.
These developments create rapidly changing sets of skills needs to work with new technologies and deliver creative content at a technical and professional level. At the same time there is a need to manage the process of development and innovation which includes the skills associated with managing projects, protecting intellectual property and commercialising innovation. The link between these two skill sets is sometimes referred to as being ‘T’ shaped (see for example UKCES forthcoming b), ie having the technical depth and the commercial breadth to maximise business opportunities. On top of both of these broad skill sets is the need to lead and manage at a strategic level, to set goals, co-ordinate activity and ensure performance and delivery.
24
4
Employment and Skill Demand in the Sector
The last chapter examined some of the key developments across the sector and drew out the implications for skill demand in general terms. In this chapter we look in more detail at other factors affecting the demand for skills in the years ahead
4.1
The Changing Demand for Employment
As we found in Section 2, employment in the digital and creative sector has experienced only a minor fall since the onset of the recession. However the share of self-employment has been increasing, driven in part by people who are made redundant from the sector setting up as freelancers. Between 2002 and 2009, the self-employed share of employment in the digital and creative sector has increased from 19 per cent to 23 per cent. This is compared to growth in self-employment across all sectors from 12 per cent in 2002 to 13 per cent in 2009.
4.2
Factors Affecting the Demand for Skills
The National Strategic Skills Audit (UKCES, 2010) provides a common framework to identify the drivers of change that will impact on the in the UK in the future. The drivers indicate the nature and direction of travel and provide a broad analysis to help reveal the implications for jobs and skills. These drivers are interdependent and their dynamic interplay means they may mitigate or reinforce each other.
In discussing the key developments in the sector, the previous chapter alluded to some of the drivers. This section uses the framework to draw out the implications of these drivers for the demand for skills in the digital and creative sector in more detail.
Policy, regulation and legislation
Government policy, regulation and legislation (locally, regionally, nationally and internationally) have implications for the sector’s demand for skills:
• Public IT procurement policy can have an impact on skill levels, training and
innovation in contractor companies.
• Regions are increasingly focused on digital and creative industries and skills as
25
• Possible changes to intellectual policy legislation may have an impact on creative
firms’ ability to make money from their content.
Technology
Research with ICT employers conducted on behalf of e-skills UK (e-skills UK, 2011) has identified three broad groups of key technology trends which will impact on future skill needs in the digital sub-sector, over differing time horizons.
Immediate Issues are those that will have a major impact over the next 1-3 years and are likely to have an impact on most companies. These include:
• Security and data protection – increasing use of electronic channels, partly as a result of greater use of personal IT devices, increases the opportunity for theft and illegal activities. IT professionals will need skills to develop security solutions and manage risk, and need to keep up to date with new security schemes and policies through research.
• Cloud computing – delivering internet-based services in real time, through web-based
tools or applications users can access through a web browser, cloud computing can increase business agility and lower costs. Project management and integrated solutions management skills will be required to realise these potential advantages, alongside technical skills around architecture, infrastructure and networking.
• Communication and IT convergence – involving the move from hardware to software
intensive platforms, as devices are integrating more into day-to-day work eg smartphones. Security maintenance skills will be the main priority for employers, followed by technical expertise in the new technologies.
Developing Issues are those that are expected to occur over the medium term. They could have a widespread impact on the sector and beyond or they may affect one sub-sector in particular. ‘Developing’ does not necessarily mean new as some of these issues have been emerging for some time but others will be new issues for the sector. Developing issues include:
• Green IT – enhancing the environmental performance of the sector and its users
26
• Transformation through IT – the ever expanding role of technology will enable
transformation of functions such as customer relationships, sales and procurement through bringing together business people and technologists to address business issues. IT professionals will need the business skills to identify business issues and strategic challenges, and also the interpersonal skills to deal with people across the business to bring about change.
• Information and analytics – use of business information and intelligence to gain
insight into performance and customer needs and implement appropriate responses. For business to benefit from the competitive advantage their intelligence holds, they need the ability to generate, gather and analyse data, and hence staff will need skills in modelling, simulation and analytics. Business will also need to integrate their different analytical operations, and draw out the lessons that can help shape their overall business strategy.
Horizon Issues are wider, ongoing issues, impacting at different times, on different businesses, but not affecting a majority of businesses all at once. These are likely to arise over a longer time-frame than developing issues, and include:
• Pool of talent/gender balance – enrolments in IT courses continue to decline and
women remain unconvinced about a career in IT, but the rapid projected employment growth will mean that employers will need to explore untapped labour pools to attract sufficient numbers of high quality recruits. The sector needs not only a vibrant, well-skilled recruitment pool but also more innovative and skilful approaches to recruitment, workforce development and HR management to secure the technical, business, design and innovation skills needed for the future.
• Backshoring – bringing services back to the UK when offshoring delivery overseas
proves unsuccessful. This is not new technology, and nor is it the norm, but where it does happen employers need to recruit the right people. IT professionals will need the business skills to deal with internal and external clients, and manage teams, to handle the disruption caused, and the security skills to ensure the business’ security is protected. This is more likely to be an issue for larger firms than smaller ones.
• Industrialisation of technology delivery – increasing automation and standardisation of processes and services in the IT industry drives a need for common standards and frameworks that are adhered to as technology operates on a larger and larger scale. IT professionals will require specific skills in solution design and the ability to design and re-engineer business processes, and also the skills to manage customer account and relationships..
27
• Security skills – in addition to having an immediate impact on the security and data protection theme, security skills cut across a number of other themes, for example off-site data storage for cloud computing systems, and issues about data transfer as IT and communications devices converge.
• Business skills – increasingly, technical skills alone are not enough for technology professionals and they must have core business skills, for example managing projects and change, and workforce planning and development.
• Technology specific skills – high level technical knowledge is central to nearly all future trends. Skills in power management and thermal solutions are vital in making IT greener. Cloud computing will require IT professionals to have a deep understanding of a variety of technical issues, as will data security.
• Inter-personal skills – as IT services become more embedded in everyday life, IT professionals need to better understand customer challenges and consumer choices.
• Analytical and research skills – a vital component of connecting information and technology to business problems, analytics also underpin a business’ ability to innovate.
Across the creative media and entertainment sub-sector, there is recognition of the dramatic changes brought about by the rapid growth of the digital environment. Sectors making use of developments in digital media include creative and cultural industries, particularly broadcasting, as well as online gaming industries. In a related area, the growth of e-commerce technologies is affording small craft-based enterprises access to a global market place (Wilson, 2009). Several analyses conclude that the leading position of the UK broadcasting industry and the potential expansion of access to digital media has not yet been fully exploited, as well as the potential for growth across other sub-sectors within the creative and cultural sub-sectors (Clifton et al, 2009; The Work Foundation, 2007). This may be aided by improving ICT and digital literacy among workers in these sectors (UKCES, 2010).
Identified skills needs in the creative sub-sector as a result of increased digitisation include (UKCES forthcoming b):
• Multi-skilling: an understanding of different technology platforms and their impact on content development and digital work flow, and new approaches to working in cross-functional creative/technical teams within and across companies.
28
• Management and business skills: especially project management for multi-platform development; the hybrid skills combining effective leadership with innovation, creativity and understanding of technology, and the analytical skills to understand audience interests and translate it into business intelligence.
• IP and monetisation of multi-platform content: understanding of intellectual property legislation to protect from piracy, and exploiting intellectual property internationally to take full advantage of emerging markets.
In addition to these broad needs, there are specific skills needs in broadcast engineering, archiving, sales/marketing, supply chain management, HR; also particular recognition of the needs of freelancers on whom so much of the creative sector depends.
Globalisation
Although the UK digital sub-sector is ranked highly in terms of international comparisons, the sector is facing increasing global competition, and the competitiveness of the UK’s IT industry has dropped from 3rd in the world to 6th in the last year (quoted in e-skills et al., 2009).
As a result of globalisation, there is a complex picture of major restructuring and skills shift underway in the technology workforce. The sourcing of certain IT activities from well skilled, lower cost countries (geosourcing) is now well established and is expected to continue. This gives rise to challenges in the development pathways for new recruits, as many of the traditional entry level roles are less prevalent in the UK. However, globalisation also facilitates growth: lower development and delivery costs make more business cases for technology-enabled projects viable. This is supporting the continued growth in IT professional employment in the UK, with particular demand for high level skills.
Globalisation offers significant opportunities for the creative industries, including:
• Growing potential markets for UK-produced content in all formats, across all media;
• An increasing range of foreign competitors with access to the UK market;
29
The emerging economies of India and China will have the biggest impact on the UK industry, as their growing populations ensure they maintain their emerging roles as both suppliers and markets, although the current thinking is to treat them as key suppliers in the short term, and key markets only in the longer term. China now has more people in higher education than the US, and both countries are boosting the supply of highly educated workers, but incomes have a long way to rise before consumption of content will come close to Western levels.
The c