LLo
on
nd
do
on
n S
Sttu
ud
de
en
ntt P
Plle
ed
dg
ge
e
E
Ev
va
allu
ua
attiio
on
n
R
Re
esse
ea
arrc
ch
h R
Re
ep
po
orrtt D
DC
CS
SF
F--R
RW
W0
07
74
4
LLe
esslle
ey
y H
Ho
og
gg
ga
arrtt,, K
Ka
arre
en
n M
Ma
ac
ck
kiin
nn
no
on
n,,
K
Ka
atth
hrry
yn
n R
Ra
ay
y,, R
Re
eb
be
ec
cc
ca
a TTa
ay
yllo
orr a
an
nd
d S
Sa
an
nd
drra
a V
Ve
eg
ge
erriiss
P
Po
olliic
cy
y S
Sttu
ud
diie
ess IIn
nssttiittu
utte
e
C
Ca
arrll P
Pa
arrsso
on
nss
C
London Student Pledge Evaluation
Lesley Hoggart,
Karen Mackinnon,
Kathryn Ray, Rebecca Taylor and Sandra Vegeris
Policy Studies Institute
Carl Parsons
Canterbury Christ Church University
Views expressed in this report are not necessarily those of the Department for Children, Schools and Families or any other Government department.
© Policy Studies Institute 2008 ISBN 978 1 84775 285 7
Content
Acknowledgements ...4
Executive Summary ...5
Chapter 1: Introduction...10
Aims ...10
The evaluation...11
Methodology...12
Chapter 2: London Student Pledge Providers...15
Introduction ...15
LSP part-funded providers ...15
Other organisations involved in LSP activities ...18
Summary ...19
Chapter 3: London Student Pledge Funding ...20
Introduction ...20
Funding and numbers ...20
Comparison providers ...24
Costs per student ...25
Value for Money ...28
Provider views on LSP funding ...29
Summary ...32
Chapter 4: Offer and Take Up: Provider and school relationships...33
Introduction ...33
Relationships between schools and providers ...33
Take-up of activities by schools ...37
Barriers that limit participation ...38
Chapter 5: Evaluating Outcomes ...43
Introduction ...43
Schools’ selection/targeting of students ...45
Role of the Student Pledge ...46
The benefits for students of participating in Pledge activities ...46
Value for money for schools and government...50
Summary ...55
Chapter 6: Conclusion and recommendations...56
Recommendations ...58
References...60
List of Tables
Table 2.1 - Main student groups who access activities as reported by LSP
part-funded organisations...15
Table 2.2 - Activities offered by LSP part-funded providers...16
Table 2.3 - Coverage of London Student Pledge statements by part-funded providers ...18
Table 2.4 - Number of LSP statements related to provider activities ...19
Table 3.1: Projects part-funded 2005 - 08...21
Table 3.2: LSP-part-funded projects and the focus of their provision ...21
Table 3.3: Funding sources and work with schools and young people...22
Table 3.4: Schools, teachers and students involved in LSP related and LSP part-funded activities ...22
Table 3.5: LSP part-funded providers – categories and numbers...23
Table 3.6: Key stage characteristics of students...23
Table 3.7: Provider funding sources ...24
Table 3.8: Overall costing per student for LSP-part-funded projects ...25
Table 3.9: Field Studies Council ~ school, teacher and student numbers ...26
Table 3.10: One-off events 2005/06 ~ school, teacher and student numbers ...27
Table 3.11: Infrastructure projects 2006/07 ~ all specifically part-funded by LSP ...27
Table 3.12: Longer duration programmes ~ school, teacher and student numbers...28
Acknowledgements
Many people have contributed towards this research report. Particular thanks are due to all the research participants. These included the following organisations: National Theatre; Young Vic; Mousetrap Theatre Projects; University of 1st Age; LONSAS; Mayor's Thames Festival; Orleans House Gallery; Whitechapel Art Gallery; Young Enterprise London; Citizenship Foundation; Kew Gardens; Duke of Edinburgh Arts Project; Greenhouse Schools Project; Youth Sports Trust; Saba; The Photographers’ Gallery; Field Studies Council; Bowles Outdoor Centre; Museums, Libraries and Archives London; Lyric Hammersmith; Sports Leaders UK; Wayne McGregor
Executive Summary
Introduction
The Policy Studies Institute, in partnership with Canterbury Christ Church University, was commissioned by the Department for Children, Schools and Families (DCSF) to conduct an evaluation of the London Student Pledge (LSP).
The LSP formed part of the London Challenge Strategy (2003-2008), and was designed to widen young people’s experiences and raise aspirations through the creation of enrichment activities for them inside and outside school. It offered 10 challenges for London secondary school students to achieve before the age of sixteen:
1. I will have had the chance to express my views on London issues and be listened to. 2. My academic, sporting or creative talents will have been celebrated - at school or
outside.
3. I will have taken part in a public event - either sports, dance or concert or visual arts. 4. I will have taken part in a play, musical or reading that involves either acting,
speaking or helping with the production.
5. I will have been on an educational visit or overnight stay.
6. I will have had the opportunity to help others through voluntary activities. 7. I will have been to an artistic or sporting event at a major London venue. 8. I will have learnt to understand other cultures and faiths.
9. I will have planned, delivered and evaluated a project from beginning to end. 10. I will have experienced cutting-edge science and technology.
Since 2003, 25 organisations have been part-funded through the LSP to provide students with opportunities to achieve these Pledges. The evaluation focused on 21 organisations that received LSP funding during the last three years of the programme. Evidence was also collected from providers that did not receive LSP funding, and teachers and students who organised and participated in activities.
Key Findings
• All stakeholders thought that the funding had increased the enrichment opportunities available for London school children.
• Pledge activity was reported by teachers and students to have had a significant and diverse range of benefits for students and schools.
• Providers were agreed that if they wanted to target more disadvantaged schools and children, then more time and resources were needed to ensure those schools’ involvement. The funding had enabled them to do this.
• The activities that were part funded by an LSP grant tended to be arts related; few providers offered experiences of science and technology
• There was a general lack of awareness of the 10 Pledge challenges among all stakeholders.
Methodology
The main aims of the evaluation were:
1. To assess whether the funding programme adds value to the London Student Pledge and the London Challenge Strategy
2. To evaluate the delivery and impact of the programme of funding
3. To help inform the decision about whether the Department should support similar work in other cities, and how this might be done effectively
4. To contribute towards the overall evaluation of the London Challenge Programme
The evaluation was carried out in autumn 2007 and spring 2008. It combined quantitative and qualitative methods, and consisted of four strands:
Strand A: A census postal survey of all organisations (approximately 200) who had registered their interest in LSP provision on a dedicated website.
Strand B: Detailed research with the 21 providers who received LSP funding since 2005, and a comparison sample of 10 providers who had not. The methods used at this stage of the research were: a financial audit; semi-structured interviews with project staff; and collection of management Information (MI) data.
Strand C: Detailed research with a sample of ten schools that had participated in activities that were part funded by the LSP. The methods used for this stage of research were: semi-structured interviews with school staff and focus groups with students.
Strand D: Overarching analysis that drew together the multiple strands of evidence.
Summary of main findings
This summary draws on all the data sources outlined above.
Provision of Pledge activities
• Twenty-one organisations who received LSP funding were studied. Grants ranged in value from £3,000 to £1,600,000 and, in many cases, made a significant contribution towards the costs of delivering LSP-related activities. Funded organisations offered a range of opportunities to students, including theatre, visual arts, sports, residential stays, volunteering and debating. These activities varied in length and intensity: from one-off events, to projects that spanned a school year, to residential stays.
• The majority of activities on offer were associated with the visual and performing arts. In contrast, opportunities related to environmental/science education were under-represented.
• Providers reported that the LSP funding enabled them to devote extra time and effort to the attempt to work with schools experiencing deprivation and educational
money to develop new programmes specifically aimed at the Student Pledge (and London Challenge) remit, whilst others were able to extend the breadth of their provision.
• There was considerable variation in the extent of the coordination and promotion of the Pledge. Particularly striking was the lack of awareness of the Pledge challenges, on the part of the providers and, even more so, at the schools visited. There was limited knowledge of the Pledge itself amongst those organisations included on the website, and even the providers that have been part-funded by DCSF were not all fully aware of the Pledge or London Challenge. Providers from the comparison group, moreover, were not aware that the Pledge had funding opportunities
Funding process and monitoring
• The majority (17/21) of the organisations included in the study had received repeat LSP funding over two or three years. The data suggest a lack of transparency over funding decisions (with no open competition for funds), and what might be seen as too light a touch in the monitoring of part-funded provision. Providers described the grant application and monitoring arrangements as ‘informal’ and ‘light touch’. The light touch does mean that managers of providing organisations were able to proceed with their work providing for schools. This approach also reduced the administrative burden normally associated with funding applications, and allowed flexibility in how providers allocated money within a project.
• A number of drawbacks, however, also stem from the light touch. Uneven monitoring makes it virtually impossible to report, at the individual project and overall programme levels, the unit cost for different activities, and to calculate the unit cost for different activities.
• Despite minimal monitoring and reporting requirements, all providers reported they evaluated their projects, often as a requirement of other funding bodies.
• A substantial number of providers (10) had no funding in place to sustain LSP-related provision beyond 2008, while nine stated that they had full or partial funding to
support future activities, or similar activities in the future.
Offer and take up of activities
• Good practice by providers included working with key school staff, and tailoring activities to the expressed needs of schools. Once a good relationship was established with a school, often through an individual teacher, providers would be called on year after year.
• There was little evidence that schools had developed a strategy for the promotion and take up of Pledge opportunities. The research has shown that there is great
unevenness in the extent to which teachers, and schools, will be pro-active and in some cases even responsive, to Pledge offers. The selection of students to take part in activities can often depend on one teacher taking advantage of an opportunity for some of their students.
Outcomes for schools and students
• Pledge activity was reported by teachers and students to have had a significant range of benefits for students and schools. Positive changes were reported in curriculum based skills, confidence, staff-student relations, and behaviour and attitudes to learning.
• Some of the evidence suggests the exposure to new experiences enabled students to begin a process of ‘enrichment’ activities, nurturing aspirations that were sustained beyond the funded activity.
Value for money
• The evidence that was collected suggests that Pledge funding has facilitated the participation of large numbers of London’s secondary school children in a wide range of worthwhile extra-curricular activities. Perceptions from all the stakeholders
interviewed for this study were that such activity has great value for school students and their schools. It was estimated that more than 66,000 additional students participated in Pledge funded projects.
• The projects were all very different so that it is difficult to compare costs. Project accounts were not standardised and, together with substantive project-to-project differences, it was not possible to draw an accurate comparison of provision that was supported by the Pledge. Consequently, it has not been possible to calculate the added value of the funding.
• The evidence suggests that many of the providers did provide value for money in the activities that they delivered. The added value of part-funded activities stemmed primarily from the additional resources that the organisations were able to draw in to their activities (such as world class actors and directors), and the way that some activities were designed to be self-sustaining after funding ended. Another way in which providers developed sustainability was through providing skills training (for staff or students) for an activity that the school could then take on themselves.
• In order to make a fuller assessment of additionality and value for money of the Pledge funding stream, it would be necessary to perform a longer-term follow-up study, including a comprehensive assessment of the other funding sources available to providers to support similar activities, and other providers drawn upon by schools.
Conclusions
The London Student Pledge programme has the potential to reinforce the Extended Schools and Every Child Matters agendas, as well as the City Challenge programmes, by offering a framework for enhancing the life opportunities of secondary school students. The following points draw on the evaluation evidence and are presented to the DCSF and stakeholders as suggestions for consideration.
1. Pledge-related enrichment activities are worthwhile and the DCSF should consider how to support such activities. However, if funding were to continue, clear criteria need to be developed and publicised.
2. Any future funding should be more closely scrutinised and monitored.
4. Local authorities could be given the responsibility for overseeing Pledge activities in their schools, and would need to be allocated resources to do this.
5. The Student Pledge could be promoted as a tool to help schools plan and monitor extra-curricular activities; and as something all their students can aspire to. It would be sensible to encourage Pledge-focused activities as part of the implementation of the Extended Schools policy.
6. Schools need easily accessible, reliable and up-to-date information about the range of Pledge activities offered, and about the providers.
7. Schools should to be alerted to the fact that monitoring extra-curricular activities is increasingly becoming an area of responsibility which needs significant staff input and management.
Chapter 1:
Introduction
Aims
The London Student Pledge (LSP) is an initiative which aims to widen young people’s
experiences and aspirations through the creation of opportunities for them to learn across ten broad areas of activity both inside and outside of school. It comprises ten challenges for London school students to achieve before they are sixteen:
1. I will have had the chance to express my views on London issues and be listened to. 2. My academic, sporting or creative talents will have been celebrated - at school or
outside.
3. I will have taken part in a public event - either sports, dance or concert or visual arts. 4. I will have taken part in a play, musical or reading that involves either acting,
speaking or helping with the production.
5. I will have been on an educational visit or overnight stay.
6. I will have had the opportunity to help others through voluntary activities. 7. I will have been to an artistic or sporting event at a major London venue. 8. I will have learnt to understand other cultures and faiths.
9. I will have planned, delivered and evaluated a project from beginning to end. 10. I will have experienced cutting-edge science and technology.
In recent years a number of initiatives have aimed at encouraging extra-curricular activities among school children and developing better links between schools and communities. These include Extended Schools (DfES~Teachernet, 2005), Community Schools, Study Support (Wilson et al, 2004; DfES, 2006) and, within London, the Mayor’s Children and Young People Strategy. Extended school activities and extra-curricular initiatives have been offered in an organised and monitored way in a minority of schools where an ‘Extended Learning Management Team’ promotes the involvement of students across an array of activity from Arts and Culture to residential stays and informal education “fun trips” (QiSS, 2006). The Children’s Plan: Building Brighter Futures (DCSF 2007) has reiterated the government’s commitment to the provision of ‘universal opportunities for positive activities’. Studies from the US have shown that extra curricular activities can have positive benefits to students in relation to improved attainment and reduced drop out rates (Chambers and Schreiber 2004, Mahoney 2000).
The evaluation
The research, commissioned by the Department for Children, Schools and Families (DCSF)
h
as focused on the programme of funding to support the Pledge. This includes how it has been delivered and what the impact has been on the opportunities for extra-curricular activities for secondary school students in London. It has done this by collecting evidence from different stakeholders on the programme of funding and the activities that it supports. The data provide a broad range of information in order to assess the effectiveness of the funding programme and to inform DCSF in deciding how similar initiatives might besupported. The research also set out to assess the extent to which the funding programme has provided added value, (over and above activities that would otherwise be provided to schools) by collecting data from organisations that have been part-funded and those that have not, and from schools that have participated in part-funded, and non-funded, activities. A central aim of the research has been to identify good practice, which might be shared, transferred or used more widely when working with schools in different areas of the country.
In summary, the aims of the research were:
1. To assess whether the funding programme adds value to the London Student Pledge and the London Challenge Strategy
2. To evaluate the delivery and impact of the programme of funding
3. To help inform the decision about whether the Department should support similar work in other cities, and how this might be done effectively
4. To contribute towards the overall evaluation of the London Challenge Programme
Objectives
The evaluation had three main objectives:
• Funding. To assess the cost of enhancing the opportunities for extra-curricular activities for secondary school students in London.
• Offer and take up. To examine the extent to which the funding has improved the provision, and take-up, of extra-curricular activities that offer the experiential opportunities envisioned by the Pledge.
Methodology
The methodology selected for this evaluation combined quantitative and qualitative methods, and consisted of four strands: strand A, provider postal survey; strand B, provider site visits; strand C, school visits; strand D, overarching analysis.
• Strand A: a census postal survey of all London providers (approximately 200) who deliver activities in support of the Pledge and registered on the Pledge website.
The survey was conducted during October-December 2007 to collect information from LSP part-funded providers and other organisations that had registered an interest in LSP and may offer activities to the target student population.1 Fifty-three organisations responded (21 part-funded2 and 32 non-funded providers).3 The questionnaire was administered mainly by post but an electronic version was made available for those who wished to reply via email.
The survey sampling frame was known to be over-generalised and there were many
duplicate organisations within the contact lists. The survey was seen very much as a scoping exercise to profile the part-funded provision and to identify other (not LSP part-funded) organisations that provide LSP activities. The survey enabled the collection of standardised information to aid comparisons. Questions elicited information on: main types of activities on offer; activities that correspond to the London Student Pledge; size (staff, participant
numbers); descriptions of participant groups: age, numbers, demographics; geographical area covered; sources of funding; plans for sustainability; evaluation activities; views about the Pledge. A copy of the survey instrument is available in Appendix A.
• Strand B: detailed qualitative research consisting of site visits and interviews with the 21 providers who have obtained funding through the London Challenge programme since 2005, and a comparison sample of 10 of those who have not.
Thirty-one organisations participated in the half-day site visit - all 21 LSP part-funded organisations and 10 other organisations that provide similar activities and registered their interest in the Pledge but have not received funding from the Pledge grant scheme. These other organisations were identified from responses to the Provider Survey and, among those who agreed to take part, were purposively selected to match the types of activities offered by the part-funded providers. The site visit consisted of a recorded semi structured interview with one or more key informants, usually project delivery staff and / or staff responsible for procuring project funding. An audit instrument had been sent out to providers in advance and responses to these were reviewed during the visit. Additional information on provision was obtained from a tour of facilities, promotional materials, reports and evaluations.
1
Only those providers who received LSP funding during financial years 05/06, 06/07 and 07/08 were included in the survey. The wider population of LSP providers was undefined at the time of the study. Surveys were sent to 256 organisations identified from the LSP website but it was not known if all these organisations supplied LSP related activities. To boost response rates, the survey was followed by a reminder letter and telephone calls. Direct communication revealed that a substantial number of the organisations were not involved with LSP activities. The non-funded provider respondents are therefore not necessarily representative, rather, they should be taken as an indication of other organisations delivering activities to London KS3 and KS4 students.
2
These organisations had received a Pledge grant in at least one of the previous three years (05/06, 06/07, 07/08) of the scheme.)
3
During the site visits to providers, researchers gathered information about: the delivery and effectiveness of the organisation’s Pledge activities, including relationships with participating schools, the effectiveness of any targeting and barriers to effective take-up; their perceived contribution to the London Student Pledge; the delivery and effectiveness of the funding, including the funding process, the adequacy of funding, sustainability and alternative funding sources. Refer to Appendix B for the interview topic guide and audit instrument.
• Strand C: detailed research with a sample of schools (ten) who have participated in Pledge-related activities part-funded through the London Challenge programme.
The sampling of the 10 schools followed completion of Strand B, and a number of criteria were used when selecting the schools. The first was that these were schools that had
participated in activities that had been organized by one or more of the providers from strand B within the last year. Secondly, one school within each of the five London Challenge target boroughs were sampled (with the exception of Hackney where a number of schools were unable to take part in the research). These four schools were supplemented by six schools in a range of inner and outer London boroughs. Schools were also sampled by the type of provision they had received, i.e. drama, sport, dance, etc, in order to obtain a broad cross section. Although some schools were in receipt of several different types of LSP provision, one of these was chosen as the primary focus for the fieldwork. Finally, sampling took into account schools position in the families of schools (DfES 2006a) classification in order to obtain a cross section and ensure the inclusion of more deprived schools.
With the need to keep disruption for the school to a minimum, researchers focused on achieving two semi structured staff interviews and a student focus group in each school. The first staff interview was with the class teacher who had organized the students’ participation in an activity. Where possible and appropriate a second interview was sought with a staff member who could give an overview of where the Pledge activities sat in relation to other activities organized by the school. This second staff member was identified and interviewed in 6 of the 10 schools (see appendix C for staff topic guides). The 10 focus groups each consisted of around 8 students on average usually from one class or year group with the ages ranging from 11 to 16). The focus group began with a short questionnaire asking students to identify how they felt about the activity with answers on a 4 point scale ranging from ‘yes a lot’ to ‘not at all’. They were also given the opportunity to tick which Pledge activities they felt the provision had helped them to achieve. The focus group discussion that followed, explored issues of what they liked and disliked about the activity, what they felt they had learned and how the activity might have changed their attitudes and aspirations in any way (see appendix D for questionnaires and topic guides).
In addition to the fieldwork in 10 schools, two students were interviewed independently of a school. They had taken part in a provision that worked with individual students and where the school played little or no part in mediating the activity. These two students were both
recruited to the research via the provider and interviewed on a one to one basis although the format of the interview followed the format of the focus groups beginning with the
questionnaire and then following the same topic guide.
All students were provided with an information sheet on the project and consent forms and where the focus group took place without a teacher present they also obtained parental consent (see appendix E).
• Strand D: overarching analysis.
the different stake-holders were compared. At this stage of the research an additional interview was conducted with one key informant who had played a role in designing and implementing the Pledge initiative.
The evaluation of an initiative where the elements of the provision were so disparate in nature was a challenge. The research team adopted an iterative and flexible approach in order to respond to difficulties with data collection and analysis. In particular, the complexity, and lack of comparability of the providers’ funding arrangements, and the variable quality of the financial records, emerged as a major issue early in the research process. This resulted in a decision, in consultation with the DCSF project manager, to strengthen the focus on the qualitative element of the research with the providers and not to provide a full
cost-effectiveness analysis. The focus of the over-arching analysis was how, and whether, the Pledge funding had succeeded in enhancing enrichment opportunities for London’s school students; and the perceived value of this funding.
The Report
Chapter 2:
London Student Pledge Providers
Introduction
This chapter first describes those providers that have received an LSP grant, looking at organisational characteristics, types of activities offered to students and coverage of the 10 LSP statements. It goes on to compare LSP part-funded providers to other organisations that signed up to the Pledge and also responded to a postal survey on LSP activity provision. Whilst mainly drawing on the survey data (on which all the tables are based), the comparison is supplemented by data from the provider site visits, and also from the student
questionnaire. Details on the nature and extent of funding these providers received are discussed in Chapter 3.
LSP part-funded providers
The 21 organisations that received funding from the DCSF (formerly DfES) to support delivery of London Student Pledge activities across the years 05/06, 06/07 and 07/08 represented good coverage of the region with most offering activities to students in both inner and outer London - 19 indicated they serve Inner London while 18 said they serve the Outer London region. Ten also provided activities to students outside of London. Table 2.1 breaks down the take up of provision by different student groups, as reported by the LSP part-funded organisations. All but one reported they regularly deliver activities to the KS3 and KS4 LSP target age groups. Fourteen stated they work with all student groups, including pre-school and Advanced Secondary levels; only six of the providers reported working
[image:17.595.68.378.423.572.2]exclusively with KS3 and KS4 students.
Table 2.1: Main student groups who access activities as reported by LSP part-funded organisations
Multiple frequencies
N
Key Stage 3 (11-14)
18
Key Stage 4 (15-16)
19
Primary / Infant
11
Other4
11
All 21
* includes pre-school and Advanced Secondary levels
Although London Student Pledge branding and funding has been available since 2003, organisations have been offering similar activities for longer. On average, part-funded organisations have been providing LSP related activities for 4.4 years - this ranged from 1.9 to 13.8 years. The size of organisations varied greatly from two to 887 staff. On average, staff comprised approximately twice as many paid employees (20) as volunteers (12). Providers reported they engage with an average of 16,340 secondary students each year (ranging from 150 to 130,000) and these students accounted for just over two-thirds of their total yearly participants.
4
Types of activity
Organisations generally concentrated on one area of provision and offered specialist services to the LSP student population. Provider activities broadly clustered around five categories of provision (displayed in Table 2.2). By far the most common category of activities related to the arts (performing arts or arts education and activities), offered by 15 (75 per cent) of the providers. These included arts appreciation and hands-on opportunities over a broad spectrum of arts provision. For instance, one art gallery provided an artist in residence over a school year, during which time the artist would facilitate an art project with the students and also take them to visit the artist’s work studio and a public gallery. Some theatre-based providers supplemented production visits with workshops for students held either in school or at the theatre and supplied resource packs for students and teachers based on the production they would be attending. A literature-focused provider ran a programme in which well-known authors worked with students in schools to produce a written piece. Another provider arranged music training in schools with lunchtime and after school sessions on voice, percussion, drumming and MCing.
The remaining provision was distributed among ‘training in leadership and enterprise awareness (including student placements)’ (3), such as coordinating community
volunteering; and ‘sporting, physical or outdoor education’ type activities (2) such as a mini Olympics coaching programme. One provider was engaged in running residential courses, operating as an umbrella organisation for several different providers including PGL, Outward Bound, the National Trust, as well as their own field studies centres. This provider offered a broad range of curriculum courses, covering sciences and geography, and adventure courses which focused on outdoor activities.
Table 2.2: Activities offered by LSP part-funded providers
Frequency
Type of activity Example activities N
Performing arts / arts education / arts activities
Theatre: audience access; student / teacher theatre workshops; script writing
Visual arts: art gallery visit; artist facilitated project; art criticism
Music Dance Literature
15
Training leadership / enterprise awareness / student placements
Volunteering
Debating 3
Sports / physical and outdoors education
Non-traditional sports; coaching mini Olympics 2
Environmental / science education Residential stays
1
Other activities
1
Total* 22
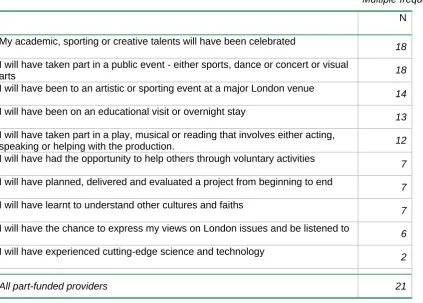
Coverage of the London Student Pledge
Organisations were presented with the list of 10 Student Pledge statements and asked to indicate which were addressed through their service provision. These are reproduced in Table 2.3 according to prevalence of responses. The majority (18/21) of LSP part-funded providers indicated they were aware of the London Student Pledge. During follow-up
interviews, some recognised the funding stream as the London Challenge, while others were able to talk generally about the ethos of the programme (to provide opportunities for young people to experience cultural activities and events). A small number of respondents knew very little about the Pledge or London Challenge. Among those who were not familiar, it is possible that these questionnaires were completed by staff who had not been involved in the procurement of funding or possibly the delivery of activities. Some interviewees had not been part of the original application process (because of staff turnover in the organisations) and so had less of a sense of the original aims of the funding, but again this varied.
When considering the 10 statements that constitute the Pledge, most providers related their activities to the recognition of student talents and participation in a public event. Taken together, all 21 of the part-funded organisations reported that their provision covers either the statement “My academic, sporting or creative talents will have been celebrated” or “I will have taken part in a public event - either sports, dance or concert or visual arts”.
It was less common for part-funded activities to relate to Pledges about volunteering, project design/delivery, expressing views on London, or appreciation for different cultures and faiths (each supported by six or seven - around a third - of providers). Finally, only two of the LSP part-funded providers recorded their provision against the statement “I will have experienced cutting-edge science and technology”. In general, the distribution of LSP statements covered by the part-funded providers aligns with the types of organisational activities presented in Table 2.2. Therefore, it is not surprising that provision is weighted towards arts participation and arts events.
All LSP part-funded organisations indicated they addressed more than one of the Pledges. The median number of LSP statements covered was five, while 17 (over 80 per cent) of providers were engaging students in more than three of the Pledges. This suggests that, although most part-funded organisations are delivering Pledge experiences through an arts related forum, they are enabling students to cover a variety of the Pledges. Still, it should be noted that science and technology activities are under-represented among the LSP part-funded providers.
A few respondents voiced concern about the lack of information available on the Pledge initiative. Another issue that was raised related to the need for grant funding bodies to extend commitments beyond one year to ensure that these activities for young people are
Table 2.3: Coverage of London Student Pledge statements by part-funded providers
Multiplefrequencies
N
My academic, sporting or creative talents will have been celebrated
18
I will have taken part in a public event - either sports, dance or concert or visual
arts 18
I will have been to an artistic or sporting event at a major London venue
14
I will have been on an educational visit or overnight stay
13
I will have taken part in a play, musical or reading that involves either acting,
speaking or helping with the production. 12
I will have had the opportunity to help others through voluntary activities
7
I will have planned, delivered and evaluated a project from beginning to end
7
I will have learnt to understand other cultures and faiths
7
I will have the chance to express my views on London issues and be listened to
6
I will have experienced cutting-edge science and technology
2 All part-funded providers 21
Other organisations involved in LSP activities
To establish a basis for comparison, the study also included organisations registered on the LSP website who did not receive the LSP grant. This section compares LSP part-funded providers to the other organisations (herein ‘other providers’) who responded to the postal survey (n=32), a further ten of which participated in a site visit and follow-up interview. Again, it should be borne in mind that these other providers are not a representative sample and should be treated as indicative of the provision that is available.
Awareness of LSP
The other providers varied quite widely in their remit, and given these divergent experiences, they had very different interests in and thus knowledge of the London Student Pledge. Fewer than half of the 32 other organisations that responded to the survey question indicated they were familiar with the Pledge. During follow-up interviews, several said they had heard of the London Challenge but struggled to make the link between their activities and the Student Pledge. One, for example, referred to signing up for a ‘Learning Outside the Classroom’ manifesto launched by the DCSF, but was unsure if this involved the Pledge. Another
provider, based in an Outer London borough, saw the Pledge as something more relevant to Inner London providers. By contrast, a third organisation had signed up to the Pledge very enthusiastically, saying that the Pledge activities matched the framework that they were using to map young people’s expectations for their education.
LSP provision
Similar to the LSP part-funded providers, other organisation provision was weighted towards the arts - 12/32 offered arts-related activities. Yet, a substantial amount of other
an educational visit or overnight stay’ and ‘My academic, sporting or creative talents will have been celebrated.’ On average, other providers covered a narrower range of the Pledges, while 80 per cent of LSP part-funded providers reported that their provision covered more than three of the 10 Pledges, under a third of other providers did so. (Refer to Table 2.4.) Similar to part-funded providers, relatively few of the other providers hosted activities that corresponded to the statement, ‘I will have experienced cutting-edge science and
[image:21.595.67.453.201.331.2]technology’. This finding was confirmed by the student questionnaire data. When presented with the Pledge list and asked to indicate which ones they had achieved to date, very few students had marked this statement.
Table 2.4: Number of LSP statements related to provider activities
Frequencies
LSP part-funded providers
Other providers
3 or fewer LSP Pledges 4 13
More than 3 LSP Pledges 17 19
Median number of Pledges 5 4
Total 21 32
Delivery structures
There were more differences between part-funded and other providers regarding their structural characteristics. Other providers had been delivering LSP related activities to students for far longer, nearly three times longer than LSP part-funded organisations (12.3 years compared to 4.4 years). Other providers also relied much more heavily on volunteers and on average they employed more than three times as many volunteers but almost half as many paid employees as their part-funded counterparts.
Summary
The survey findings suggest that LSP part-funded provision is biased in favour of the arts – visual and performing arts and arts appreciation. Fifteen of the 21 part-funded providers described their provision in this way and all reported that their provision covered either the statement “My academic, sporting or creative talents will have been celebrated” or “I will have taken part in a public event - either sports, dance or concert or visual arts”. In contrast, activities related to environmental / science education were under-represented; only two of the LSP part-funded providers reported their activities were relevant to the Pledge, “I will have experienced cutting-edge science and technology”.
Chapter 3:
London Student Pledge Funding
Introduction
This chapter draws upon a number of data sources to give an overview of the cost and scope of extra-curricular activities provided for London secondary school students through the Pledge funding. This is primarily based on quantitative data from the cost study, but also draws upon qualitative data from the interviews and documentary analysis.
To carry out the cost study, site visits were conducted with all 21 part-funded providers and ten comparison providers that did not receive LSP funding. Although the audit instrument was sent in advance of the visit, data on costs from the part-funded projects was variable and incomplete and even more so from the non-funded projects. The 21 part-funded projects were not part-funded for all years and our analysis examines the part-funded projects for the two years separately, 2005-06 and 2006-07. The 2007-08 predicted figures are given only in Table 3.1; these show anticipated rises in LSP funding and proportionately larger rises in the total finance expected to be allocated to work with young people. Parallel analyses of each of the two completed years offers an opportunity for comparison across the two years and a check on consistency, most important because of the level of estimation that has been necessary from the figures supplied. There was great inconsistency in the figures collected and numerous estimates and combinations of figures have had to be made by the
researchers. Providers have had great difficulties in determining post hoc how much LSP funding and how much funding from other sources was allocated to individual initiatives. They have also struggled to report how the funds were distributed across different sorts of expenditure necessary to keep an organisation going. A range of information sources were drawn on by providers (Management Information Systems, accounts departments,
evaluations and other documentation) but in most cases it has been insufficient to permit any robust aggregation.
Therefore, it has been particularly difficult to show the proportions of funding spent on administrative tasks, training etc. Nonetheless, using these multiple lines of evidence, it was possible to provide a picture of the programme financing from which policy implications can be drawn, both for the allocation of funding and for future monitoring and management procedures.
Funding and numbers
The LSP grant recipients were organisations of different sizes and territorial coverage - some were national. Collectively, they had turnovers of over £40M annually. Over a three year period, 21 providers were part-funded to enhance their ability to support elements of the London Student Pledge. The amount was around £2.5M each year.
Table 3.1 sets out the numbers of projects part-funded and the total funding available for the most recent three years of the scheme. It also sets out the figures made available by some of the providers on their total expenditure on Pledge-related work with young people.
Altogether, it is evident that the LSP funding available and allocated to additional provision for young people is considerable. The LSP grant funding almost doubled the value of funding available to these organisations to address Pledge goals. The contribution of LSP funding to these organisations is significant - and acknowledged to be so by the providers. Six received grants for all three years, ten for two years and five for one year.5 One provider, the Field
5
Studies Council, received £1.6M in each of the three years. The value of the remaining grants ranged from £3,000 to £239,000.
Table 3.1: Projects part-funded 2005-08
Year Number of part-funded providers Total LSP funding Total finance
allocated to education and young people work by part-funded providers Number of responses giving total finance information
2005-06 12 £2,306,550 £4,524,000 11
2006-07 17 £2,515,285 £5,304,000 17
2007-08 (predicted)
15 £2,539,485 £6,176,000 (predicted)
11
In the survey, nineteen of the 21 part-funded providers cited information on the status of their future funding (refer to Table F1). A substantial number of providers (10) reported they had no future funding in place to sustain LSP related activities beyond 2008 while nine stated that they had full or partial funding to support similar activities in the future. This varied by type of provider activity and organisational size. Those organisations that specialised in training and student placements reported they had no funding in place to sustain these activities beyond the current year. By contrast, organisations that offered either sport or science based
[image:23.595.66.496.520.663.2]activities reported they had funding to sustain them beyond 2008. Very few (only three out of 12) of the small-to-medium sized organisations (those with less than 65 staff and volunteers) reported they had funding to sustain LSP activities beyond 2008. In comparison, all but one (four out of five) of the larger organisations (those with more than 65 staff and volunteers) had funding for LSP related provision beyond 2008.
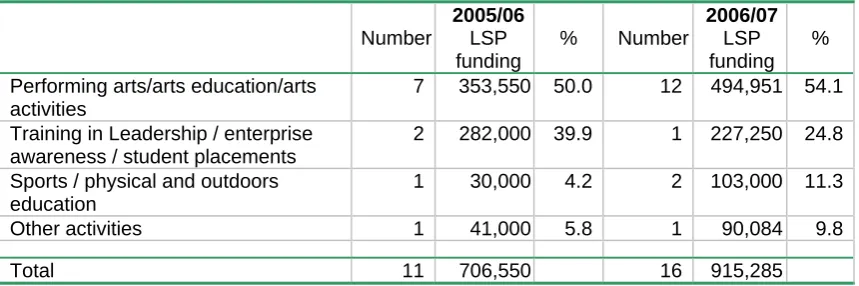
Table 3.2 shows the funding allocation over two years, according to broad types of provider activities. The analysis in Table 3.2 excludes the Field Studies Council which accounted for more than half of the funding in each of the years. A similar pattern emerges for both years with Pledge funding allocated mostly to arts-related initiatives. This finding corresponds to the number of projects part-funded for this area of extra-curricular activity and verifies the discussions in Chapter 2.
Table 3.2: LSP-part-funded projects and the focus of their provision
Number
2005/06 LSP funding
% Number
2006/07 LSP funding
%
Performing arts/arts education/arts activities
7 353,550 50.0 12 494,951 54.1
Training in Leadership / enterprise awareness / student placements
2 282,000 39.9 1 227,250 24.8
Sports / physical and outdoors education
1 30,000 4.2 2 103,000 11.3
Other activities 1 41,000 5.8 1 90,084 9.8
Total 11 706,550 16 915,285
It is important to note that work on Pledge related activities was also part-funded from other sources. Table 3.3 indicates the amounts and sources of funding as reported by the
[image:23.595.69.498.521.663.2]Table 3.3: Funding sources and work with schools and young people
Part-funded providers
Funding source Amount of funding 2005/06
N = 12
Amount of funding 2006/07
N = 17 Participation fees £9,262,000 £9,469,000
Central government grant £5,867,000 £6,080,000
LSP grant £2,245,000 £2,397,000
Private donation £1,915,000 £1,773,000 Local government grant £577,000 £614,000
Lottery Grant £98,000 £380,000
Other £6,299,000 £7,938,000
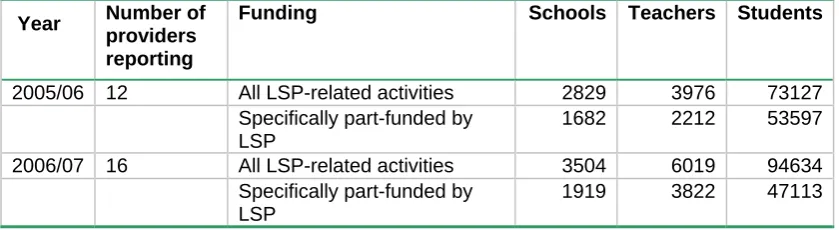
Table 3.4 indicates the numbers of schools, teachers and students reported to have
[image:24.595.65.485.448.563.2]benefited from the LSP programme and, within that, the number specifically part-funded by LSP. The table shows that approximately double the number of students are benefiting from Pledge related activities as are directly part-funded by LSP (2006/7 figures). There will inevitably be double counting in that some schools (teachers and students) may be involved in more than one activity. The significant increase in numbers of schools and teachers involved in 2006/07 is entirely explained by one, new infrastructure project (see below) reported to be reaching all London secondary schools with web information. It should be noted that aggregated participation estimates are likely to be generous. Figures reported by provider organisations are likely to include multiple counts of schools, teachers and students who had taken up more than one activity offered by an organisation and / or been involved with different providers.
Table 3.4: Schools, teachers and students involved in LSP related and LSP part-funded activities
Year Number of providers reporting
Funding Schools Teachers Students
2005/06 12 All LSP-related activities 2829 3976 73127 Specifically part-funded by
LSP
1682 2212 53597
2006/07 16 All LSP-related activities 3504 6019 94634 Specifically part-funded by
LSP
1919 3822 47113
Table G1 itemises activities of the range of providers and shows the range and numbers of schools, teachers and students involved. Provision covered a wide range of activity such as, staff development for teachers, curriculum resources, theatre visits and workshops, gallery visits and support materials, and pupil residentials.
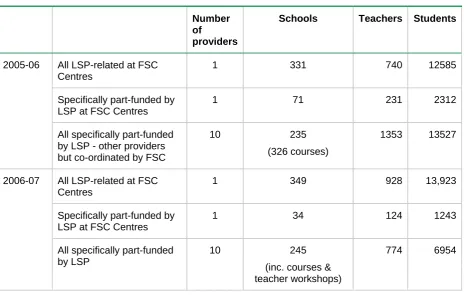
Table 3.5 indicates the large numbers of schools, teachers and students participating in activities. The providers have been divided into four categories because of the distinctive differences in what they offer:
• The Field Studies Council - providing and coordinating residential visits
• Infrastructure projects - working at the school level, providing information or bringing schools together in partnership
• Longer duration programmes - activities that continue for the course of the school year.
[image:25.595.71.530.159.365.2]The longer duration projects, such as theatre and sporting activities, involved over 1,000 schools and over 30,000 students.
Table 3.5: LSP part-funded providers - categories and numbers
Category Year No of
Providers
Schools Teachers Students
Field Studies Council*
London Challenge New Views residential administered by FSC
2005/06 10 235 (326 courses) 1353 13527
2006/07 10 245
(inc. courses & teachers’ workshops)
774 13983
Infrastructure projects 2005/06 0 0 0 0
2006/07 2 594 1410 0
One-off events 2005/06 2 5 38 205
2006/07 0 0 0 0
Longer duration programme 2005/06 9 1409 1223 31377
2006/07 13 1120 1660 30691
* in collaboration with 10 other organisations coordinated by FSC.
Column totals are not given since this will almost certainly introduce further multiple counting as many of the schools and their teachers and students will be involved in more than one category of activity.
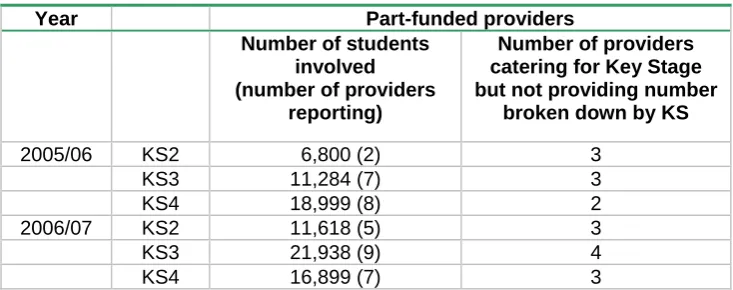
[image:25.595.65.432.561.706.2]Student numbers across Key Stages 2, 3 and 4, as reported by LSP part-funded providers are set out in Table 3.6. The bulk of beneficiaries were secondary students. However, the figures suggest that KS2 students were also benefiting from the Pledge-related activities; five out of 12 providers in 2005/06 and eight out of 17 providers in 2006/07 reported they worked with these younger students. Totals for separate Key Stages were difficult to arrive at since some providers did not keep data on students by Key Stage.
Table 3.6: Key stage characteristics of students
Year Part-funded providers Number of students
involved (number of providers
reporting)
Number of providers catering for Key Stage but not providing number
broken down by KS
2005/06 KS2 6,800 (2) 3
KS3 11,284 (7) 3
KS4 18,999 (8) 2
2006/07 KS2 11,618 (5) 3
KS3 21,938 (9) 4
Comparison providers
Usable financial information was received from only four (out of 10) comparison providers who did not receive LSP funding. These data are not tabulated due to the diversity and varied quality of the information supplied. Indications from these organisations are that many schools, teachers and students are being served, some at full cost. Slightly less than half of the comparison providers reported they have funding in place to sustain their LSP activities beyond 2008. This was similar to the LSP-part-funded providers.
[image:26.595.66.415.285.521.2]Data from the survey suggest that, compared to LSP-part-funded providers, other provider organisations were more likely to charge participation fees to help cover the costs of their LSP activities - half indicated they receive these fees, compared to just over a third of the LSP-part-funded providers (Table 3.7). A lottery grant was also a more important funding source to the other providers.
Table 3.7: Provider funding sources
Number of part-funded providers
Number of comparison providers
Central government grant
13 12
Participation fees
8 16
Private donation
8 10
Local government grant
5 11
Lottery grant
2 10
Other
7 12
No source of funding recorded
0 3
All providers
Costs per student
This section presents a picture of costs per student averaged across projects, or per school in the case of two of the projects. Table 3.8 provides an aggregate costing per student for project running costs reported for 2005-06 and 2006-07. Whilst it is clear that a lot of young people are receiving inputs at a significant level of cost - mostly highly subsidised - simply dividing the total grant by total students is a crude measure. It does not account for
[image:27.595.66.499.210.290.2] [image:27.595.67.492.210.290.2]differences amongst the activities or the amount of supervision required. Further analyses in this section will help to explain the cost allocation across the two years.
Table 3.8: Overall costing per student for LSP-part-funded projects
Numbers of LSP-part-funded providers catering directly for students
LSP Grant (total)
LSP student numbers6
Mean cost per student
2005-06 12 £2,306,550 53157 £43.39
2006-07 13 £2,376,201 45895 £51.77
Where sufficient detail on attendance of activities was provided on the audit tool, it was possible to estimate the numbers involved in individual activities, acknowledging multiple activities supplied by one provider. Table G1 itemizes activities of the LSP part-funded providers and shows the range and numbers of schools, teachers and students involved. This listing reinforces the diversity of provision available through Pledge funding and the range in the volumes of students and schools that were engaged. The numbers involved were, in some cases, very considerable.
Table G2 gives an indication of the range of activities and charges related to each of the constituent activities. Tables G3 (2005/06) and G4 (2006/07) break this down still further to an hourly charge per student and the actual cost to the student, taking account of the reduction resulting from the LSP funding. Some activities for large groups cost as little as £0.63 per student hour. Student workshops over 16 hours may cost £3.13 per hour but no cost to the student (Activity 1036 - 2005/06). A five day residential may cost £210 to manage but cost the student nothing. Reflecting on these data, it is evident that more detailed
accounting would help assess the appropriateness and the vale for money of the expenditure.
The next subsections examine the four categories of projects as listed in Table 3.5 and their costs.
6
Field Studies Council
[image:28.595.68.533.165.460.2]The Field Studies Council received £1.6 million per year. Table 3.9 shows the numbers of schools, teachers and young people who are catered for by the residential provision and teacher training.
Table 3.9: Field Studies Council ~ school, teacher and student numbers
Number of providers
Schools Teachers Students
All LSP-related at FSC Centres
1 331 740 12585
Specifically part-funded by LSP at FSC Centres
1 71 231 2312
2005-06
All specifically part-funded by LSP - other providers but co-ordinated by FSC
10 235
(326 courses)
1353 13527
All LSP-related at FSC Centres
1 349 928 13,923
Specifically part-funded by LSP at FSC Centres
1 34 124 1243
2006-07
All specifically part-funded by LSP
10 245
(inc. courses & teacher workshops)
774 6954
£1.6M funding allowed £1.53M to be allocated directly to residential course fees. The contribution to the individual students averaged £113 in 2005/06 and £220 in 2006/07. The full cost of residential visits ranged from £90 to £234 depending on the type and length of course. Any remaining costs not covered by the LSP grant were sourced by contributions from the students or their schools.
This is clearly a very important provision where there is an emphasis on including those who might not be able to afford it or from schools that habitually do not perform well.
One-off events
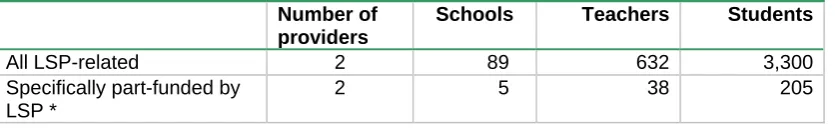
Table 3.10: One-off events 2005/06 ~ school, teacher and student numbers
Number of providers
Schools Teachers Students
All LSP-related 2 89 632 3,300
Specifically part-funded by LSP *
2 5 38 205
* The ‘specifically part-funded by LSP’ are part of the total of ‘All LSP related’
The £58,000 received by these two projects crudely equates to a cost of £283 per student - but this is almost certainly not a fair reflection on the activities supported. Some of the activities would have been with small groups over several days and have involved
considerable supervision and inputs. Again, some further information and the nature of the experience would help judgements about worth and inform decisions about future funding.
Infrastructure Projects
In 2006/2007 two infrastructure projects were part-funded (Table 3.11). These have targeted schools and teachers, either for the supply of support for partnerships or for the development of a website. The two providers report that all of the funding received for their projects came from LSP. The numbers reported to be reached by the organisation that provided a website are very large particularly in contrast to the organisation that encouraged partnership development through brokering relationships.
Table 3.11: Infrastructure projects 2006/07 ~ all specifically part-funded by LSP
Number of providers
Schools Funding
Website development 1 572 £48,000
Partnership development
1 100 £25,000
The funding for the two projects totals £73,000. All of the activities were part-funded by the Pledge. The reach of the website is calculated to be all London secondary schools (572) and the cost per school was therefore £83.92.7 The development of partnerships between schools is more demanding of labour and averages out at £250 per school.
7
Longer duration projects
[image:30.595.65.499.173.277.2]Most of the initiatives were of a longer duration, some available all year round. The numbers of schools, teachers and students involved was considerable and the numbers catered for specifically by funding from LSP was also large - about half of the total. Refer to Table 3.12.
Table 3.12: Longer duration programmes ~ school, teacher and student numbers
Number of providers
Schools Teachers Students
All LSP-related 8 2,422 3,155 71,502
2005-06
Specifically part-funded by LSP*
8 1,118 1,638 33,190
All LSP-related 15 2,582 3,133 59,273
2006-07
Specifically part-funded by
LSP* 15 1,490 1,470 40,957
* The ‘specifically part-funded by LSP’ are part of the total of ‘All LSP related’
Dividing the total grant by the number of student beneficiaries gives a cost per student for the provision of £19.50 in 2005/06 and £20.30 in 2006/07. There is wide variation in costs per student/activity (ranging from £6 to £400), both within and across providers, and this is partly explained by the different durations of activities. Table G2 sets out charges for the specific activities noted on the audit tool. Also set out is the charge to the student, which is, in most cases, nil.
Value for Money
One can note from the variable cost information given that large numbers of schools, teachers and students were served by the LSP funding. Even acknowledging the multiple counting of schools, teachers and pupils, large numbers have been touched by these enrichment activities.
Adhering to a strictly computational model, it is noteworthy that costs vary considerably and that a basis for judgement, and about prioritising for future funding, is not easily available from current data. Because costing data supplied was very much in aggregate form it is difficult to determine with confidence the cost for activities per hour of activity (eg for residentials). The data provided, even if detailed and consistent (which it was not), would have been difficult to manipulate to support judgements about additionality, value-added or value for money. Indeed, value for money calculations need to include in any calculation a judgement on quality ofprovision or outcome.
Provider views on LSP funding
This section presents provider views on the LSP funding stream, including their experiences of applying for funding, their views about the funding stream (in relation to other funding they received); and what they felt constituted the ‘added value’ of the LSP funding.
Table 3.13 displays the distribution of responses to the question, ‘How important is the LSP funding to your provision?’ All but one part-funded provider indicated the grant was important for delivering their LSP projects and this indicates how highly valued the funding was.
Table 3.13: How important is the LSP funding to your provision?
Number Very important 13
Quite important 4 Not very important 1
Twelve part-funded providers supplied an estimate on the number of extra students that participated in their projects as a result of LSP funding - this totalled 66,628 students. Written comments on the audit tool help to elucidate the importance of LSP funding:
‘The LSP provides half or all our funding so it is very important to us. It is also important as it enables us to provide a unique service to London schools and
artists…[We] believe the funding should continue if the government are serious about supporting extra curricular activities’.
‘We are indebted to the Department of Children, Schools & Families for its belief in our work and for allowing us to grow and develop... We believe your support has created a meaningful legacy for both teachers and young people - as well as enabling us to bring outstanding practitioners into direct contact with young people to help them explore and understand how theatre and the arts can impact their lives. Thank you for this most valued opportunity’.
‘The grant has been instrumental in the delivery of programmes for young people in schools who otherwise would not have had the opportunity to participate’.
‘The London Student Pledge is about a right to culture for young people. It provides important support to organisations working with young people in order to ensure that young people not only know what’s out there for them, but are given the tools, the language, the support to make visits, speak out and take part in culture as citizens’.
Other organisations emphasised the importance of the LSP grant for influencing corporate and other funders, and thought that the continuation of funding from corporate donors was in part dependant upon the foundation of funding from the London Challenge.
The LSP funding process
Information about the funding process was collected through interviews with key staff. The providers overwhelmingly agreed that the LSP funding application process was ‘easy’, ‘straightforward’ and ‘light touch’. This was both in terms of the process of applying for
welcome change from ‘the hoops’ that they were normally required to jump through in order to gain funding.
There were a number of advantages identified by providers:
The process reduced the considerable administrative burden that was normally associated with applying for funding. This was particularly important for smaller organisations that did not have a fundraising department or a large administrative team, and allowed more energy to be devoted to the delivery of projects:
‘that is so time effective, which means that people have got more time to actually be doing the delivery of the work than jumping through the hoops’
The ‘light touch’ monitoring allowed the providers to be flexible in how they allocated the funding within the overall parameters of the project or activity. Some providers spoke about the benefit of being able to shift funding between different budget headings, as needs arose.
A large number of providers spoke about how the ease of obtaining funding indicated a relationship of ‘trust’ with the DCSF which was very important to them. In particular, the way that they had been able to negotiate the scope and content of projects with DCSF indicated to them that DCSF trusted them as an organisation and valued their specialist skills:
‘more than anyone else that have part-funded us, there was an implicit trust in the [provider] as an organisation based on track record,’
Finally, related to this, those providers who spoke about negotiating the scope and content of projects with DCSF also felt that this resulted in the development of projects which accorded with the mutual objectives of both organisations. This was felt to be more advantageous than the usual process of applying for funding, in which providers had to alter their activities or objectives to more closely align with those of funders:
‘it was like somebody understood what it is you are trying to do and said “Do it” and that’s so rare you know. … one of the problems in the charity world, as you may know, is that you end up chasing money, and when you start chasing you end up sort of twisting yourself out of position, you start doing things that aren’t really you
because you want that money, because you need it to support you, and with the DFES [now DCSF] money, it was to get money to do what it is that we do.’
Providers, who had been able to work with DCSF to design activities which met their objectives, also spoke of not wasting time putting in speculative applications that would not be successful.
In terms of the delivery of the funding, the vast majority of providers felt that this had gone smoothly and had few complaints. A small number noted that funding had arrived late, which caused difficulties because activities that had been booked had to be delivered without funding in place. There also appeared to be some variation among providers in how much flexibility they were accorded in spending the funds. One provider spoke of not being able to roll money over financial years, which caused difficulty when they had not spent all the money for a particular year.
Most providers also said that the funding they received was adequate for what they wanted to do and a few described it as generous. Only a few providers had experienced difficulties with funds being unexpectedly reduced in subsequent years, which meant that they had had to scale back projects or source funds from elsewhere. The rationale behind the amount of funding received was not always transparent to providers. For example, one provider talked about how the DCSF had requested matched funding from the organisation one year, which they had found but which had had a detrimental effect on their other activities. When, in the following year they had declined to contribute matched funding, the LSP funding had been restored to the initial amount, which the respondent felt seemed ‘arbitrary’.
Relationships between providers and funders
The providers varied in the nature of the relationship they described with the funders at DCSF. Many spoke very positively about the funders, particularly those who received funding over a number of years. These providers spoke about maintaining a good working
relationship with DCSF so that although the funding was renewable on an annual basis, this involved simply a telephone call or a meeting to agree funding and targets for the following year. Some spoke of very useful and positive meetings with the funders each year in order to improve and develop activities:
‘It’s been every year a mutual kind of discussion about what’s worked and new ideas that we have and things that we’d like to do as a result of the experiences we’ve had in previous years, and yes it seems to have worked really well.’
Others said that while funding was not guaranteed from one year to the next, the funder was prompt in notifying providers of what would be available to allow for forward planning.
However, a minority of providers felt that their relationship with DCSF was poor. These were generally