Nurse-Family Partnership
Programme
Second Year Pilot Sites
Implementation in England
The Infancy Period
Research Report DCSF-RR166
Professor Jacqueline Barnes, Mog Ball,
Pamela Meadows, Professor Jay Belsky and the
FNP Implementation Research Team
Institute for the Study of Children, Families and Social
Issues
Research Report No
DCSF-RR166
Nurse-Family Partnership Programme
Second Year Pilot Sites Implementation in England:
The Infancy Period
Professor Jacqueline Barnes, Mog Ball, Pamela Meadows,
Professor Jay Belsky and the FNP Implementation Research Team
1Institute for the Study of Children, Families and Social Issues
Birkbeck, University of London
The views expressed in this report are the authors’ and do not necessarily reflect those of the Department for Children, Schools and Families.
© Birkbeck College, University of London 2009
ISBN 978 1 84775 540 7
September 2009
1 Joanna Goldthorpe, Juliet Henderson, Karla Heese, Beth Howden, Angela Jackson,
Contents
Key Messages...1
Executive Summary ...2
Chapter 1 - Introduction...8
A. Brief summary of year one findings...8
B. Questions addressed in year two...9
C. Methodology ...10
Chapter 2 - Delivering FNP with fidelity...12
A. Amount of support delivered ...12
B. Family Nurse views on attaining stretch objectives...22
C. Nature of the visits ...23
Conclusions...24
Chapter 3 - Retention of clients...26
A. Rates of attrition...26
B. Who leaves and who stays ...29
C. Reasons for leaving ...32
D. Family Nurses’ views on attrition ...33
E. Clients’ thoughts on attrition...36
Conclusions...40
Chapter 4 - Acceptability of FNP in infancy...41
A. Clients’ perceptions of FNP ...41
B. Family Nurses’ views on infancy materials ...44
C. Family Nurses’ ratings of clients’ involvements in visits...44
D. Father involvement in visits...46
Conclusions...47
Chapter 5 - Delivery of FNP in infancy ...49
A. Family Nurses views on FNP delivery in infancy ...49
B. The role of supervision...52
C. Completion of forms...54
D. The role of reports in supervision...56
E. Work satisfaction...58
Conclusions...59
Chapter 6 - Supporting for sustainability ...60
A. Local acceptance of the FNP approach...60
B. Factors for commissioners ...62
C. Facilitating delivering FNP alongside other services ...65
D. Delivery within Children’s Centres ...66
E. Incorporating FNP in the service ‘offer’...70
F. Existing plans for the continuation of FNP ...71
Conclusions...73
Chapter 7 - Costs and Workforce...74
A. Family Nurse Partnership costs ...74
B. Expected benefits ...75
C. How do Family Nurses spend their time? ...76
D. Variation between sites...83
E. Cost-effectiveness issue ...86
Chapter 8 - Potential impacts of FNP...88
A. Changes in smoking in pregnancy and from pregnancy to infancy...88
B. Infant birth status ...92
C. Breast feeding...95
D. Experience of abuse ...96
E. Client judgements about the impact of FNP...97
F. Use of Children’s Centres ...99
G. Referrals for other services...99
H. Parenting questionnaire...100
Conclusions...101
Chapter 9 - Case studies; lives changed...103
A. Details of clients...103
B. Outcomes of FNP ...107
C. Summary of outcomes for each case study...109
Conclusions...110
Chapter 10 - Conclusions...115
A. Delivery with fidelity ...115
B. Acceptability of FNP...117
C. FNP within a wider service structure...118
D. Potential for impact ...119
E. Lessons learned and future work...119
References ...121
Appendix A - Interviews conducted for the evaluation ...123
Appendix B - FNP stretch objectives for pregnancy and infancy ...124
Appendix C - Responses to the Nurse Client Relationship Inventory ...125
Appendix D - Monthly site reports ...126
Appendix E - Data forms completed by Family Nurses in pregnancy and infancy...127
List of tables and figures
Tables
2.1 Distribution of the percentage visits received for all enrolled clients who completed their pregnancy (N=1255), first the percentage of 14 visits and then the percentage of expected visits taking into account gestation at intake and leaving the programme .14 2.2 Distribution of the percentage visits received for all clients who remained with FNP for
their pregnancy (N=1085), first the percentage of 14 visits and then the percentage of expected visits taking into account gestation at intake and leaving the programme .14 2.3 Including all enrolled clients who had completed their pregnancy (N=1255), the mean number of visits in pregnancy and the percentage of 14 visits completed, by site....16 2.4 Including all enrolled clients who had completed their pregnancy (N=1255),
pregnancy visits completed and the percentage of expected visits, taking into account gestation at intake and attrition, by site ...17 2.5 Including clients remaining with FNP throughout their pregnancy (N=1085),
pregnancy visits completed and the percentage of expected visits, taking into account gestation at intake and attrition, by site ...17 2.6 Distribution of the percentage of expected infancy visits received, for all clients whose
infant had reached 12 months of age (N=712), the subgroup active during infancy (N=614), and the subgroup active at 12 months (N=467), taking into account attrition ...18 2.7 Infancy visits completed and the percentage of expected visits by site, for all enrolled
clients whose children were at least 12 months old (N=712) ...20 2.8 Infancy visits completed and the percentage of expected visits by site, for clients
whose children were at least 12 months old and who did not leave FNP during
pregnancy (N=614)...21 2.9 Infancy visits completed and the percentage of expected visits by site, for clients
whose children were at least 12 months old and who were still active at 12 months (N=467) ...21 2.10 Strategies FNs predict would increase dosage. Mean ratings on a scale from 1 (not
helpful) to 10 (very helpful) ...22 2.11 Nature of visits completed during pregnancy, for all those clients whose infant had
been born (N=1255) ...23 2.12 Nature of visits completed during infancy, for all those clients who had any infancy
visits (N=1036) ...24 2.13 Nature of visits completed during infancy, for all those clients who remained with FNP until their child was 12 months old (N=593) ...24 3.1 Attrition during pregnancy by site for all clients whose pregnancy was complete
(N=1255) ...27
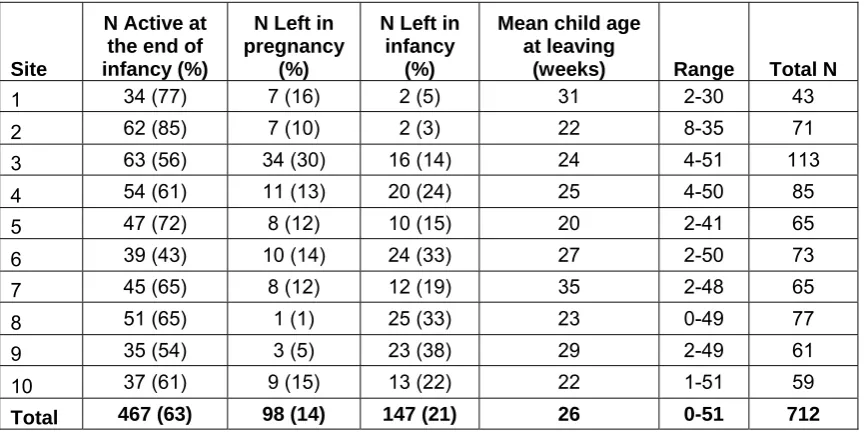
3.2 Attrition during infancy by site for all clients whose infant had reached 12 months of age (N=712) ...27 3.3 Demographic characteristics of clients enrolled in FNP whose infant had been born
(N=1255) ...29 3.4 Comparison of those clients completing pregnancy and those leaving during
pregnancy, continuous factors (N=1255)...31 3.5 Comparison of those clients completing pregnancy and those leaving during
pregnancy, categorical factors (N=1255)...31 3.6 Comparison of clients with infants of at least 12 months staying throughout pregnancy
and infancy and those leaving in infancy, continuous factors (N=614)...31 3.7 Comparison of clients with infants of at least 12 months staying throughout pregnancy
and infancy and those leaving in infancy, categorical factors (N=614)...32 3.8 Reasons for leaving (Client Activity Status Form) (N=398) ...33 3.9 Details given for ‘Declined further participation’ (N=176) ...33 3.10 Impact on the FN when a client leaves. Mean scores on a rating from 1 (never felt this
emotion) to 10 (often felt this emotion) ...34 3.11 Strategies used by FNs to strengthen the likelihood that clients will stay with FNP.
Means on a scale from 1 (never use this strategy) to 10 (often use this strategy) ....35 3.12 Factors perceived to be likely to help clients stay with FNP. Means on a scale from 1
(not relevant) to 10 (important) ...35 4.1 Responses to the shortened Nurse-Client Relationship Inventory (N=98) ...42 4.2 Clients’ recall of specific FNP materials that are commonly recommended for use
during infancy (N=244) ...43 4.3 Family Nurses’ perceptions of the usefulness of infancy materials. Mean ratings on a
scale from 1 (not useful) to 10 (very useful) ...44 4.4 Average ratings of client involvement in visits, their understanding of and conflict with
materials in pregnancy and infancy for those clients with infants, by site. Ratings on a scale from 1 to 5 ...45 4.5 FN ratings of client behaviour during home visits, comparing those still active at the
end of infancy with those who have left the programme ...45 4.6 Presence of fathers/partners at visits in pregnancy and infancy ...46 4.7 Family Nurse ratings of partner involvement in visits, their understanding of and
conflict with materials in pregnancy and infancy for those clients with infants, by site. Ratings on a scale from 1 to 5...47 4.8 FN ratings of partners, comparing those still active at the end of infancy with those
who have left the programme ...47
5.1 Factors that FN rate as helpful the successful delivery of FNP. Mean scores on a
scale from 1 (never helpful) to 10 (often helpful) (N=44 and N=29) ...49
5.2 Factors that FNs rate as potential barriers to effective delivery of FNP. Mean scores on a scale from 1 (never a barrier) to 10 (often a barrier) (N=44) ...50
5.3 FN perceptions of client involvement in infancy. Mean scores on a rating scale from 1 (never notice) to 10 (often notice) (N=44 and N=29)...51
5.4 FN perceptions of client progress in infancy. Mean ratings on a scale from 1 (never notice) to 10 (often notice) (N=44 and N=29) ...52
5.5 FN (N=44) and Supervisor (N=10) views of the effectiveness of supervision. Mean scores on a scale from 1 (not at all effective) to 10 (very effective) ...53
5.6 Actions that would make supervision personally more helpful. Means on a scale from 1 (would not help me) to 10 (would make supervision much more helpful to me)...53
5.7 Completion of forms, taking into account whether or not they have left FNP and their current stage of pregnancy or infancy ...55
5.8 Percent of forms completed by site ...55
5.9 Rate at which forms needed correction ...55
5.10 Extent of missing content in Home Visit Encounter forms...56
5.11 Supervisors’ views on the usefulness of monthly reports for their work, and the frequency of use on scales from 1 (not useful/ hardly ever used) to 10 (very useful/ almost always used) ...57
5.12 Supervisors’ views on reactions of the team to reports and extent to which monthly reports lead to improvement, on scales from 1 (almost always negative/not related to improvement) to 10 (almost always positive/almost always leads to improvement) 57 5.13 Work satisfaction of Family Nurses (N=44) and Supervisors (N=10) on scales from 1 (low) to 7 (high)...58
7.1 Average journey time to or from visits by site...81
7.2 Average time (hours and minutes) per nurse (N=38, excluding supervisors) on main activities over two-week diary period by site ...82
7.3 Proportion of available hours spent on client-related activities and on non-FNP training by site (N=38, excluding supervisors)...83
7.4a Proportion of all time at each site spent on different activities (N=38, excluding supervisors) ...85
7.4b Proportion of recorded non-absent time at each site spent on different activities (N=38, excluding supervisors) ...85
8.1 Smoking during pregnancy based on responses to the question “Did you smoke at all during your pregnancy?” asked at four time points, intake, 36 weeks, infancy 6 weeks
and infancy 12 months ...89
8.2 Rates of smoking and cigarettes per day at intake, for those clients who reported smoking in the previous 2 days ...89
8.3 Rates of smoking and cigarettes per day at 36 weeks gestation, for those clients who reported smoking in the previous 2 days...90
8.4 Relative reduction in the rate of smoking from intake to 36 weeks by site, based in clients with data at both time points...91
8.5 Change in the mean number of cigarettes smoked per day from pregnancy intake to 36 weeks gestation by site ...91
8.6 Rates of maternal smoking and cigarettes per day at 6 weeks infancy by site ...92
8.7 Change in the mean number of cigarettes smoked per day from pregnancy intake to infancy 6 weeks by site (N=861)...92
8.8 Mean gestational age and prematurity by site...93
8.9 Mean birth weight and Low Birth Weight (LBW) by site ...93
8.10 Time in Special Care Baby Unit (SCBU) by site...94
8.11 Gestation, prematurity, birth weight, low birth weight (LBW) and time in SCBU by maternal age at last menstrual period ...94
8.12 Gestation, prematurity, birth weight, low birth weight (LBW) and time in SCBU by maternal ethnic group...95
8.13 Gestation, prematurity, birth weight, low birth weight (LBW) and time in SCBU by reported maternal smoking at intake ...95
8.14 Rates of any breast feeding at birth, 6 weeks and 6 months by site ...95
8.15 Breast feeding rates by maternal ethnic group...96
8.16 Breast feeding rates by maternal age group ...96
8.17 Rates of emotional or physical abuse during pregnancy and infancy ...97
8.18 Reports of being hit, slapped, kicked or otherwise physically hurt during pregnancy and infancy ...97
8.19 Perceived effect of receiving FNP on parenting, from client interviews...99
8.20 Main types of referral made by FNs to other agencies, for all clients enrolled in FNP, at any time up to February 2009 (N=1304) ...100
vii
Figures
2.1 Distribution of the percentage of expected pregnancy visits received for all clients who had completed pregnancy (N=1255), taking into account gestation at intake and
attrition...15
2.2 Distribution of the percentage of expected pregnancy visits received, for clients who stayed with FNP for all their pregnancy (N=1085), taking into account gestation at intake ...15
2.3 Distribution of the percent of expected visits achieved in infancy, all clients whose infants had reached 12 months of age (N=712), taking into account gestation at intake and attrition ...19
2.4 Distribution of the percentage of expected visits achieved in infancy, all clients whose infant had reached 12 months and who did not leave in pregnancy (N=614), taking into account attrition ...19
2.5 Distribution of the percentage of expected visits achieved in infancy, all clients whose infant had reached 12 months and who were active at 12 months (N=467) ...20
3.1 Child age at which attrition took place during infancy, for all clients with infants of at least 12 months who left during infancy (N=147) ...28
4.1 Clients’ ratings of their Family Nurse on a 1 to 10 scale (N=237) ...41
4.2 Clients’ ratings of the FNP materials on a 1 to 10 scale (N=237)...43
7.1 Time Use by Family Nurses (N=38) and Supervisors (N=10), from diaries ...78
7.2 Supervisors’ client caseload and number of hours spent on client-related time...79
8.1 Distribution of client ratings on a scale from 1 to 10 of FNP making a difference in pregnancy...98
Key messages
• The FNP Programme can be delivered well in infancy, in terms of the nature of the visits and the extent to which clients are retained in the programme.
• Clients value the programme and their Family Nurse (FN) highly and report that receiving FNP is making a difference.
• The strength of the client-Family Nurse relationship is noted by clients and FNs as the key to successful delivery, making an impact, and retaining clients in the programme.
• Progress in delivery has been good overall with much useful learning but some priority areas to be addressed by FNP teams, their organisations and the central team.
• Delivery with fidelity is associated with a close knit team, no staff turnover, and strong support for FNP from the PCT and local authority.
• Current ‘impacts’ based either on the total Wave 1 population or on local groups should be treated with caution. Results may be specific to Wave 1 and there are no
comparable data for most of the reported outcomes.
• Data incompleteness remains a problem, limiting the likelihood of reliable impact data, and teams may need extra support to integrate the information based on forms into ongoing supervision.
• Sustainability needs addressing at organisational level through commissioners.
• Site variation suggests local factors such as: team cohesiveness and stability,
relationships between the supervisor and FNs, and the capacity of individuals assigned to integrate FNP into local services to give clear messages to commissioners.
• Commissioners focus on the cost of the programme. They need to be clear about what FNP is, who it is intended for, what the impacts might be, and the relevance of the existing evidence base from the USA.
• The cost of delivery appears to be approximately comparable to the USA but a substantial proportion of staff time is taken up with non-FNP activities, including professional development and mandatory NHS training.
•
Staff turnover has been high in some sites, one factor impeding successful delivery, and this may be related to a lack of clarity about where FNP sits in relation to other professional opportunities for nurses.Executive Summary
Focus of year two evaluation
• How can consistency of delivery and attaining fidelity to the programme model be achieved in the infancy phase (birth to 12 months)?
• Are those clients that drop out different from those that remain involved in the programme?
• What factors (the family, the nurse, the site) are associated with retention/attrition of clients? How can retention be maximised?
• How acceptable is FNP during infancy to families and to practitioners?
• What is the extent of father involvement during infancy in FNP and how can this be maximised?
• What are the views of children’s services commissioners about FNP and what place does it have in local service plans?
• What is the cost of delivering FNP and does this vary between sites?
Methods used for the evaluation
• Interrogation of the database that includes all forms completed by FNP.
• Structured face to face home interviews 154 clients with 6 or 12 month old infants.
• Structured telephone questionnaires with 98 clients with infants.
• Interviews with 42 mothers who terminated FNP involvement.
• Detailed case studies of 9 exemplars of client progress.
• Structured questionnaires with 44 FNs and 10 supervisors.
• Interviews with 4 staff who have left the programme.
• Staff diaries over a two week period in November 2008 with 38 FNs and 10 supervisors.
• Interviews with 35 local commissioners of services for young children and Children’s Centre managers.
• Interviews with 10 local FNP Project Leads.
• Analysis of local Children’s Service Plans and other pertinent documents relating to services for young children and their families.
Delivery of the FNP programme
• The majority (87%) of clients received at least half the expected number of visits in pregnancy, with 30% receiving 80% or more, the stretch objective to aim for once sites are well established.
• Almost two thirds (63%) of clients remaining with FNP until the start of infancy received at least half the expected number of visits; 36% receiving 65% or more, the stretch objective for infancy.
• There are substantial differences in delivery between sites.
• FNs suggest the proportion of visits could be increased by having a slower recruitment period and having more familiarity with the materials. They also note that NHS
requirements required by local managers such as keeping duplicate records and engaging in other non-FNP activities reduces their capacity to deliver FNP effectively.
• The content of visits was overall close to the US recommendations, though there was site variability that merits further investigation. Some teams focussed on maternal and environmental health at the expense of spending more time on parenting and the maternal role.
Retention of clients
• Retention of clients is close to the stretch objectives particularly for infancy at 14% in pregnancy (objective 10%) and 21% for infancy (objective 20%).
• There is some site variability, with some retaining more clients in pregnancy, others retaining more in infancy.
• Most client demographic characteristics are not related to attrition. The exceptions are that minority background black clients have a lower level of attrition than other ethnic groups in pregnancy; and clients living in households with their partner and unrelated adults were the most likely to leave in infancy, those with their partner and mother the least.
• The most common reasons for leaving, apart from practical reasons such as moving out of the area, are clients indicating that their needs have been satisfied so they can cope without the programme, and clients missing many appointments.
• Clients who had left were positive about the FNs but a number commented on being unhappy about the frequency of the visits, especially if they were in education or employment.
• FNs generally accepted that attrition would happen but felt frustrated by thoughts that they could have made more of a difference with clients.
• To avoid the likelihood that a client would leave they turned to the team for guidance, worked on the relationship with the client, and looked in more depth at the client’s immediate concerns, utilising motivational interviewing techniques. They also offered a ‘holiday’ from the programme.
• These techniques are similar to those that have been found in recent US research to reduce attrition levels.
Acceptability of FNP in infancy
• The programme is acceptable to clients, their partners and to the Family Nurses and supervisors.
• Clients were overwhelmingly positive about their FN, rating them on average 9 out of a possible 10. They also endorsed all items in a questionnaire about the nurse-client relationship.
• Clients were generally positive about the FNP materials, recalling many of those used in infancy, including some used only occasionally.
• FNs were also enthusiastic about the infancy materials and particularly those that were designed to promote mother-infant play.
• FNs noted a high level of client involvement in visits and good understanding of the materials.
• Those clients who subsequently left FNP were rated on average as having lower involvement, less understanding of and more conflict with the materials during home visits. Observed lower involvement could be used as a warning sign that measures might be needed to retain the client.
• Fathers were present for almost a quarter (22%) of all pregnancy visits and a similar percentage (24%) of all infancy visits.
• The father was present for at least one pregnancy visit for half (51%) of clients, and present for at least one infancy visit for 43% of clients.
Delivering FNP in infancy
• To enhance delivery, a supportive team was said by FNs to be the most important factor in conjunction with strong supervision.
• The main barrier to effective delivery was lack of time to learn about the materials and discuss them with colleagues.
• FNs indicated that they had to spend time on non FNP administration and meetings with other professionals.
• Newness of the teams in delivering the programme is still an issue.
• FNs considered that clients were more enthusiastic about the programme once they had their babies.
• Substantial client progress was noted by FNs and the programme allowed them to express their achievements as mothers.
• Supervision was valued and allowed FNs to reflect on issues but they would like more time to prepare for supervision sessions.
• Some aspects of delivery were variable between sites, in particular completion of forms documenting any change in clients’ demographic characteristics, health habits and relationships.
• Absence of these forms could impair the capacity of teams to monitor the progress of their clients in ways that could be useful for creating a local evidence base.
• Overall FNs and supervisors were satisfied with their work, although FNs were less satisfied than supervisors about career opportunities.
• Some stress was noted about being under scrutiny as part of a national pilot.
Support for sustainability
• Support was variable between the sites and FNP tended not to be embedded in strategic plans
• Some commissioners were not convinced about the FNP approach, mentioning its origins in the USA. They indicated that local issues and needs drove their decision making.
• Most infrastructure difficulties noted in Year 1 have been resolved but several teams have move premises more than once, which may reflect the challenge of positioning FNP in relation to other local services.
• Some of the commissioners’ comments reflected a lack of understanding about FNP, such as suggestions for modifying the programme and for sharing the materials with other professionals so that a ‘pared down’ version could be used more widely.
• Commissioners were concerned about the cost of delivering FNP, particularly since the benefits may be long-terms, and may not be health related (e.g. fewer of the children become delinquent as teenagers).
• There was some concern that existing services such as specialist midwives might suffer through the introduction of FNP to the area.
• Integration of FNP with children’s centre services was variable.
Costs and workforce
• The estimated cost of delivering FNP is around £3,000 per client a year, comparable to the cost of the programme in the USA.
• Most of the existing USA information on benefits relative to costs is based on longer term child outcomes such as avoiding academic under achievement and delinquency.
• FNs spend on average 60 per cent of their time on visits prescribed by the programme or other related activity such as preparation for visits, travel and notes. For FNs 35% of their time was taken with client direct contact.
• This varied between the sites from 57% to 23% but there are some discrepancies between sites in the way that non-working days were recorded.
• In the two week period there were, across all 10 sites, 538 successful client visits and 143 unsuccessful ones (21%), where the client cancelled or was not present.
• Some comments made in dairies indicate it has been difficult to arrange visits for mothers in paid work.
• The use of time in 2008 was close to that found in 2007 with no change in the amount of time spent in non-FNP activities, reflecting ongoing pressure to maintain NHS related training requirements and anxiety that working in FNP will not be a long-term career path.
• Comparisons between the two years were hampered by incomplete information about the total hours worked by each staff member.
Potential impacts of FNP
• Clients and FNs indicated that they believed good progress had been made in parenting and in other life skills.
• Case studies illustrate substantial gains in mothers developing relationships with infants and improving difficult relationships with fathers, often in the face of initial low
engagement or risk factors such as having been in care. These generally involved much multi-agency working and were facilitated by the strong Family Nurse-client relationship.
• Almost three quarters of all enrolled clients (943/1304; 72%) had been referred to other services by their Family Nurse, most often for financial assistance (39%), maternal health (35%), housing (27%) or infant health (23%).
• There was a relative reduction in smoking of 20% from early in pregnancy (40%) to 36 weeks gestation (32%); however this average masks substantial differences between sites.
• Site variation is affected both by the proportion of clients who report smoking at intake (very low in some areas) and by whether all the necessary health habits forms were completed at both time points during pregnancy.
• Breast feeding initiation was 63%, with more than a third (36%) of these clients still breastfeeding at 6 weeks, which is promising in relation to the rates identified in national surveys for socio-economically disadvantaged mothers.
• There was a wide range in breastfeeding initiation rates between sites, from 38% to 86%.
• The 1003 (singleton) infants were born on average at 39 weeks gestation, with 7.4% premature; their average birth weight was 3221 grams, with 9.2% LBW.
• Just under one quarter (23%) of clients reported experiencing some physical or emotional abuse since their infant’s birth, which might reduce the likelihood of FNP having an impact.
• Just under one third (30%) of clients with infants who were interviewed, representative of the total group demographically, had been to a children’s centre in the previous three months, mainly for play sessions or infant massage.
Conclusions
• These first 10 sites continue to make good progress in establishing how to provide the FNP programme in an English context.
• Despite being new to each stage of the programme, delivery in England has come close to stretch objectives, but there is substantial site variability.
• A small number of sites, with cohesive teams and strong local support, are performing at a high level, and a small number are performing less well. These sites are typified by high staff turnover and ambivalent support from the wider service community.
• Clients and staff alike continue to report a great deal of positive regard for the programme.
• Some FNs are offering the programme in a more flexible manner, especially in terms of the frequency of visits, in order to keep clients involved when their lives become busy, such as when they embark on education or employment.
• There is some way to go in terms of helping local commissioners and managers of children’s services to understand the FNP more accurately, and where it fits in the range of services that are part of the Child Health Promotion Programme.
• Strong central leadership will continue to be necessary to facilitate the roll out of FNP to other areas, in conjunction with local advocacy.
Chapter 1 - Introduction
This report examines the second year of the implementation of a pilot Nurse Family
Partnership (NFP) programme in ten sites in England. The programme is an evidence-based nurse home visiting programme developed in the USA (where it is called the Nurse Family Partnership) and designed to improve the health, well-being and self-sufficiency of young first-time parents and their children (Olds, 2006). The programme is offered to first-time young mothers early in pregnancy (ideally before 17 weeks gestation) and continues until their child is 24 months old. There are three main aims, to improve maternal and child pregnancy outcomes, to improve child health and developmental outcomes, and to improve parent’s economic self-sufficiency.
There is a detailed curriculum for delivering the programme with many reading materials and activities and there is a recommended schedule of visits, but it is expected that the Family Nurses delivering the programme will use the materials flexibly, in relation to particular client needs. A full time Family Nurse has a maximum of 25 clients and they generally work in teams of four with a supervisor and administrator. Supervision is frequent and includes both individual work and group sessions. In the USA it has been tested in three RCTs with benefits found for mothers and their children and in particular more benefits for the most vulnerable. Specifically, the trials identified better maternal prenatal health, fewer child injuries, longer intervals between subsequent births, more father involvement, more maternal employment, less reliance on welfare support, better child school readiness and, when the children were teenagers, less substance use initiation and behaviour problems.
A. Brief summary of year one findings
The programme was introduced to the UK in April 2007 in 10 pilot sites throughout England. The first year of the UK implementation evaluation (Barnes et al., 2008) documented, analysed and interpreted the feasibility of implementing the programme in the sites using a range of qualitative and quantitative methods including: interviews with all the Family Nurses working in the sites; with local staff and stakeholders; and with clients and their families. Exploratory techniques, including observation, reflection, web-based information, and diary-keeping contributed to a multi-level understanding of the experience of the programme. All of the quantitative data collected as an established part of the intervention were analysed by the evaluation team.
The result of this intensive enquiry in the first year concluded that:
• The programme, called the Family Nurse Partnership (FNP) in England, could be delivered effectively, but some sites were still some way from the ‘stretch objectives’ that the US model links with optimal programme delivery. While the content and length of visits were close to the recommendations, it had proved challenging to provide the optimal number of visits during pregnancy.
• The evaluation highlighted some reasons why this might be occurring. Major factors were the newness of the staff to working in this particular way, the organisational delays in some areas in establishing the infrastructure necessary for smooth team working and pressure to recruit their full caseload in a short space of time.
• The FNP was reaching those who were likely to benefit from it with eligibility of women of 19 and under. It was recommended that further testing should focus on whether it should be offered to 20-22 year olds. Recommendations were made about refining and improving recruitment procedures.
• The programme was acceptable to young first-time mothers but in some sites attrition during pregnancy was high. The programme was acceptable to fathers and many took up the offer of being involved in the home visits and in studying the accompanying materials. Further work was needed to understand why clients refused or left the programme and factors associated with attrition such as dosage and client demographic characteristics.
• Practitioners working in the programme valued the learning, recognised the potential benefits of the programme to clients, and considered it differed substantially from their previous roles as health visitors or midwives.
• FNs recognised the benefits of using a structured programme, developing a different kind of relationship with clients, using new skills and reaching real need. Various barriers to effective working were identified.
• The work was demanding on practitioners and establishing the unique form of supervision had been a challenge for sites.
• Organisational infrastructure and support had an impact on successful delivery of the programme, and there were issues around the integration of FNP with wider services for children and families.
• The first year looked at a range of short-term programme objectives, including smoking reduction during pregnancy, breastfeeding rates, engagement with fathers and various other client behaviours.
The evaluation identified factors that supported or hindered high quality programme delivery but which would require further examination, which will be addressed in this report.
Outstanding issues include:
• Should the FNP be protected as a discrete programme or integrated within the multi-agency children’s service?
• What are the appropriate caseload size, workload and fidelity requirements within the English context?
• How much time are FNs spending on non-programme activities?
• Guidance needed for FNs on dealing with ongoing scrutiny of their work through routine data collection and supervision?
• What the therapeutic relationship of FNP means to professional practice?
• What is the role of central support in the future development of the programme? It was recommended that an RCT be conducted to determine the impact of the FNP on clients, their children and families. This has now been commissioned and is underway.
B. Questions addressed in year two
In the second year of operation for the 10 Wave 1 pilot sites the research described in this report was designed principally to test the applicability of the NFP model when offered during infancy (much of the first year related only to pregnancy), modified for UK procedures and requirements and informed by UK best practice. In addition some of the information about pregnancy from the Year 1 report (such as ‘dosage’, the content of visits, changes during
pregnancy in smoking and outcomes for infants) are updated now that almost all the clients in those sites have given birth, apart from some new clients taken on to ‘top-up’ caseloads. The place of FNP within the range of services available through Children’s Centres and as set out in local Children’s Service Plans is a particular focus as well as Commissioners’ understanding and perceptions of FNP.
The work has addressed the following questions:
• How can consistency of delivery and attaining fidelity to the programme model be achieved?
• Do families receiving FNP in infancy differ in any substantial way from the population reached during pregnancy? That is, are those that drop out different from those that remain involved in the programme?
• What factors (the family, the nurse, the site) are associated with retention/attrition of clients? How can retention be maximised?
• How acceptable is FNP during infancy to families and to practitioners?
• What is the extent of father involvement during infancy in FNP and how can this be maximised?
• What are the views of children’s services commissioners about FNP and what place does it have in local service plans?
• What is the cost of delivering FNP and does this vary between sites?
C. Methodology
The main methods that have been used in Year 2 are:
1.
Interrogation of the database that includes all forms completed by FNP nurses to illuminate issues of fidelity of delivery, referrals to additional services and attrition.2.
Structured face to face home interviews with an 8-10% sample of the families in receipt of FNP, half of whom had an infant of approximately 6 months (N=87) and half an infant of 12 months (N=67) to examine methods of assessing potential impacts for infant and family and what they thought about the programme during the infancy phase. The 154 randomly selected interviewees were compared to the larger group of clients with children of at least 6 months old during the time period that the interviews were conducted and who were not interviewed over the telephone or at home (N= 683) to ensure representativeness. Comparisons were made of maternal age, gestation at intake, marital status, household structure, number of household members, maternal educational status, maternal employment status, maternal smoking at intake and ethnic group and there was only one significant difference between the groups. Clientsreporting smoking at intake were underrepresented in the interviewed group (smoker: interviewed at home 31%, not interviewed 41%, total group 39%, p<0.05).
3.
Brief, structured telephone questionnaires administered to a further 10% of the FNP clients with infants of various ages (N=98) to determine satisfaction with FNP, service use beyond FNP with a particular focus on Children’s Centres, and the involvement of partners in FNP. To see if the randomly selected interviewees was representative of the larger group they were compared to all enrolled clients with infants who were not4.
Interviews with as many as possible of the mothers who terminated FNP involvement during the post-natal/infancy phase to identify their reasons for termination (N=42). It was not possible to contact all those who left for an interview and many had changed their contact details when contact was attempted. To see if those interviewed were representative of all leavers they were compared to the leavers who were notinterviewed (N=352) in terms of their age, gestation at intake, marital status, household structure, educational status, employment status, smoking at intake and ethnic group and there were no statistical differences between those interviewed and the remainder of the leavers.
5.
Detailed case studies of 9 clients, selected after discussion with the sites, as exemplars of those making good progress.6.
Structured questionnaires with all the nursing staff involved in offering the service (44 family nurses and 10 supervisors) who had been in post for at least 12 months on 2 occasions to examine the acceptability of FNP during infancy, barriers to and facilitators of attaining fidelity and perceptions of supervision and training requirements. On the first administration of the questionnaire 100% were returned. On the secondadministration only 40 FN questionnaires were distributed since 4 FNs were no longer in that role. Of the 40, 36 (90%) were returned.
7.
Interviews with staff who have left the programme during the second year of the programme (N=4).8.
Staff diaries over a two week period in November 2008 to determine the costs of the service and set this in the context of the cost of related services. They were completed by 38 of 44 FNs and all 10 supervisors.9.
Interviews with local commissioners of services for young children and Children’s Centre managers (N=35).10.
Interviews with all local FNP Project Leads (N=10).11.
Analysis of local Children’s Service Plans and other pertinent documents to determine whether FNP is integrated in to future planning.A summary of the number of interviews conducted by site is in Appendix A.
Chapter 2 - Delivering FNP with Fidelity
The Nurse Family Partnership (NFP) National Service Office in the USA has outlined objectives to help sites track the extent to which they are delivering the programme with fidelity, based on data from the three USA research trials and early dissemination
experiences (see Appendix B). The objectives are designed to help supervisors and their teams improve programme quality and are considered long-term goals to strive for over time, hence they are generally referred to as ‘stretch objectives’.
The performance of the 10 wave 1 sites in England is at the starting point of a long-term trajectory given that none of the sites have yet to see one client through to the point where their child is 24 months old. For each phase (pregnancy, infancy, toddlerhood) the FNs will have been new to the materials when they used them with the first clients recruited to their caseloads.
The figures provided in this report concentrate on those findings that are the most reliable. Thus delivery during pregnancy focuses on those clients (the majority, N=1255) who had completed pregnancy in that they had given birth. Programme delivery in infancy similarly focuses on those clients whose infants had reached 12 months (N=712) and thus completed the infancy phase. The third phase of the programme, from 13 to 24 months, is referred to as ‘Toddlerhood’ and is discussed only briefly.
A. Amount of support delivered
It is commonplace for a proportion of clients recruited into evaluation studies not to receive the intended support at all (e.g. Barnes et al., 2006). They agree to receive the programme and then either decide immediately that they do not want it or are subsequently not
contactable. For example, in the Elmira and Memphis trials of the NFP programme, while the average number of visits conducted in pregnancy were 9 and 7 respectively (out of a
recommended 14) in each of the sites some clients had no visits (Olds, 2006). Similarly the range of visits conducted in these two trials from the time of birth up to the child’s second birthday had a minimum of zero in each site. In an evaluative trial this range is taken into account statistically whereas when the service is being offered as a service, not as part of a trial, it is relevant for service planning and staffing requirements to know the extent to which families receive some, or all, of the programme.
Pregnancy
All clients described in the tables and figures pertaining to pregnancy visits had given birth so had completed their pregnancy. Based on the expectation that the majority (at least 60% is recommended) of clients are ideally enrolled by 16 weeks gestation the programme materials itemise 14 pregnancy visits - designed to be weekly for the first 4 weeks and then fortnightly until the baby’s birth. The stretch objective set out by NFP US National Service Office for the amount of the programme that ideally should be delivered during pregnancy is that 80% or more of expected visits should be made (see Appendix B).
The proportion of the expected number of visits completed in pregnancy is calculated in two different ways. The first method simply divides the number of visits completed during
pregnancy by the number of visits outlined in the programme materials (14). On this basis, to reach the stretch objective it is necessary to have11 or more visits during pregnancy. The
second method of calculating the proportion of expected visits that were delivered takes into
account the client’s gestational age at enrolment and also whether or not the client has left the programme during pregnancy. Thus someone enrolled at 25 weeks would not be expected to receive the full complement of 14 visits, and one who left while she was
pregnant would have the expected number of visits frozen at that time-point. It is important to examine the proportion of expected visits taking into account gestation since sites may vary in the extent to which they can recruit clients prior to 16 weeks. In the first year of the evaluation it was found that the links between midwifery and the FNP team differed so that some sites routinely received clients further on in their pregnancy, particularly sites 4, 8, 9 and 10. It is also important in implementation evaluation (as opposed to a randomised controlled trial) to understand the experience of real-life clients, some of whom may not remain in the programme. In a trial anyone included at the outset is perceived to be a participant for as long as the study or intervention progresses - in the case of FNP until the child is 24 months old. In the ‘real world’ once a client ceases to be involved, to maintain a full case-load the FN will recruit a new client, so the number enrolled changes over time. Those who have left are no longer considered the responsibility of the FN, thus to indicate that she has not delivered visits to these ex-clients would misrepresent the quality of programme delivery.
The analyses of the percentage of expected pregnancy visits received are conducted first for all clients enrolled who had completed their pregnancy (to give a reliable estimate of delivery throughout pregnancy; N=1255, Table 2.1) and then for those who remained with FNP throughout their pregnancy (N=1085, Table 2.2) to give an optimal picture based on presumably the more enthusiastic clients.
Using the first method of calculating the percentage of visits received, based on the proportion of 14 visits, the distribution indicates that 20% of all clients received at least 11 visits which is equivalent to the objective of 80% (Table 2.1, column 3) while a large
proportion (503/1255, 40%) were close to that level of delivery with 50% to 79% of expected visits, which would translate to 7-10 visits. Using the second of estimating the percentage of expected visits received, taking into account gestation at intake and whether the client left part-way through pregnancy, the proportion of clients receiving 80% or more of their expected visits is greater at 30% (373/1255; Table 2.1, column 7) with a further 592 (47%) receiving between 50% and 79% of their expected visits. Fewer than a quarter of clients (290/1255, 23%) had less than 50% of their expected visits while a small minority (48, 4%) were visited more frequently than their expected number, suggesting additional
vulnerabilities that were being addressed. The distribution of expected visits based on the second method of calculation is presented visually in Figure 2.1.
When only those clients who remained with FNP throughout their pregnancy are included, a slightly greater proportion achieved 11 or more visits (253/1085, 23%; see Table 2.2, column 3). Similarly, a greater proportion were supported at the level of 80% or more of expected visits (32%, see Table 2.2, column 7) and a smaller proportion received less that 50% of the expected visits (189/1085, 17%). From Figure 2.2 it can be seen that the most common proportion of expected visits received for this group (N=221, 20%) was just under the stretch objective of 80%, with 70-79% of visits.
Table 2.1 - Distribution of the percentage visits received for all enrolled clients who completed their pregnancy (N=1255), first the percentage of 14 visits and then the percentage of expected visits taking into account gestation at intake and leaving the programme
% of 14 visits
N
% Sum %
% of expected visits
N
% Sum %
<10 % 77 6.1 6.1 <10 % 13 1.0 1.0
10-19% 66 5.3 11.4 10-19% 42 3.3 4.4
20-29% 155 12.4 23.7 20-29% 80 6.4 10.8
30-39% 85 6.8 30.5 30-39% 86 6.9 17.6
40-49% 115 9.2 39.7 40-49% 69 5.5 23.1
50-59% 239 19.0 58.7 50-59% 142 11.3 34.4
60-69% 152 12.1 70.8 60-69% 220 17.5 52.0
70-79% 112 8.9 79.8 70-79% 230 18.3 70.3
80-89% 179 14.3 94.0 80-89% 184 14.7 84.9
90-100% 30 2.4 96.4 90-100% 141 11.2 96.2
101-120% 33 2.6 99.0 101-120% 24 1.9 98.1
121+% 12 1.0 100.0 121+% 24 1.9 100.0
Total 1255 Total 1255
80+% (11+) 254 20.2 80+% 373 29.7
Table 2.2 - Distribution of the percentage visits received for all clients who remained with FNP for their pregnancy (N=1085), first the percentage of 14 visits and then the percentage of expected visits taking into account gestation at intake and leaving the programme
% of 14
visits N %
Sum %
% of expected
visits N %
Sum %
<10 % 20 1.8 1.8 <10% 9 0.8 0.8
10-19% 36 3.3 5.2 10-19% 20 1.8 2.6
20-29% 102 9.4 14.6 20-29% 39 3.6 6.2
30-39% 76 7.0 21.6 30-39% 63 5.8 12.0
40-49% 109 10.0 31.6 40-49% 58 5.4 17.4
50-59% 229 21.1 52.7 50-59% 123 11.3 28.7
60-69% 150 13.8 66.5 60-69% 203 18.7 47.4
70-79% 110 10.1 76.7 70-79% 221 20.4 67.8
80-89% 179 16.5 93.2 80-89% 180 16.6 84.4
90-100% 30 2.8 95.9 90-100% 125 11.5 95.9
101-120% 33 3.0 99.0 101-120% 24 2.2 98.1
121+% 11 1.0 100.0 121+% 20 1.8 100
Total 1085 Total 1085
80+% (11+) 253 23.3 80+% 349 32.2
[image:24.595.91.507.399.634.2]Figure 2.1 - Distribution of the percentage of expected pregnancy visits received for all clients who had completed pregnancy (N=1255), taking into account gestation at intake and attrition
Percent of expected visits in pregnancy
121+
101-20 90-100 80-89 70-79 60-69 50-59 40-49 30-39 20-29 10-19 <10
Pe
rce
n
t
20.0%
15.0%
10.0%
5.0%
0.0%
Figure 2.2 - Distribution of the percentage of expected pregnancy visits received, for clients who stayed with FNP for all their pregnancy (N=1085), taking into account gestation at intake
Percent of expected visits in pregnancy
121+
101-20 90-100 80-89 70-79 60-69 50-59 40-49 30-39 20-29 10-19 <10
Pe
rc
en
t
25.0%
20.0%
15.0%
10.0%
5.0%
0.0%
Site comparisons, pregnancy
The average number of visits completed in pregnancy, in total and by site, is given in Table 2.3. Clients received on average about half of the14 visits that are described in the
pregnancy materials (mean = 7.4). Site means differ significantly, ranging from 6.1 (site 10) to 9.0 (site 3). The average percentage of the 14 visits completed was 53%, ranging from 44% (sites 8 and 10) to 64% (site 3). There were also significant differences between the sites in the proportion of clients achieving at least 80% of the 14 pregnancy visits, ranging from only 4% in site 9, with three other sites at or below 10%, to almost half (46%) in site 3.
[image:25.595.164.438.373.584.2]Table 2.3 - Including all enrolled clients who had completed their pregnancy (N=1255), the mean number of visits in pregnancy and the percentage of 14 visits completed, by site
Site N
Mean
visits Range
Mean % of 14 visits achieved
Range of % achieved
% with 80% or more
1 109 8.1 1-19 58 7 – 136 30
2 110 8.2 1-17 59 7 – 141 28
3 188 9.0 1-16 64 7 – 114 46
4 152 6.5 0-15 46 0 – 107 9
5 115 8.2 1-18 59 7 – 129 23
6 98 7.2 1-14 51 7 – 100 14
7 107 7.5 1-20 53 7 – 143 21
8 131 6.2 0-24 44 0 – 171 8
9 129 6.5 0-12 46 0 – 86 4
10 116 6.1 1-14 44 7 – 100 10
Total 1255 7.4 0-24 53 0 – 171 20
Table 2.4 provides information using the second method to calculate the percentage of expected visits in pregnancy, taking into account each client’s gestation at enrolment and whether or not they had subsequently left the programme during their pregnancy. Calculating the percentage of expected visits on this basis, the mean number of expected visits overall is less than 14 at 11.2, ranging between sites from 9.8 (site 9) to 12.7 (site 1). The average percentage of expected visits achieved in Table 2.4 is, not surprisingly, higher than that in Table 2.3 given that most were not expected to receive all 14 visits. The mean of 66% is closer to the stretch objective of 80% of visits. In addition a larger proportion (30% vs. 20% in Table 2.3) of clients received at least 80% of their expected visits. There are again significant site differences, with site 3 achieving the highest proportion of clients receiving at least 80% of their expected visits (44%), the lowest proportions being in sites 1, 4, 6 and 10, all below a quarter of clients.
Table 2.5 presents the same information, but including only those clients who remained with FNP for the whole of their pregnancy. While the calculation of expected visits for all clients does take into account attrition (i.e. the calculation stops at the point where they left so no more visits are expected), those clients remaining with the programme appear to have been slightly more likely to receive a larger percentage of visits with an average of 69% of their expected visits; almost one third (32%) received 80% or more. Thus they may be more responsive overall, less likely to cancel or not be at home when the FN calls. Site 3 again has the highest proportion with 80% or more and sites 4 and 10 the lowest. Overall if clients remain with FNP throughout their pregnancy they are likely, throughout England, to receive more than two thirds of their expected visits. Clients in site 3 were the most likely to receive this level of support, with site 5 close behind whereas in other sites this was not so frequent. In all but one site some clients received more than 100% of expected visits in pregnancy (see Tables 2.4 and 2.5) so there is potential to increase the proportion of clients receiving at least 80% of visits, if a cap were placed on the number of visits. However it should be
assumed that there were good reasons why more frequent visits were made, based on client vulnerability and need.
Table 2.4 - Including all enrolled clients who had completed their pregnancy (N=1255), pregnancy visits completed and the percentage of expected visits, taking into account gestation at intake and attrition, by site
Site N
Mean
visits Range
Mean visits expected Mean % of expected achieved Range % of expected achieved % with 80% or more
1 109 8.1 1-19 12.7 63 7 - 119 24
2 110 8.2 1-17 11.7 70 15 - 140 30
3 188 9.0 1-16 12.1 73 14 - 200 44
4 152 6.5 0-15 10.7 62 0 - 200 22
5 115 8.2 1-18 11.1 74 20 - 125 39
6 98 7.2 1-14 12.0 60 6 - 100 18
7 107 7.5 1-20 11.6 64 9 - 167 25
8 131 6.2 0-24 10.0 63 0 - 136 30
9 129 6.5 0-12 9.8 69 0 - 200 36
10 116 6.1 1-14 10.7 57 8 - 125 21
[image:27.595.78.523.375.589.2]Total 1255 7.4 0-24 11.2 66 0 - 200 30
Table 2.5 Including clients remaining with FNP throughout their pregnancy (N=1085), pregnancy visits completed and the percentage of expected visits, taking into account gestation at intake and attrition, by site
Site N
Mean
visits Range
Mean visits expected Mean % of expected achieved Range % of expected achieved % with 80% or More
1 92 9.1 2-19 13.4 68 12-119 26
2 98 8.8 3-17 12.2 73 27-140 33
3 144 10.7 3-16 13.6 81 23-186 52
4 128 7.3 0-15 11.5 64 0-200 23
5 101 8.9 3-18 11.8 76 29-125 42
6 83 7.8 1-14 12.6 63 14-100 21
7 96 8.0 1-20 12.1 66 9-167 26
8 124 6.4 0-24 10.1 64 0-136 31
9 118 6.9 0-12 10.3 69 0-133 36
10 101 6.7 1-14 11.0 61 8-125 24
Total 1085 8.1 0-24 11.8 69 0-200 32
While the programme is guided by a detailed curriculum, a particular strength of the FNP support is that the FNs provide the programme with flexibility. Thus it is likely that there will always be some clients who require more than 100%. There may also always be clients who receive a small proportion of visits during pregnancy, but who are kept in the programme in the hope that their involvement will increase in the future once their baby has been born. This strategy is discussed in more detail in Chapter 3, dealing with ways to increase client
retention.
Infancy
All the figures and tables pertaining to delivery in infancy refer to clients whose infant had reached 12 months, so that the infancy phase was complete. The programme materials are designed so that there can be 28 infancy visits, offered weekly for 6 weeks after the baby’s birth and then fortnightly, and the stretch objective for infancy is lower than that proposed for pregnancy, for clients to achieve at least 65% of the expected visits. The percentage of expected infancy visits completed is presented for three groups of clients (see Table 2.6). First figures are given for all wave 1 clients whose child had reached 12 months, including those who had at some point during pregnancy or infancy left FNP (N=712). Secondly, figures are given for clients with a child of at least 12 months old who remained with the programme throughout pregnancy and thus would be expected to have some infancy visits (N=614). Finally figures are given for the smaller group whose infant had reached 12 months of age and who were still with FNP (N=467), who would be the most likely to receive the full complement of 28 visits. All calculations of expected infancy visits take into account the time of departure from the programme, i.e. no visits are expected once the client has been identified by their FN as leaving the programme. If a client left during pregnancy then their percentage of expected infancy visits has been set at 0 so that they can be included in the calculations.
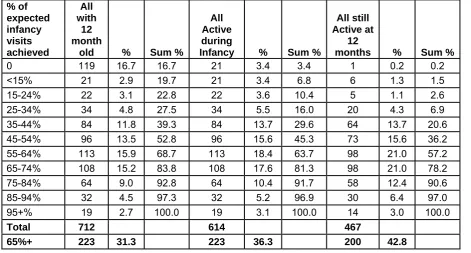
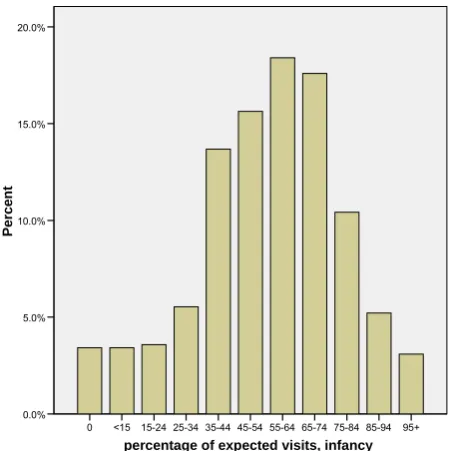
[image:28.595.69.541.519.772.2]Just over a quarter of those whose baby had reached 12 months (223/712, 31%) had received at least 65% of the expected number of visits during infancy with a further 16% (113) receiving between 55 and 64% (see Table 2.6). However it can be seen in Table 2.6 and Figure 2.3 that a substantial proportion (17%) received no infancy visits at all, principally because they left the programme during pregnancy. Excluding those clients, a rate of at least 65% of expected visits was achieved for more than one third (223/614, 36%) and by close to half the clients who were still active at 12 months (200/467, 43%; see Table 2.6). It can be seen (Figure 2.4) that the most common client experience for those who did not leave in pregnancy was to receive just under the expected number of visits at 55 to 64% (18%) and that only a small proportion (64/614,10%) received less than a quarter of their expected visits. For those remaining throughout pregnancy (Figure 2.5) it was as likely that clients would receive 55 to 64% or 65 to 74%.
Table 2.6 - Distribution of the percentage of expected infancy visits received, for all clients whose infant had reached 12 months of age (N=712), the subgroup active during infancy (N=614), and the subgroup active at 12 months (N=467), taking into account attrition
% of expected infancy visits achieved
All with
12 month
old % Sum %
All Active during
Infancy % Sum %
All still Active at
12
months % Sum %
0 119 16.7 16.7 21 3.4 3.4 1 0.2 0.2
<15% 21 2.9 19.7 21 3.4 6.8 6 1.3 1.5
15-24% 22 3.1 22.8 22 3.6 10.4 5 1.1 2.6
25-34% 34 4.8 27.5 34 5.5 16.0 20 4.3 6.9
35-44% 84 11.8 39.3 84 13.7 29.6 64 13.7 20.6
45-54% 96 13.5 52.8 96 15.6 45.3 73 15.6 36.2
55-64% 113 15.9 68.7 113 18.4 63.7 98 21.0 57.2
65-74% 108 15.2 83.8 108 17.6 81.3 98 21.0 78.2
75-84% 64 9.0 92.8 64 10.4 91.7 58 12.4 90.6
85-94% 32 4.5 97.3 32 5.2 96.9 30 6.4 97.0
95+% 19 2.7 100.0 19 3.1 100.0 14 3.0 100.0
Total 712 614 467
65%+ 223 31.3 223 36.3 200 42.8
Figure 2.3 - Distribution of the percent of expected visits achieved in infancy, all clients whose infants had reached 12 months of age (N=712), taking into account gestation at intake and attrition
percentage of expected visits, infancy
95+ 85-94 75-84 65-74 55-64 45-54 35-44 25-34 15-24 <15 0
Perce
n
t
20.0%
15.0%
10.0%
5.0%
0.0%
Figure 2.4 - Distribution of the percentage of expected visits achieved in infancy, all clients whose infant had reached 12 months and who did not leave in pregnancy (N=614), taking into account attrition
percentage of expected visits, infancy
95+ 85-94 75-84 65-74 55-64 45-54 35-44 25-34 15-24 <15 0
Percen
t
20.0%
15.0%
10.0%
5.0%
0.0%
[image:29.595.187.413.409.635.2]Figure 2.5 - Distribution of the percentage of expected visits achieved in infancy, all clients whose infant had reached 12 months and who were active at 12 months (N=467)
percentage of expected visits, infancy
95+ 85-94 75-84 65-74 55-64 45-54 35-44 25-34 15-24 <15 0
P
e
rcent
25.0%
20.0%
15.0%
10.0%
5.0%
0.0%
Site comparisons, infancy
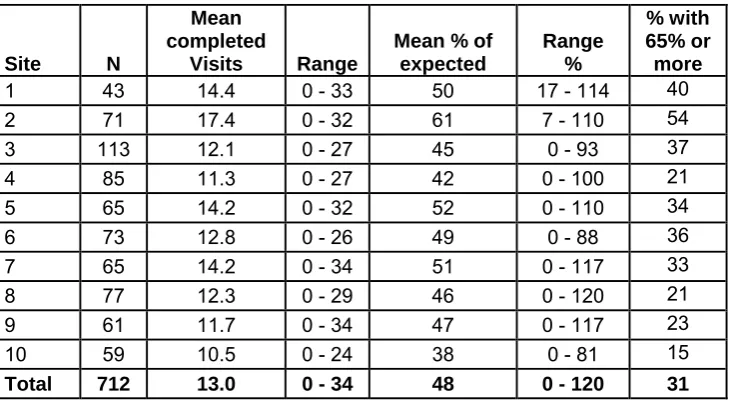
The mean number of visits received overall in infancy was 13.0 and the average percent of expected visits received was just under half (48%, see Table 2.7). Site 2 completed the largest number of visits in infancy and site 10 the least. In site 2 more than half the clients enrolled whose child had reached 12 months received 65% or more of the expected visits, compared to only 15% in site 10 and just over 20% in sites 4, 8 and 9.
Table 2.7 - Infancy visits completed and the percentage of expected visits by site, for all enrolled clients whose children were at least 12 months old (N=712)
Site N
Mean completed
Visits Range
Mean % of expected
Range %
% with 65% or more
1 43 14.4 0 - 33 50 17 - 114 40
2 71 17.4 0 - 32 61 7 - 110 54
3 113 12.1 0 - 27 45 0 - 93 37
4 85 11.3 0 - 27 42 0 - 100 21
5 65 14.2 0 - 32 52 0 - 110 34
6 73 12.8 0 - 26 49 0 - 88 36
7 65 14.2 0 - 34 51 0 - 117 33
8 77 12.3 0 - 29 46 0 - 120 21
9 61 11.7 0 - 34 47 0 - 117 23
10 59 10.5 0 - 24 38 0 - 81 15
Total 712 13.0 0-34 48 0 - 120 31
In each of the sites some of the clients had left during pregnancy. Table 2.8 excludes them and gives information about those clients who were still with FNP at the beginning of infancy. For that group the overall average of expected visits received was close to the stretch
objective of 65% at 55%, with an average of 60% or above in 4 of the 10 sites. In sites 2 and 3 more than half the clients had received at least 65% of visits with sites 1 and 6 close to
[image:30.595.117.482.483.684.2]that. By contrast, in four sites (4, 8, 9, and 10) less than a quarter of clients received 65% or more of their expected visits.
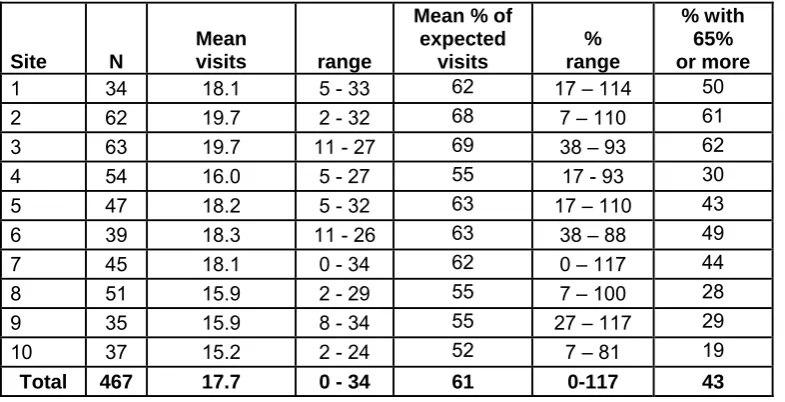
[image:31.595.104.497.451.652.2]Including only those clients still with the programme when their baby was 12 months old (N=467, see Table 2.9) the mean percentage of expected visits overall was higher still at 61%, and overall 43% had received at least 65% with the highest proportions again in sites 2 and 3.
Table 2.8 - Infancy visits completed and the percentage of expected visits by site, for clients whose children were at least 12 months old and who did not leave FNP during pregnancy (N=614)
Site N
Mean completed
Visits range
Mean % of expected
% range
% with 65% or more
1 36 17.2 3- 33 60 17 - 114 47
2 64 19.3 2 - 32 68 7 - 110 59
3 79 17.3 1 - 27 64 8 - 93 53
4 74 12.9 0 - 27 48 0 - 100 24
5 57 16.1 0 - 32 60 0 - 110 39
6 63 14.8 0 - 26 57 0 - 88 41
7 57 16.2 0 - 34 58 0 - 117 37
8 76 12.5 0 - 29 46 0 - 120 21
9 58 12.3 0 - 34 49 0 - 117 24
10 50 12.4 0 - 24 45 0 - 81 18
Total 614 15.0 0-34 55 0 - 120 36
Table 2.9 - Infancy visits completed and the percentage of expected visits by site, for clients whose children were at least 12 months old and who were still active at 12 months (N=467)
Site N
Mean
visits range
Mean % of expected
visits
% range
% with 65% or more
1 34 18.1 5 - 33 62 17 – 114 50
2 62 19.7 2 - 32 68 7 – 110 61
3 63 19.7 11 - 27 69 38 – 93 62
4 54 16.0 5 - 27 55 17 - 93 30
5 47 18.2 5 - 32 63 17 – 110 43
6 39 18.3 11 - 26 63 38 – 88 49
7 45 18.1 0 - 34 62 0 – 117 44
8 51 15.9 2 - 29 55 7 – 100 28
9 35 15.9 8 - 34 55 27 – 117 29
10 37 15.2 2 - 24 52 7 – 81 19
Total 467 17.7 0 - 34 61 0-117 43
Thus overall, more than a third of the clients who stayed with FNP until their child was born went on to receive at least 65% of the recommended number of infancy visits, and this was not surprisingly more likely if they were still considered an active client when their baby was 12 months old. Some sites appear to be managing to get close to this stretch objective while others are struggling. The infancy objective is not influenced by aspects of the client group at intake (i.e. their gestational age) suggesting that factors related to team functioning or other events (such as staff on sick or leaving) may be important in explaining the wide variation between sites. This is discussed in Chapter 9.
Since some clients deemed active received no infancy visits, or only a small number (the range of visits was from 5 or fewer in 7 of the 10 sites for clients said to be still active at the end of infancy, see Table 2.9), efforts are apparently being made to keep clients engaged even when they are not visited. Given that there are some ‘dormant’ clients on caseloads it may be necessary to increase the number of clients per FN to take this into account. This is discussed in more detail in Chapter 7 in relation to the proportion of FN time that is spent on client contact or programme related activity.
B. Family nurse views on attaining stretch objectives
[image:32.595.104.494.285.626.2]Family Nurses (N=44) were sent questionnaires asking about their views on what would help them to improve the proportion of visits made to their clients and all responded. Given a list of possible solutions they were asked to rate each on a scale from 1 (not helpful) to 10 (very helpful).
Table 2.10 - Strategies FNs predict would increase dosage. Mean ratings on a scale from 1 (not helpful) to 10 (very helpful)
Possible changes to increase dosage Mean
1 Have a longer recruitment period in future 9.6
2 Having more familiarity with FNP materials 8.8
3 Reduce the requirement to keep duplicate NHS records 8.2
4 More time for team discussion about materials 8.0
5 More administrative support for preparing materials 7.8
6 Improved speed and rate of action by other agencies in
response to Family Nurse requests. 6.6
7 Improved access for clients to other services 6.5
8 Reduce the amount of non- FNP activities required by local
managers 6.2
9 Having the additional skills to be able to adapt my approach
more readily to individual families 5.7
10 Fewer requirements to speak to professional groups 5.5
11 Complete FNP data forms electronically with clients during the
visit 5.3
12 Making catchment area smaller 5.2
13 Reduce the number of multi-professional meetings 5.1
14 More time spent looking at reports from the database 4.5
Almost all considered that a different and less compressed period of recruitment would have increase the likelihood of achieving better dosage (see Table 2.10, item 1). They rated as very useful administrative changes such as not having to keep duplicate NHS records (item 3) and not having to photocopy materials themselves (item 5) and also considered that dosage would increase if they were more fa