0022-538X/05/$08.00⫹0 doi:10.1128/JVI.79.14.8979–8990.2005
Copyright © 2005, American Society for Microbiology. All Rights Reserved.
The Replicative Fitness of Primary Human Immunodeficiency Virus
Type 1 (HIV-1) Group M, HIV-1 Group O, and HIV-2 Isolates†
Kevin K. Arie
¨n,
1,2Awet Abraha,
2Miguel E. Quin
˜ones-Mateu,
3Luc Kestens,
4Guido Vanham,
1,4,5and Eric J. Arts
2*
Department of Microbiology, HIV Virology Research Unit, Institute of Tropical Medicine, Nationalestraat 155, B-2000 Antwerp, Belgium1; Division of Infectious Diseases, Department of Medicine, Case Western Reserve University, 2109
Adelbert Rd., Cleveland, Ohio 441062; Department of Virology, Lerner Research Institute, The Cleveland
Clinic Foundation, 9500 Euclid Ave., Cleveland, Ohio 441063; Department of Microbiology, Laboratory
of Immunology, Institute of Tropical Medicine, Nationalestraat 155, B-2000 Antwerp, Belgium4; and
Department of Biomedical Sciences, University of Antwerp, Universiteitsplein 1, B-2610 Wilrijk, Belgium5
Received 19 December 2004/Accepted 14 March 2005
The main (M) group of human immunodeficiency virus type 1 (HIV-1) is responsible for the global AIDS epidemic while HIV-1 group O (outlier) and HIV type 2 are endemic only in west and central Africa. The failure of HIV-2 and especially HIV-1 group O to spread following the initial zoonotic jumps is not well understood. This study was designed to examine the relative replicative capacities between these human lentiviruses. A pairwise competition experiment was performed with peripheral blood mononuclear cells with eight HIV-2 isolates, 6 group O viruses, and 15 group M viruses of subtype A (2 viruses), B (5 viruses), C (4 viruses), D (2 viruses) and CRF01_AE (2 viruses). HIV-1 group M isolates of any subtype were typically 100-fold-more fit than group O or HIV-2 strains when competed in peripheral blood mononuclear cells from various humans. This order in replicative fitness was also observed when virus pairs were added to human dendritic cells and then cocultured with primary, quiescent T cells, which is the model for HIV-1 transmission. These results suggest that reduced replicative and transmission fitness may be contributing to the low prevalence and limited geographical spread of HIV-2 and group O HIV-1 in the human population.
Virulence is defined as the rate of host mortality as a con-sequence of infection (30) but is commonly related to repro-duction rate and pathogenic potential of the parasite (12). When the size, density, and reproduction rates of the host population are limiting, greater fitness of a parasite may be a consequence of reduced virulence to ensure host and parasite survival (2, 18). In contrast to acute infections by lethal viruses, the relatively low virulence of the human immunodeficiency virus (HIV) establishes a long chronic disease leading to AIDS and mortality. The long life span of an infected host coupled with efficient transmission has led to the spread of HIV to over 40 million people throughout the world. Early in the epidemic, both type 1 HIV (HIV-1) and HIV-2 were prevalent but geo-graphically separated in Africa (east and central versus west, respectively) (60). Over the past 20 years, HIV-2 has nearly faded as a human pathogen, whereas HIV-1 not only has expanded throughout Africa but has founded new epidemics throughout the world (60). This study has examined possible phenotypic differences between diverse HIVs that are found primarily in sub-saharan Africa.
HIV-1 and HIV-2 were introduced into the human popula-tion through two separate but not necessarily isolated zoonotic jumps. Close genetic relationships between the genomes of the
HIV types and simian immunodeficiency viruses (SIVs) sug-gest that humans acquired this type 1 human lentivirus from chimpanzees (Pan troglodytes) and HIV-2 from sooty manga-beys (Cercocebus atys) (19). Appearance of the HIV-1 group M, N, and O lineages may be due to divergent evolution in the human population or separate cross-species transmission events of diverse SIVcpz strains (19, 23, 52). Group O may have evolved from a recombination event between SIVcpz strains found in different subspecies of chimpanzees such as
Pan troglodytes troglodytes and Pan troglodytes schweinfurthii
(43). All of these cross-species transmission events appeared to have originated in western Africa but only HIV-1 group M founded the global pandemic, with an estimated introduction date in the early 1930s (28, 29). Group M HIV-1 has subse-quently diverged in the human epidemic and can now be sub-classified into nine subtypes (A, B, C, D, F, G, H, J, and K) and 15 circulating recombinant forms (CRFs) (36, 44).
Prevalence of HIV-2 and group O, unlike that of HIV-1 group M, appears to have stabilized or actually decreased in the human population over the past decade (4, 21). Group O, which may have been responsible for 20% of the HIV-1 infec-tions in the Republic of Cameroon, has now dropped to ap-proximately 1% of HIV-1 cases or an estimated 0.4% preva-lence (Fig. 1A) (4, 59). In contrast, HIV-2 appeared to dominate over HIV-1 in western Africa during the early epi-demic and peaked in the mid-1990s at a 10% prevalence in the Senegalese population (Fig. 1A) (21). In all west African coun-tries, HIV-2 has been rapidly displaced by HIV-1 but is still frequently observed in dual infections with HIV-1 (39). The
* Corresponding author. Mailing address: Division of Infectious Diseases, BRB 1034, Case Western Reserve University, 10900 Euclid Ave., Cleveland, OH 44106. Phone: (216) 8904. Fax: (216) 368-2034. E-mail: eja3@po.cwru.edu.
† Supplemental material for this article may be found at http: //jvi.asm.org/.
8979
on November 8, 2019 by guest
http://jvi.asm.org/
increasing prevalence of HIV-1 group M over HIV-2 or HIV-1 group O in the west African population has been attributed to increased transmission of the former (21, 27).
Fitness is defined as an organism’s replicative capacity/ adaptability in a given environment (16). This definition sug-gests that HIV-1 group M is more fit than HIV-2 or HIV-1 group O in the human population. However, the nature of this multilayered environment introduces significant complexities in measuring fitness of these HIV types/groups in human pop-ulations. We have adopted a rigorous method to measure rel-ative viral fitness ex vivo, which involves competitions between two or more viral strains in tissue culture (16, 40). This system was first developed to study fitness/evolution of various RNA viruses (e.g., vesicular stomatitis virus) (16, 40, 41) and recently applied to HIV-1 (61, 62). It was soon discovered that drug-resistant mutations reduced HIV-1 replication efficiency (24, 34, 38, 47) and that ex vivo HIV-1 fitness was directly related to disease progression (48, 57). From these studies, it appears that HIV-1 fitness in different layered environments may be interrelated but not necessarily consequential (3). For exam-ple, the ability of virus to replicate in human peripheral blood mononuclear cells (PBMCs), defined as ex vivo fitness (3, 48), in tissue culture may be related to virus levels produced by these same cells in the blood of an infected human host. How-ever, other factors such as immune response and host genetics will influence viral loads, undoubtedly play a role in shaping HIV-1 evolution, and thus alter fitness during disease. None-theless, it appears that HIV-1 fitness is one of the strongest predictors of disease progression (6, 8, 9, 48).
The relationship between ex vivo HIV fitness and distribu-tion of these isolates in the human populadistribu-tion is definitely more complex than the direct correlation between HIV-1 fit-ness and rate of disease progression (3). Fitfit-ness of virus within the human population is likely related to both efficiency and opportunity for transmission. Opportunity is more a factor of human behavior and mechanics of the transmission event, whereas efficiency of transmission could be affected by virus attributes. Since the rate of host cell entry appears to be the dominant factor controlling ex vivo HIV-1 fitness (5, 32, 49), it is possible that ex vivo fitness could be related to transmission efficiency and ultimately virus distribution.
To date, there have been few studies examining the replica-tion efficiencies of HIV groups/types (7, 54), and most of these have not involved primary HIV-1 isolates infecting primary
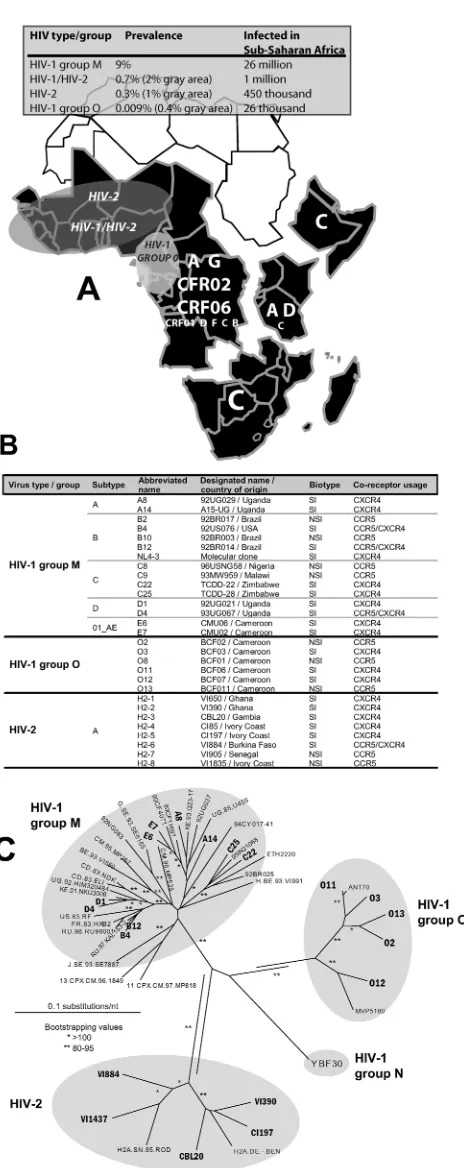
FIG. 1. (A) Prevalence of HIV in sub-saharan Africa is summa-rized in the grey panel. Sub-saharan Africa is further subdivided into various regions based on group M subtype prevalence. The size of the letters provides an indication of the prevalence of that subtype or CRF in a given region. For example, northeastern countries of Africa (i.e., Ethiopia, Eritriea, and Somalia) are dominated by subtype C. The grey shaded areas show the approximate range of HIV-2, HIV-1/HIV-2, and HIV-1 group O in Africa. (B) Virus characteristics of the isolates
used in the dual infection/competition experiments. Most isolates have the syncytium-inducing phenotype (as determined with MT-2 cell line) and are able to use either the CXCR4 chemokine receptor exclusively as entry coreceptor or are dualtropic for both CXCR4 and CCR5 (as determined with a U87.CD4 cell line expressing either CXCR4 or CCR5). One isolate, O13, was initially identified as an SI isolate but was later found to be an NSI/R5 HIV-1 group O isolate through phenotypic analyses (see Materials and Methods). (C) Analysis of genotypic relationships of diverse HIV isolates by the neighbor-joining method. Phylogenetic neighbor-joining trees were constructed from alignments of the 400-nucleotidepolgene fragments from several HIV reference strains and 22 HIV isolates employed in the subsequent fitness analyses. Accession numbers for all pol gene fragments are provided in Materials and Methods. ** and *, bootstrap resampling values of 80 to 95% and⬎95%, respectively. Branch lengths are drawn to scale, and the scale bar represents 0.1 substitution per nucleotide.
on November 8, 2019 by guest
http://jvi.asm.org/
[image:2.603.57.289.72.656.2]human CD4⫹cells, have not included group O isolates, and finally have not performed head-to-head competitions. Thus, this research field has not examined the possible relationships between fitness of different HIV types/HIV-1 groups, their distribution in the epidemic, and pathogenesis in the human host. In this study, we performed almost 1,000 dual virus com-petitions to find the winner of each competition and then compared this phenotypic trait of relative HIV replication ca-pacity to viral genetic diversity and distribution in the human population.
MATERIALS AND METHODS
Cells.PBMCs were obtained from HIV-seronegative blood donors (two Cau-casians and one Bantu African; one Caucasian for the dendritic cell [DC]/T-cell competitions) by Ficoll-Hypaque density gradient centrifugation of
heparin-treated venous blood. Cells were stimulated with 2g/ml phytohemagglutinin
(PHA; Gibco BRL) for 3 days and further maintained in RPMI containing 10% fetal bovine serum (Cellgro), 10 mM HEPES, 1 ng/ml interleukin-2 (IL-2; Gibco
BRL), 100 U/ml penicillin (Cellgro), and 100 g/ml streptomycin (Cellgro).
Monocyte- and lymphocyte-enriched fractions were generated by counterflow
elutriation of 6⫻108
PBMCs (58). Monocytes were further purified by sheep
erythrocyte rosetting, yielding⬎95% CD3⫺/CD4⫹monocytes and⬍0.5% T cells
(58). Addition of IL-4 (20 ng/ml) and granulocyte-macrophage colony-stimulat-ing factor (20 ng/ml) to RPMI containcolony-stimulat-ing 10% fetal bovine serum, 100 U/ml
penicillin, and 100g/ml streptomycin differentiated monocytes into
interstitial-type DCs (MO-DCs). Cell cultures were fed every 3 days and
immunopheno-typed (CD3⫺/CD4⫹, CD1a⫹, CD13⫹/CD14⫺, and DC-SIGN⫹; all from Becton
Dickinson) before use in infection experiments on day 7 (58). Frozen lymphocyte fractions were thawed on the day of infection and used to isolate autologous
CD4⫹T cells.
Viruses.HIV-1 group M and group O isolates were obtained from the AIDS Research and Reference Reagent Program, while the HIV-2 strains were pre-viously isolated from patients attending the AIDS clinic at the Institute of Tropical Medicine in Antwerp, Belgium. Virus stocks were propagated and expanded in short-term cultures of PBMCs treated with PHA–IL-2. Twenty-nine different primary HIV isolates (syncytium-inducing/CXCR4-tropic [SI/X4], du-altropic [R5X4], or NSI/R5) were selected for this study (Fig. 1B). The tissue culture dose for 50% infectivity was calculated by the Reed and Muench method (33, 50). Briefly, each stock of HIV isolate was serially diluted in triplicate and
then plated with 105PBMCs in a 96-well plate. Infectivity in each well was tested
by a radiolabeled reverse transcriptase (RT) assay as previously described (56). It is important to note that the classic and not the virtual method was used for the calculation of infectious titers (33).
Growth competition assays.Nearly 1,000 full pairwise dual infection/compe-tition experiments were done with 15 HIV-1 group M, 6 HIV-1 group O, and 8 HIV-2 viruses (Fig. 1B). Dual infection/competition experiments were per-formed with SI/X4 or dualtropic isolates in PBMCs from one donor (with the same donor as for tissue culture dose for 50% infectivity determination and the same blood draw) on 24-well cell culture plates and in duplicate. A subset of competitions was repeated with PBMCs from two additional donors (one Cau-casian and one Bantu African). Full pairwise competitions with eight NSI/R5 isolates (subtypes B and C, HIV-1 group O, and HIV-2; two isolates each) were also performed with PHA/IL-2 PBMCs. Finally, the same NSI/R5 subtype B isolates were used for pairwise comparison with two NSI/R5 group O and HIV-2
viruses in cocultures of MO-DC and autologous CD4⫹ T cells. Cells were
infected with two viruses at equal multiplicity of infection (MOI), 0.0005 for PBMCs and 0.001 for MO-DCs. A previous study (48) used a higher MOI for
dual infections (0.01 and 0.1), but we have recently observed that MOIs of⬎0.01
saturated susceptible cell populations within two to three rounds of replication and prevent further virus competitions (5; A. Abraha and E. J. Arts, unpublished data). Interestingly, the relative fitness values did not vary for a dual MOI in the range of 0.005 to 0.0005. Env PCR products could not be amplified from dual
virus competitions performed at an MOI of⬍0.0001. Uninfected cultures were
used as HIV-negative controls, and monoinfected cultures of each virus
corre-sponded to positive controls. Virus mixtures were incubated with 2⫻105
PBMCs
or 105MO-DCs at 37°C in 5% CO2, washed three times with 1⫻
phosphate-buffered saline for 24 h and 6 h postinfection, respectively, and then resuspended
in complete medium. Subsequently, 3⫻105autologous CD4⫹T cells were
added to the MO-DCs (1/3 ratio), and cultures were fed with complete medium (without cytokines) twice a week. Cell-free supernatant was collected and
as-sayed for RT activity 3 and 6 days postinfection, as previously described (56). Two aliquots of supernatants and cells were harvested at day 8 after infection and
stored at⫺80°C for subsequent analysis.
PCR strategy.For all dual-infected and monoinfected cultures, proviral DNA was extracted from lysed PBMCs with the QIAamp DNA Blood kit (QIAGEN). Isolated viral DNA was PCR amplified using a set of external primers, followed by nested amplification. Both the external and nested PCRs were carried out in a 100-l reaction mixture under defined cycling conditions (step 1, 94°C for 4 min; step 2, 94°C for 30 s, 55°C for 30 s, and 72°C for 45 s, repeated 35 times; step 3, final hold at 4°C). A different PCR strategy was adopted for either intragroup competitions (group M/group M, group O/group O, and HIV-2/HIV-2) or in-tergroup competitions (group M/group O, group O/HIV-2, and group M/HIV-2).
Intragroup competitions were PCR amplified in the C2V3 envregion, while
intergroup competitions were amplified in thepolRT region due to extensive
intergroup sequence diversity inenv. Primers utilized for these analyses are listed
in Table S1 in the supplemental material. Controls for the PCR and heterodu-plex tracking assays (HTAs) are shown in Fig. 2 and Fig. S1 in the supplemental material. A schematic representation of the PCR primers, products, HTA anal-yses, and fitness calculations is provided in Fig. 3.
As described below, control PCR amplifications were performed using the
differentpolprimer pairs to amplify the group M/group O, group O/HIV-2, and
group M/HIV-2 competitions and differentenvprimer pairs to amplify the group
M/group M, group O/group O, and HIV-2/HIV-2 competitions. Briefly, DNA extracted from PBMCs monoinfected with the various HIV-1 group M and group O and HIV-2 isolates was PCR amplified with the last five sets of primer pairs listed in Table S1 in the supplemental material. Each set of primers was only PCR amplified from the HIV isolates belonging to a specific group/type. This DNA template was extracted from an agarose gel, purified, quantified by
mea-surement of optical density at 260 nm, and then diluted to 108to 10 copies/l.
Each dilution of a specific HIV-1 group M and group O or HIV-2 template was then PCR amplified with sets of both external and nested primer pairs designed for the group M/group O, group M/HIV-2, and group O/HIV-2 competitions (listed as M/O RTS1 W to O/HIV-2 RTA3 in Table S1 in the supplemental material). The PCR products from these amplification controls were run on a 1% agarose gel and then quantified using the ethidium bromide gel quantitation feature of the Bio-Rad phosphorimager and Quantity One software.
HTA analysis of dual infections.Nested PCR products inenvandpolRT were analyzed by HTAs to determine the amount of virus production in the dual infection/competition experiments (Fig. 3D) (48). Radiolabeled DNA probes
were PCR amplified from regions ofenvandpolRT using the same primer sets
described above (see Table S1 in the supplemental material). For this amplifi-cation, one of the nested primers was radiolabeled with T4 polynucleotide kinase
(PNK; Gibco BRL) and 2Ci of [␥-32P]ATP. Subsequently, radiolabeled
PCR-amplified probes were separated on 1% agarose gels and purified with the QIAquick gel extraction kit (QIAGEN). The HTA reaction mixtures containing DNA annealing buffer (100 mM NaCl, 10 mM Tris-HCl [pH 7.8], 2 mM EDTA),
10l of amplified DNA from the competition culture, and 0.1 pmol of
radioac-tive probe DNA were denatured at 95°C for 3 min, followed by incubation at 37°C for 5 min and rapid transfer on wet ice to allow reannealing. The DNA heteroduplexes were resolved on 6% nondenaturing polyacrylamide gels (29:1 30% acrylamide-bis) for 4 h at 200 V. Afterwards, gels were dried for 45 min at 80°C, exposed to X-ray film to make autoradiograms (Kodak MR film), subse-quently exposed on a phosphorimaging screen, and scanned with a phosphorim-ager (Personal Molecular Imphosphorim-ager FX; Bio-Rad), followed by analysis using the Quantity One software package from Bio-Rad.
For this study, it was necessary to see if the probes of the various groups and types could efficiently anneal to PCR products of different types and groups for accurate HTA quantitations of dual infections. The external products from the control PCR amplifications (see above) were mixed for mock dual-infection analyses by HTA. The external PCR products were mixed at 10 pg:1 pg, 10:10, and 1:10 ratios for the following pairs: group M plus group O, group M plus HIV-2, and group O plus HIV-2. These mixtures were then PCR amplified using the appropriate set of nested primers (see Table S1 in the supplemental mate-rial). Ten microliters of this amplified mixture and 1 pmol of radiolabeled probe (of the various groups and types) were then added to an HTA reaction mixture. One or two probes representing an isolate of each group/type were used in these mock competitions. The heteroduplexes from this mock competition and from mock monoinfections (10 pg of DNA added to the nested PCR and then an-nealed to the probe) were resolved on a 6% polyacrylamide gel (PAG) and quantified on a Bio-Rad phosphorimager screen.
Estimation of viral fitness.In the dual infection/competition experiments, the final ratio of two viruses produced in a dual infection was estimated by hetero-duplex tracking analysis and compared to the production in monoinfections (48).
on November 8, 2019 by guest
http://jvi.asm.org/
Production of individual HIV isolates in a dual infection (fo) was divided by the
initial proportion in the inoculum (io). This is referred to as relative fitness (W⫽
fo/io), while the ratio of the relative fitness values of each HIV variant in the
competition is a measure of the fitness difference (WD) or ratio between two HIV
strains (WD⫽WM/WL), withWMandWLcorresponding to the relative fitness of
the more- and less-fit virus, respectively (Fig. 3C).
Sequence analyses.A segment of the HIV-1envgene (C2-V3; 336
nucleo-tides) and of thepolgene (polymerase region of RT; 600 nucleotides) was PCR
amplified using an external set and then a nested set of primers (see Table S1 in the supplemental material; the first six sets of primer pairs). This PCR product was then purified and sequenced in the sense and antisense directions with a nested set of primers. All sequencing reactions were performed using the ABI Prism Big Dye Terminator Cycle Sequencing Ready Reaction kit (Perkin-Elmer) and an ABI 377 sequencer at the University of California—Davis Sequencing Facility. The chromatogram files were read using the Chromas 1.6 program
(Helensvale, Australia). The C2-V3envand RT sequences were aligned with the
CLUSTAL X program, version 1.64b (55). Neighbor-joining phylogenetic trees
including referenceenvsequences were constructed using CLUSTAL X and then
drawn with Treeview 1.6.1 (Fig. 1C) (42). Bootstrap resampling (1,000 data sets) of multiple alignments was performed to test the statistical robustness of the trees. Kimura two-parameter distances were calculated with the DNADIST program in the PHYLIP package (51).
Nucleotide sequence accession numbers.The following accession numbers refer to the sequences of the HIV isolates employed in this study. The DNA
sequence of HIV-1envC2-V3 and RT regions determined as part of this study
has been submitted to GenBank, but accession numbers are not yet available
(indicated by the abbreviation SNA, for submitted but not available). Thepol
sequences available from GenBank are as follows: isolate name 92UG029 (A8), accession number DQ067920; A15UG (A14), DQ067921; 92US076 (B4), DQ067914; 92BR014 (B12), AF458232; NL4-3, M19921 (full genome); TCDD22 (C22), DQ067916; TCDD28 (C25), DQ067917; 92UG021 (D1), AF009396; 93UG067 (D4), DQ067915; CMU06 (E6), DQ067918; CMU02 (E7), DQ067919; BCF02 (O2), Y14497; BCF03 (O3), Y14498; BCF06 (O11), Y14499; BCF07 (O12), Y14500; BCF011, DQ067913; V1390 (H2-2), DQ067922; CBL20 (H2-3), DQ067924; C185 (H2-4), DQ067926; C1197 (H2-5), DQ067923; V1884 (H2-6), DQ067927; V11437 (H2-9), DQ067925.
RESULTS
Testing the PCR and HTA system.In this study, we
com-pared the relative replicative fitness of viral isolates classified as HIV-1 group M and group O and HIV-2. Accurate mea-surement of dual virus production is dependent on conserva-tion of primer binding sites on both HIV DNAs in a dual infection. This will ensure unbiased PCR amplifications. PCR products from dual infections were added together with a ra-diolabeled probe (i.e., PCR product amplified from another HIV isolate), denatured, annealed, and run on a nondenatur-ing polyacrylamide gel. Increased annealnondenatur-ing on the HIV-1 DNA probe to one HIV DNA compared to the other from a dual infection can be corrected based on annealing efficiency to HIV DNA from a monoinfection (48). Nonetheless, it is im-portant to verify efficient annealing and detection by HTA. In the first control experiment, we tested PCR amplification ef-ficiency using primer sets specific for thepolgene to measure dual virus production in the intergroup M/intergroup O, group M/HIV-2, and group O/HIV-2 competitions. Primers for the
polgene were selected due to the higher sequence homology between HIV types and groups than was observed with theenv
gene, which was amplified for HTA and dual-virus detection in the intragroup/intratype competitions. DNA extracted from PBMCs monoinfected with the various HIV-1 group M and group O and HIV-2 isolates was PCR amplified with group- or type-specific primer pairs (the last five sets in Table S1 in the supplemental material). TheseenvorpolDNA products were then purified, quantified, and diluted to 108to 10 copies/l for
use in a nested PCR amplification with primer pairs specific for the intra- (pol gene) and inter- (env gene) type/group DNA (see Table S1 in the supplemental material). As shown in the supplementary figures, all nested primer pairs amplified the HIVenvorpolDNA of different groups and types with nearly equal efficiency. Slight variations in amplification efficiency were not statistically significant.
Upon PCR amplification of both HIV DNAs in a dual in-fection, it was important to ensure that the PCR-amplified probe (eitherenvorpolDNA of HIV isolates different from that used in the competitions) was annealing to both PCR products. We previously confirmed that the HTA results were identical if carried out with PCR-amplified DNA of DNA extracted from infected PBMC cultures or RT-PCR-amplified DNA of RNA extracted from virus released from these cul-tures (48). It was also shown that the radiolabeled PCR probes generated from the HIV-1 group Menvgene did not signifi-cantly differ in annealing of the two group M HIV-1 DNA products from a dual infection. Any variation in annealing was compensated for by dividing the intensity of DNA heterodu-plex of specific virus from competition by the intensity of that heteroduplex from a monoinfection (Fig. 2). It was, however, necessary to confirm that the latter observations with intra-group M analyses (5, 48) held true for HTA analyses of com-petitions using highly divergent HIV isolates of group M and group O and type 2. The external PCR products from quanti-tation study described in the figure in the supplemental mate-rial were mixed for mock PCR amplication-HTA analyses. HTAs were then performed with two probes representing an isolate of each group/type used in these mock competitions. The heteroduplexes from this mock competition and from mock monoinfections (10 pg of PCR DNA product annealed to the probe) were resolved on a polyacrylamide gel and quan-tified by phosphorimaging (Fig. 2A). The raw intensity of each heteroduplex band in a mock competition between group O3 and group M C25 viral DNA was plotted in Fig. 2B.
Differential annealing efficiencies to the PCR products of all HIV DNAs (of group M and group O and HIV-2 isolates) was evident and dependent on relative sequence homology be-tween probe and target DNA products. Since equal amounts of
envPCR product were used for all HTA analyses (mono and dual), intensities of these heteroduplex bands were adjusted based on the intensity of the heteroduplex in the mock monoinfections (Fig. 2A). Based on this adjustment, the rela-tive intensities of the O3 and C25 heteroduplexes were equal to the original proportion of viral DNA added to the mock dual infections (Fig. 2B), which was subject to the same PCR amplifications and HTA analyses. Similar mock analyses were performed on pairwise mock competitions involving the D1, C25, O2, O3, O11, H2-2, and H2-3 templates. In each mock competition, the ratio of DNA detected by HTA was similar to input ratios. Slight variations (⬍15%) in the input to output ratios for all mock intra- and inter- group/type competitions are likely due to the standard errors in spectrophotometry readings of the input template DNA. These variations would not arise in HTA analyses of the actual dual infections.
Dual virus competitions to compare fitness of HIV groups
and types. Nearly 1,000 dual virus competitions in human
PBMCs and in dendritic cell/T-cell cocultures were performed, using 15 HIV-1 group M isolates (2 from each of subtypes A,
on November 8, 2019 by guest
http://jvi.asm.org/
D, and CRF01_AE; 5 of subtype B strains; and 4 of subtype C) (Fig. 1B), 6 HIV-1 group O isolates, and 8 HIV-2 isolates. Twenty HIV strains were obtained from patients in late disease (i.e., CD4⫹cell counts typically⬍300/ml) are syncytium induc-ing (SI)/X4 tropic or dualtropic as indicated by their ability to infect CD4⫹U87 cells expressing either CXCR4 or CCR5. Fig. S2 in the supplemental material shows the coreceptor usage of HIV-1 group M and group O isolates. All coreceptor usage assays were performed with the same viral stocks used for competitions but prior to the determination of infectious titers. Thus, replication kinetics from these monoinfections were per-formed with an arbitrary amount of virus (100l) and cannot be compared to relative fitness values. Assays for coreceptor usage by HIV-2 isolates were performed on different dates and by monitoring virus production by capsid p24 release and not by RT activity (data not shown). Nine HIV isolates were iso-lated from patients with asymptomatic disease and were strictly nonsyncytium-inducing (NSI) and CCR5 tropic (R5) (Fig. 1B). Every possible combination of NSI/R5 or SI/X4 virus pairs were added to PHA-treated, IL-2-stimulated PBMCs at equal multiplicities of infection (0.0005 infectious particles per cell) (Fig. 3A). Virus production in the cell cultures was initially measured by a radioactive reverse transcriptase assay (48). Both supernatant and cells were harvested at peak viremia in the culture.
[image:5.603.64.272.79.572.2]Viral DNA was then PCR amplified from cell extracts and employed in heteroduplex tracking assays to measure dual virus production. This technique was modified from the previ-ous descriptions (48), due to sequence variation between HIV groups and types. For all intragroup or intratype competitions, the diverse C2-V3 region of theenvgene was PCR amplified (Fig. 3B), then annealed to a radiolabeledenv C2-V3 DNA probe, and resolved on a nondenaturing polyacrylamide gel (Fig. 3D). In contrast, the higher sequence diversity between groups and types required the amplification of the more con-served region of RT using specific primer sets for M/HIV-2, M/O, and HIV-2/O competitions (Fig. 3B; see Table S1 in the supplemental material). Equal PCR amplification of all HIV strains by the designated primer sets and relative annealing to the probes in the HTA was compared and/or analyzed as described above (Fig. 2). All relative fitness values were de-rived from a set of dual infections (e.g., M versus O isolates) by performing HTAs with at least two probes (e.g., group M and O RT probes) (data not shown). As indicated in Fig. 3D, many of the primary HIV-1 isolates were viral swarms and as a result were identified as multiple heteroduplexes in the HTA (e.g., virus H2-1 and H2-4). Relative fitness and fitness difference values were calculated as shown in Fig. 3C. Finally, the esti-mated frequency of recombination between HIV-1 isolates in
FIG. 2. Testing for preferential probe annealing in the heterodu-plex tracking. The heteroduheterodu-plex tracking assay is used to detect the PCR products originating from the two HIV isolates added to dual infections. The external PCR products from quantitation study de-scribed in Fig. S1 in the supplemental material were mixed for mock PCR amplication-HTA analyses. Several pairs of group M plus group O, group M plus HIV-2, and group O plus HIV-2 PCR products were mixed at 10:1, 10:10, and 1:10 ratios and then PCR amplified using the appropriate set of nested primers. Ten microliters of this amplified mixture was then added with 1 pmol of radiolabeled probe to an HTA reaction mixture (see Materials and Methods). The heteroduplexes from this mock competition and from mock monoinfections (10 pg of DNA added to the nested PCR and then annealed to the probe) were resolved on a 6% PAG and quantified on a Bio-Rad phosphorimager screen. (A) Image of a 6% PAG containing an HTA of the mock competition between O3 and C25 HIV-1 DNA, which was then probed with a group M HXB2 probe. (B) The raw intensity of each
heteroduplex band in this mock HTA was plotted. (C) The intensity of each heteroduplex band was then plotted relative to the heteroduplex of only the PCR amplified DNA from mock monoinfections. It is important to note that each lane of the HTA shown in panel A contains the same amount of PCR-amplified DNA. The HTA shown in panel A and the analyses shown in panels B and C were repeated with the same samples using the group O isolate ESP1 probe. Similar mock analyses were performed on pairwise mock competitions involving HTAs, following nested amplification of the D1, C25, O2, O3, O11, H2-2, and H2-3 templates (data not shown).
on November 8, 2019 by guest
http://jvi.asm.org/
dual infections and/or competitions was⬍0.1% per 1,000 bp or well below the limit of HTA detection (48). Fig. 4 displays all of the fitness difference values derived from competitions be-tween the designated HIV isolate and each of the other HIV-1 group M and O and HIV-2 strains, whereas the mean relative fitness values for intra- or inter- group/type competitions are shown in Fig. 5A to C. Duplicate competitions were performed with the same PBMCs at the same time. Only a subset of these repeat competitions was analyzed (n ⫽ 50). As previously reported (5, 48), relative fitness values varied⬍10% in dupli-cate dual infections performed with the same PBMC sample (data not shown).
HIV-1 group M isolates are more fit than group O or HIV-2.
Competitions in PBMC clearly revealed that HIV-1 group M was more fit than HIV-2 or group O isolates. All competitions involved HIV-1 pairs of the same phenotype (i.e., NSI/R5 or SI/X4) (Fig. 4A and C), since the SI/X4 or dualtropic viruses typically outcompeted the NSI/R5 HIV isolates (data not shown). Eleven SI/X4 HIV-1 isolates (representing five of the most prevalent HIV-1 group M subtypes: A, B, C, D, and CRF01 _AE), 5 group O isolates, and 6 HIV-2 isolates had similar mean relative fitness values in intragroup/intratype pairwise competitions (see bars labeled group M, group O, and HIV-2 in Fig. 5A, B, and C, respectively). The mean relative
fitness value (W) from all group M virus competitions was equal to 1.01 (⫾ 0.717 or range of fitness values from 83 competitions) (P⬎0.79) (Fig. 5A). These mean relative fitness values did not include the NSI/R5 viruses of these groups, but their intragroup/intratype fitness also resulted in equal fitness. This does not imply that some isolates within a group or type are not more or less fit, but differences in intragroup fitness were less dramatic than that observed between types and groups. For example, subtype D viruses D1 and D4 were the most fit of the other group M SI/X4 isolates and had the highest mean relative fitness values (derived from competitions against the other group M isolates) (Fig. 5A). Even within a subtype, fitness could vary. The subtype A SI/X4 isolate A8 had a mean relative fitness among group M competitions of 1.41 (⫾ 0.329; 10 competition), which was significantly greater than that of 0.915 (⫾ 0.810; 10 competition) for A14 (P ⬍0.02) (Fig. 5A). In the intratype-2 competitions, only H2-3 proved to be more fit than other HIV-2 strains (P ⫽ 0.01). Group M subtype C isolates of both SI/X4 (C22 and C25) or NSI/R5 (C8 and C9) phenotypes were less fit than any group M isolate of the same phenotype (Fig. 5A). As previously reported, the NSI/R5 subtype C isolates, C8 and C9, were outcompeted by the subtype B isolates, B2 and B10, in PBMCs (Fig. 4C).
[image:6.603.59.546.83.365.2]Although intragroup or intratype-2 competitions revealed
FIG. 3. Schematic representation and sample results of HIV competition experiments, heteroduplex tracking assays, and fitness analyses. (A) Virus was added alone or in pairs to PHA-stimulated and IL-2-treated PBMCs at an equal MOI of 0.0005. Cells were washed after 24 h to remove residual virus. Cells and virus supernatant were harvested at day 10 and lysed for subsequent DNA extraction. (B) Extracted DNA from dual infections was PCR amplified usingenvprimer pairs specific for HIV-1 M, HIV-1 O, and HIV-2 (see Table S1 in the supplemental material). RT primers were also designed to amplify DNA from HIV-1 M/O, HIV-1 O/HIV-2, and HIV-1 M/HIV-2 dual infections (see Table S1 in the supplemental material). (C) Relative fitness values (W) and a fitness ratio referred to as fitness difference (WD) were derived as shown. (D) Samples
of HTAs and fitness calculations for HIV-1 group M versus HIV-2 competitions, as well as intragroup M and intratype HIV-2 competitions. Radiolabeled, PCR-amplified DNA from viruses A8, D1, and H2-2 were used as probes.
on November 8, 2019 by guest
http://jvi.asm.org/
FIG. 4. Fitness dif ference values from all of the dual virus competitions involving 28 HIV isolates of type 1 group M and group O and type 2. (A) Matrix sho wing relative fitness dif ferences ( W D ) of pairwise dual infection competitions in PHA/IL-2-stimulated PBMCs from a healthy HIV-negative blood donor. Relative fitness values can be deriv ed from the equation x ⫽ 2 y /( y ⫹ 1), where y ⫽ fitness dif ference ( W D ), x ⫽ fitness ( W x) of the numerator, and 2 ⫺ x ⫽ fitness ( W 2 ⫺ x) of the denominator in the equation W D ⫽ W x/ W 2 ⫺ x. (B) Matrices, showing relative fitness dif ferences ( W D ) of two subset pairwise competitions performed with PHA/IL-2-stimulated PBMCs from two additional HIV negative blood donors (one Caucasian and one Bantu African). Finally, eight NSI/R5 primary isolates (two of group M subtype B, two of group M subtype C, two of group O, a nd two of HIV-2) were also used for a pairwise competition with PHA/IL-2-treated PBMCs (C). It should be noted that due to limited quantities of virus stocks, some comp etitions in the complete pairwise matrix could not be performed.
on November 8, 2019 by guest
http://jvi.asm.org/
similar mean relative fitness values (Fig. 3D), a definite rank order between these types and groups emerged from the full pairwise competitions involving SI/X4 and NSI/R5 viruses in PBMCs (Fig. 4 and 5). Almost without exception, group M HIV-1 isolates outcompeted HIV-1 group O strains by⬎ 100-fold in direct competitions (Fig. 4). The outgrowth of SI/X4 HIV-2 isolates in PBMC cultures coinfected with the group O strains was less dramatic but convincing nonetheless, consid-ering that not a single HIV-2 isolate lost a competition against a group O strain (Fig. 4A and C). The two group O NSI/R5 isolates were also less fit but could compete to a minimal extent with group M and HIV-2 NSI/R5 isolates, as indicated by mean
relative fitness values (Fig. 5A and C). However, aside from the NSI/R5 O2 outcompeting the HIV-2 VI1905 (Fig. 4C), the NSI/R5 group O isolates lost all of the competition against HIV-2 and group M isolates. Even the group M subtype C isolates (SI/X4 C22 and C25 or NSI/R5 C8 and C9), consider-ably less fit than any other group M isolate of the same phe-notype, could outcompete most HIV-1 group O and many HIV-2 strains in competitions (Fig. 4A and C and 5D). Head-to-head competitions in PBMC between HIV-1 group M and HIV-2 isolates in PBMC cultures indicated that the HIV-1 group M strains were the victors in 27 of 38 competitions. In comparison to the larger set of SI/X4 competition results, there
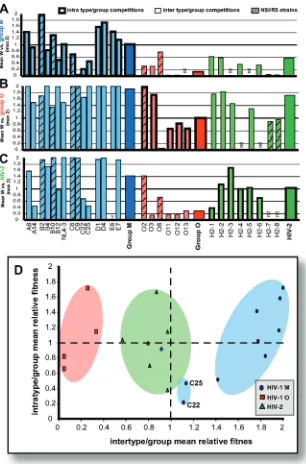
FIG. 5. (A to C) The mean relative fitness values (maximum, 2) for intratype/intragroup and intertype/intergroup competitions in PBMC involving both SI and NSI HIV-1 group M and group O and HIV-2 primary isolates. (D) Intertype/intergroup versus intratype/intragroup mean relative fitness of all SI isolates. Fitness differences were derived from competitions involving HIV-1 M and O and HIV-2 are shown in Fig.4.
on November 8, 2019 by guest
http://jvi.asm.org/
[image:8.603.147.453.80.544.2]was a slight increase in NSI/R5 group O mean relative fitness when competed against NSI/R5 group M or HIV-2 strains.
The relationship between intra- and inter- type/group fitness derived from⬎400 competitions is presented in Fig. 5D. In this chart, mean relative fitness of each HIV isolate derived from competitions against all others in the same group or type (in-tratype/intragroup fitness) is plotted on theyaxis, whereas the
xaxis represents the mean relative fitness of each isolate com-peted against all isolates from the different type and groups (intertype/intergroup fitness). From these analyses, it is clear that the order of relative fitness is HIV-1 group M ⬎group M-subtype C⬎HIV-2⬎HIV-1 group O (Fig. 5D).
Host PBMC effect on HIV-1 fitness.Fitness dominance of
HIV-1 group M over HIV-1 group O and, to a lesser extent, HIV-2 was confirmed with PBMCs of different human do-nors and genetic backgrounds (Fig. 4B and 6). A subset of the pairwise HIV competitions was repeated in PBMCs de-rived from other HIV-negative donors of different human races (two Caucasians and one Bantu African) (Fig. 6, bars 1 to 3). As observed in previous studies (5, 48), the relative fitness values did not significantly differ in dual virus com-petitions performed with PBMC cultures of different human donors. It is important to note that these fitness values represent the production of each HIV-1 isolate relative to the other in a competition and do not represent total virus production, which can differ by⬎100 fold (data not shown). Figure 4C provides all of the fitness difference values for these subset competitions in different donor PBMCs. It is important to note that for two competitions (A14 versus O11 and A14 versus C25), the WD values were lower in donor 2 PBMCs than in PBMCs from donors 1 and 3 (for A14/O11, donor 2 values were 2.17, compared to donors 1 and 3 values of 100; donor 2, 2.29; donor 1, 100; donor 3, 6.92). At this time, we have no explanations for these dis-crepancies. However, there was no reversal in the winner of these competitions. Consistencies in the relative fitness of primary HIV-1 isolates regardless of donor PBMCs have also been described in several other studies (5, 48, 57).
Measuring replicative fitness of different HIV types and
groups in a transmission model. HIV fitness in PBMCs is
correlative to disease progression within a host (termed patho-genic fitness) (6, 8, 9, 48), but the relationship to spread in the human population is tenuous. Certainly, the lower HIV-2 fit-ness reflects reduced HIV-2 virulence or pathogenicity in vivo (i.e., the longer time to develop AIDS) (21, 27, 31, 35). Little
is still known about pathogenesis or rate of disease progression among individuals infected with group O virus (26, 46, 59). However, increased prevalence of HIV-1 group M over HIV-2 and group O in western Africa (Fig. 1) may be related more to transmission efficiency than pathogenesis in the host. Models of sexual transmission suggest that DCs may be the initial targets of primary infection (10, 11, 15, 45, 53, 58). HIV-1 can then be transferred to CD4⫹T cells or monocytes in the blood from the infected DCs or from DCs that trapped the virus through adhesion by DC-SIGN (Fig. 7A) (20, 58). To examine if pathogenic fitness of group M and O and HIV-2 isolates was related to transmission fitness, we competed six pairs of NSI/R5 viruses in dendritic cell–T-cell cultures. Blood from a fourth Caucasian donor was used to purify/differentiate inter-stitial-type dendritic cells (MO-DCs) from primary human monocytes using IL-4 and granulocyte-macrophage colony-stimulating factor and then immunophenotyped (CD3⫺/ CD4⫹, CD1a⫹, CD13⫹/CD14⫺, and DC-SIGN⫹) prior to in-fection experiments. Following a 6-h incubation with the HIV-1 pairs, MO-DCs were washed and then cultured with autologous, unstimulated CD4⫹T cells. HTA was then per-formed at day 8 to determine the relative levels of dual virus production. In all cases, increased fitness of HIV-1 group M over HIV-2 and group O isolates was even more pronounced in the MO-DC–T-cell cultures than in the PHA- and IL-2-treated PBMC cultures (Fig. 7B). These results suggest that the transfer of HIV-1 group O or HIV-2 by DC to T cells is 10-to 100-fold-less efficient than that observed with group M strains. Increased replication of HIV-1 group M isolates over group O or HIV-2 strains suggests that this MO-DC⫹T-cell model can support various levels of infections by diverse strains. We and others have previously shown that DC (or Langerhans cell [LC]) infections and/or virus transfer to T cells did not significantly differ among HIV-1 isolates of different group M subtypes (5, 15, 45). Thus, it is plausible to suggest that HIV-2 and group O viruses have lower transmission fit-ness in vitro than group M when considering that this transfer/ infection could play a major role in primary infection.
DISCUSSION
[image:9.603.146.457.76.186.2]HIV-1 group O and HIV-2 have never established epidemics in the human population to the extent that HIV-1 group M has. Findings of this study and others support the hypothesis that the differential spread of HIV-1 group M and group O and HIV-2 in the human population (i.e., in vivo fitness) may be
FIG. 6. Comparing the relative fitness of various primary HIV isolates in a subset of competitions performed with PBMCs of three different HIV-negative blood donors (two Caucasians and one Bantu African). Mean relative fitness values (maximum, 2) are shown for two intragroup/ intratype and three intergroup/intertype competitions in the three different blood donors. A full set of relative fitness values is shown in Fig. 4B.
on November 8, 2019 by guest
http://jvi.asm.org/
related to the differential replicative capacities in PBMCs and in MO-DC plus T-cell cultures (M⬎HIV-2⬎⬎O), as well as differences in transmission (13, 22) and pathogenicity (M ⬎ HIV-2⫽O?) (21, 25, 27, 31, 35, 59). Data presented herein suggest that group O isolates are at least 100-fold-less fit than all HIV-2 isolates and group M isolates, including subtype C strains, and that most HIV-2 isolates are significantly less fit (⬍100 fold) than group M HIV-1 isolates. Thus, it is conceiv-able that this extremely low replicative capacity in comparison with that of HIV-1 group M strains has led to decreased group O and HIV-2 transmission. Similarly, the lower HIV-2 fitness reflects reduced HIV-2 virulence or pathogenicity in vivo (i.e., the longer time to develop AIDS) (21, 27, 31, 35). Little is still known about pathogenesis or rate of disease progression among individuals infected with group O virus (26, 46, 59).
At the time of introduction into the human species (1920s to 1930s) (28, 29), group M and group O viruses may have com-peted for the same susceptible population in central Africa,
specifically Cameroon (Fig. 1A). Several HIV surveillance studies and molecular clock analyses suggest that reduced group O and HIV-2 prevalence is not due simply to more recent zoonotic introductions (28, 29, 43). Aside from founder effects and socioepidemiological factors, significant differences in fitness between group M and O viruses could have shaped the epidemic, giving advantage to the fitter group M viruses. Moreover, differences in pathogenicity and rate of transmis-sion between HIV-1 group M and HIV-2 (21, 22, 26, 27, 31, 35, 46, 59) may be a direct consequence of or compounded by the poor replicative capacity of HIV-2 in both PBMCs and MO-DC⫹T-cell cultures. In west African countries where repeated cross-sectional data are available, the prevalence and incidence of HIV-2 have been declining, while HIV-1 group M preva-lence in the same populations has increased (21). The mathe-matical model of Anderson and May suggests that in a popu-lation where both viruses are being transmitted sexually, HIV-1 group M will competitively displace HIV-2 in the long
FIG. 7. (A) Schematic representation of the HIV dual infection of the MO-DC–CD4⫹T-cell cultures. MO-DCs were first exposed to a pair of HIV isolates for 6 h, after which free virus was washed away and CD4⫹T cells were added. The prevailing theory suggests that MO-DC can mediate T-cell stimulation and transfer of virus. CD4⫹T cells are either infected throughtransexposure from virus produced from infected MO-DCs or presented incisvia DC-SIGN-mediated endocytosis and release. (B) Fitness difference values derived from pairwise competitions with NSI/R5 HIV-1 M and O and HIV-2 primary isolates in PBMCs and MO-DCs plus CD4⫹T-cell cocultures.
on November 8, 2019 by guest
http://jvi.asm.org/
[image:10.603.150.460.81.467.2]run (1). Our data support their model in that HIV-2 is less fit than HIV-1 group M subtypes.
Within the HIV-1 group M epidemic, subtype C has in-creased in prevalence over the past 10 years to become the predominant clade in Africa and Asia (17). Both NSI/R5 and SI/X4 subtype C HIV-1 isolates were significantly less fit in PBMC competitions than all other group M isolates of the same phenotype (5). However, subtype C strains were still at least 100-fold-more fit than HIV-1 group O isolates and could compete with HIV-2 isolates. We suspect that the key to sub-type C survival and rapid expansion in the epidemic as opposed to low and isolated prevalence of HIV-2 and HIV-1 group O to western Africa may be related to efficiency of transmission (5, 13, 14, 22, 37). As described, HIV-1 fitness within a human population could be related to both transmission fitness, re-lated in part to replication capacity of a virus in dendritic Langerhans cells (5, 58), and pathogenic fitness, related to replication efficiency in primary CD4⫹ T lymphocytes or PBMCs (5, 48). In the case of HIV-1 group O and HIV-2, the extreme reduction in replication efficiency was observed in both pathogenic and transmission fitness. However, group M subtype C HIV-1 isolates had modest reductions in pathogenic fitness compared to all other group M isolates and still out-competed nearly all group O and HIV-2 strains in PBMCs. In skin-derived LCs (5), subtype B and C HIV-1 isolates had similar fitness values. Although primary LCs are not com-pletely analogous to the MO-DC cultures for the measurement of in vitro transmission fitness, these results imply that the reduced subtype C fitness was not sufficient to overcome virus trapping by this dendritic cell lineage. Thus, the poor relative replication efficiency of subtype C in PBMCs may be related to slower disease progression, longer survival of the human host, and thus more time for transmission (5, 48). Higher fitness of subtype C in skin-derived LCs compared to PBMC cultures may also suggest efficient transmission (5). Other studies with chimpanzees as a model for human infection suggest that sub-type C isolates may actually have a transmission advantage over other group M strains (5, 14, 37). In contrast, several studies suggest that sexual transmission efficiency of HIV-2 may be significantly less than that of HIV-1 (13, 22). The expansion of HIV-1 group M and contraction of the HIV-2 and group O epidemics in Africa are currently being modelled, based on this in vitro pathogenic/transmission fitness data and in vivo epidemiological studies (D. Hollingsworth, E. J. Arts, and R. M. Anderson, unpublished data).
In conclusion, we have established the relative order of fit-ness among different HIV groups and types: HIV-1 group M⬎ HIV-2⬎HIV-1 group O. This order in replicative and trans-mission fitness is nearly a perfect match to the order of prev-alence in the human epidemic. Current modelling studies of these findings may help to explain the limited spread of HIV-1 group O and HIV-2, as well as the continued dominance of HIV-1 group M throughout the world but especially in west Africa.
ACKNOWLEDGMENTS
This study was performed at the Centre for AIDS Research (CFAR) at the Case Western Reserve University, Cleveland, OH. We thank Leo Heyndrickx and Betty Willems at the Institute of Tropical Med-icine, Antwerp, Belgium, for their assistance.
K.K.A. is supported by a research grant from the Fund for Scientific Research—Flanders (G.0431.02) and a CFAR research fellowship at Case Western Reserve University, Cleveland, OH. E.J.A. is supported by research grants from NIAID, NIH (AI49170 and AI43645-02), and NICHD, NIH (HD-0-3310-502-02). M.E.Q.-M. is supported by a re-search grant from the National Heart, Lung, and Blood Institute, NIH (5-KO1-HL67610-03).
This article is dedicated to the memory of James-Paul Marois (1965– 2003) and Fredrick Robbins (1916–2003).
REFERENCES
1. Anderson, R. M., and R. M. May.1996. The population biology of the interaction between HIV-1 and HIV-2: coexistence or competitive
exclu-sion? AIDS10:1663–1673.
2. Anderson, R. M., and R. M. May.1991. Infectious diseases of humans. Oxford University Press, Oxford, United Kingdom.
3. Arts, E. J., and M. E. Quinones-Mateu.2003. Sorting out the complexities of
HIV-1 fitness. AIDS17:780–781.
4. Ayouba, A., P. Mauclere, P. M. Martin, P. Cunin, J. Mfoupouendoun, B. Njinku, S. Souquieres, and F. Simon.2001. HIV-1 group O infection in
Cameroon, 1986 to 1998. Emerg. Infect. Dis.7:466–467.
5. Ball, S. C., A. Abraha, K. R. Collins, A. J. Marozsan, H. Baird, M. E. Quin˜ones-Mateu, A. Penn-Nicholson, M. Murray, N. Richard, M. Lobritz, P. A. Zimmerman, T. Kawamura, A. Blauvelt, and E. J. Arts.2003. Com-paring the ex vivo fitness of CCR5-tropic human immunodeficiency virus
type 1 isolates of subtypes B and C. J. Virol.77:1021–1038.
6. Barbour, J. D., F. M. Hecht, T. Wrin, M. R. Segal, C. A. Ramstead, T. J. Liegler, M. P. Busch, C. J. Petropoulos, N. S. Hellmann, J. O. Kahn, and R. M. Grant.2004. Higher CD4⫹T cell counts associated with low viral pol replication capacity among treatment-naive adults in early HIV-1 infection.
J. Infect. Dis.190:251–256.
7. Barnett, S. W., M. Quiroga, A. Werner, D. Dina, and J. A. Levy.1993. Distinguishing features of an infectious molecular clone of the highly diver-gent and noncytopathic human immunodeficiency virus type 2 UC1 strain.
J. Virol.67:1006–1014.
8. Blaak, H., M. Brouwer, L. J. Ran, F. de Wolf, and H. Schuitemaker.1998. In vitro replication kinetics of human immunodeficiency virus type 1 (HIV-1) variants in relation to virus load in long-term survivors of HIV-1 infection.
J. Infect. Dis.177:600–610.
9. Blaak, H., A. B. van’t Wout, M. Brouwer, B. Hooibrink, E. Hovenkamp, and H. Schuitemaker.2000. In vivo HIV-1 infection of CD45RA⫹CD4⫹T cells is established primarily by syncytium-inducing variants and correlates with
the rate of CD4⫹T cell decline. Proc. Natl. Acad. Sci. USA97:1269–1274.
10. Blauvelt, A., H. Asada, M. W. Saville, V. Klaus-Kovtun, D. J. Altman, R. Yarchoan, and S. I. Katz.1997. Productive infection of dendritic cells by HIV-1 and their ability to capture virus are mediated through separate
pathways. J. Clin. Investig.100:2043–2053.
11. Blauvelt, A., S. Glushakova, and L. B. Margolis.2000. HIV-infected human Langerhans cells transmit infection to human lymphoid tissue ex vivo. AIDS
14:647–651.
12. Bremermann, H. J., and J. Pickering.1983. A game-theoretical model of
parasite virulence. J. Theor. Biol.100:411–426.
13. Cavaco-Silva, P., N. C. Taveira, L. Rosado, M. H. Lourenco, J. Moniz-Pereira, N. W. Douglas, R. S. Daniels, and M. O. Santos-Ferreira.1998. Virological and molecular demonstration of human immunodeficiency virus
type 2 vertical transmission. J. Virol.72:3418–3422.
14. Chen, Z., Y. Huang, X. Zhao, E. Skulsky, D. Lin, J. Ip, A. Gettie, and D. D.
Ho.2000. Enhanced infectivity of an R5-tropic simian/human
immunodefi-ciency virus carrying human immunodefiimmunodefi-ciency virus type 1 subtype C enve-lope after serial passages in pig-tailed macaques (Macaca nemestrina). J.
Vi-rol.74:6501–6510.
15. Dittmar, M. T., G. Simmons, S. Hibbitts, M. O’Hare, S. Louisiri-rotchanakul, S. Beddows, J. Weber, P. R. Clapham, and R. A. Weiss.1997. Langerhans cell tropism of human immunodeficiency virus type 1 subtype A
through F isolates derived from different transmission groups. J. Virol.71:
8008–8013.
16. Domingo, E., and J. J. Holland.1997. RNA virus mutations and fitness for
survival. Annu. Rev. Microbiol.51:151–178.
17. Essex, M.1999. Human immunodeficiency viruses in the developing world.
Adv. Virus Res.53:71–88.
18. Ewald, P. W.1994. Evolution of infectious disease. Oxford University Press, Oxford, United Kingdom.
19. Gao, F., E. Bailes, D. L. Robertson, Y. Chen, C. M. Rodenburg, S. F. Michael, L. B. Cummins, L. O. Arthur, M. Peeters, G. M. Shaw, P. M. Sharp, and B. H. Hahn.1999. Origin of HIV-1 in the chimpanzee Pan troglodytes
troglodytes. Nature (London)397:436–441.
20. Geijtenbeek, T. B., D. S. Kwon, R. Torensma, S. J. van Vliet, G. C. van Duijnhoven, J. Middel, I. L. Cornelissen, H. S. Nottet, V. N. KewalRamani, D. R. Littman, C. G. Figdor, and Y. van Kooyk.2000. DC-SIGN, a dendritic cell-specific HIV-1-binding protein that enhances trans-infection of T cells.
Cell100:587–597.
on November 8, 2019 by guest
http://jvi.asm.org/
21. Gilbert, P. B., I. W. McKeague, G. Eisen, C. Mullins, A. Gueye-Ndiaye, S. Mboup, and P. J. Kanki.2003. Comparison of HIV-1 and HIV-2 infectivity
from a prospective cohort study in Senegal. Stat. Med.22:573–593.
22. Gomes, P., A. Abecasis, M. Almeida, R. Camacho, and K. Mansinho.2003.
Transmission of HIV-2. Lancet Infect. Dis.3:683–684.
23. Hahn, B. H., G. M. Shaw, K. M. De Cock, and P. M. Sharp.2000. AIDS as
a zoonosis: scientific and public health implications. Science287:607–614.
24. Harrigan, P. R., S. Bloor, and B. A. Larder.1998. Relative replicative fitness of zidovudine-resistant human immunodeficiency virus type 1 isolates in
vitro. J. Virol.72:3773–3778.
25. Janssens, W., L. Heyndrickx, G. Van der Auwera, J. Nkengasong, E. Beir-naert, K. Vereecken, S. Coppens, B. Willems, K. Fransen, M. Peeters, P. Ndumbe, E. Delaporte, and G. G. van der Groen.1999. Interpatient genetic
variability of HIV-1 group O. AIDS13:41–48.
26. Janssens, W., J. Nkengasong, L. Heyndrickx, G. Van der Auwera, K. Ver-eecken, S. Coppens, B. Willems, E. Beirnaert, K. Fransen, M. Peeters, and G. G. van der Groen.1999. Intrapatient variability of HIV type 1 group O
ANT70 during a 10-year follow-up. AIDS Res. Hum. Retrovir.15:1325–
1332.
27. Kanki, P. J., K. U. Travers, S. Mboup, C. C. Hsieh, R. G. Marlink, A. Gueye-Ndiaye, T. Siby, I. Thior, M. Hernandez-Avila, and J. L. Sankale.
1994. Slower heterosexual spread of HIV-2 than HIV-1. Lancet343:943–946.
28. Korber, B., M. Muldoon, J. Theiler, F. Gao, R. Gupta, A. Lapedes, B. H. Hahn, S. Wolinsky, and T. Bhattacharya.2000. Timing the ancestor of the
HIV-1 pandemic strains. Science288:1789–1796.
29. Leitner, T., and J. Albert.1999. The molecular clock of HIV-1 unveiled through analysis of a known transmission history. Proc. Natl. Acad. Sci. USA
96:10752–10757.
30. Levin, B. R., and J. J. Bull.1994. Short-sighted evolution and the virulence
of pathogenic microorganisms. Trends Microbiol.2:76–81.
31. Marlink, R., P. Kanki, I. Thior, K. Travers, G. Eisen, T. Siby, I. Traore, C. C. Hsieh, M. C. Dia, and E. H. Gueye.1994. Reduced rate of disease
develop-ment after HIV-2 infection as compared to HIV-1. Science265:1587–1590.
32. Marozsan, A. J., D. M. Moore, M. A. Lobritz, E. Fraundorf, A. Abraha, J. D. Reeves, and E. J. Arts.2005. Differences in the fitness of two diverse wild-type human immunodeficiency virus wild-type 1 isolates are related to the
effi-ciency of cell binding and entry. J. Virol.79:7121–7134.
33. Marozsan, A. J., E. Fraundorf, A. Abraha, H. Baird, D. Moore, R. Troyer, I. Nankja, and E. J. Arts.2004. Relationships between infectious titer, capsid protein levels, and reverse transcriptase activities of diverse human
immu-nodeficiency virus type 1 isolates. J. Virol.78:11130–11141.
34. Martinez-Picado, J., A. V. Savara, L. Sutton, and R. T. D’aquila.1999. Replicative fitness of protease inhibitor-resistant mutants of human
immu-nodeficiency virus type 1. J. Virol.73:3744–3752.
35. Matheron, S., S. Pueyo, F. Damond, F. Simon, A. Lepretre, P. Campa, R. Salamon, G. Chene, and F. Brun-Vezinet.2003. Factors associated with clinical progression in HIV-2 infected-patients: the French ANRS cohort.
AIDS17:2593–2601.
36. McCutchan, F. E.2000. Understanding the genetic diversity of HIV-1. AIDS
14(Suppl. 3):S31–S44.
37. Ndung’u, T., Y. Lu, B. Renjifo, N. Touzjian, N. Kushner, V. Pena-Cruz, V. A. Novitsky, T. H. Lee, and M. Essex.2001. Infectious simian/human immuno-deficiency virus with human immunoimmuno-deficiency virus type 1 subtype C from
an African isolate: rhesus macaque model. J. Virol.75:11417–11425.
38. Nijhuis, M., R. Schuurman, D. de Jong, J. Erickson, E. Gustchina, J. Albert, P. Schipper, S. Gulnik, and C. A. Boucher.1999. Increased fitness of drug resistant HIV-1 protease as a result of acquisition of compensatory
muta-tions during suboptimal therapy. AIDS13:2349–2359.
39. Norrgren, H., S. Andersson, A. J. Biague, Z. J. da Silva, F. Dias, A. Naucler, and G. Biberfeld.1999. Trends and interaction of HIV-1 and HIV-2 in Guinea-Bissau, west Africa: no protection of HIV-2 against HIV-1 infection.
AIDS13:701–707.
40. Novella, I. S., E. A. Duarte, S. F. Elena, A. Moya, E. Domingo, and J. J. Holland.1995. Exponential increases of RNA virus fitness during large
population transmissions. Proc. Natl. Acad. Sci. USA92:5841–5844.
41. Novella, I. S., S. F. Elena, A. Moya, E. Domingo, and J. J. Holland.1995. Size of genetic bottlenecks leading to virus fitness loss is determined by mean
initial population fitness. J. Virol.69:2869–2872.
42. Page, R. D. M.1996. TREEVIEW: an application to display phylogenetic
trees on personal computers. Comput. Appl. Biosci.12:357–358.
43. Paraskevis, D., P. Lemey, M. Salemi, M. Suchard, P. Y. Van De, and A. M. Vandamme.2003. Analysis of the evolutionary relationships of HIV-1 and SIVcpz sequences using bayesian inference: implications for the origin of
HIV-1. Mol. Biol. Evol.20:1986–1996.
44. Peeters, M.2000. Recombinant HIV sequences: their role in the global
epidemic, p. I-39–I-54.InC. Kuiken, B. Foley, B. Hahn, B. Korber, F.
McCutchan, P. Marx, J. Mellors, J. I. Mullins, J. Sodroski, and S. Wolinsky (ed.), Human retroviruses and AIDS 2000. Theoretical Biology and Biophys-ics Group, Los Alamos National Laboratory, Los Alamos, NM.
45. Pope, M., S. S. Frankel, J. R. Mascola, A. Trkola, F. Isdell, D. L. Birx, D. S. Burke, D. D. Ho, and J. P. Moore.1997. Human immunodeficiency virus type 1 strains of subtypes B and E replicate in cutaneous dendritic cell-T-cell
mixtures without displaying subtype-specific tropism. J. Virol.71:8001–8007.
46. Quin˜ones-Mateu, M. E., J. L. Albright, A. Mas, V. Soriano, and E. J. Arts.
1998. Analysis ofpolgene heterogeneity, viral quasispecies, and drug
resis-tance in individuals infected with group O strains of human
immunodefi-ciency virus type 1. J. Virol.72:9002–9015.
47. Quin˜ones-Mateu, M. E., and E. J. Arts.2001. HIV-1 fitness: implications for drug resistance, disease progression, and global epidemic evolution, p. 134–
170.InC. Kuiken, B. Foley, B. Hahn, P. Marx, F. McCutchan, J. Mellors, S.
Wolinsky, and B. Korber (ed.), HIV Sequence Compendium 2001. Theoret-ical Biology and Biophysics Group, Los Alamos National Laboratory, Los Alamos, N.Mex.
48. Quin˜ones-Mateu, M. E., S. C. Ball, A. J. Marozsan, V. S. Torre, J. L. Albright, G. Vanham, G. van der Groen, R. L. Colebunders, and E. J. Arts. 2000. A dual infection/competition assay shows a correlation between ex vivo human immunodeficiency virus type 1 fitness and disease progression. J.
Vi-rol.74:9222–9233.
49. Rangel, H. R., J. Weber, B. Chakraborty, A. Gutierrez, M. L. Marotta, M. Mirza, P. Kiser, M. A. Martinez, J. A. Este, and M. E. Quin˜ones-Mateu. 2003. Role of the human immunodeficiency virus type 1 envelope gene in
viral fitness. J. Virol.77:9069–9073.
50. Reed, L. J., and H. Muench.1938. A simple method of estimating fifty percent endpoints. A simple method of estimating fifty percent endpoints.
Am. J. Hyg.27:493–497.
51. Retief, J. D.2000. Phylogenetic analysis using PHYLIP. Methods Mol. Biol.
132:243–258.
52. Santiago, M. L., C. M. Rodenburg, S. Kamenya, F. Bibollet-Ruche, F. Gao, E. Bailes, S. Meleth, S. J. Soong, J. M. Kilby, Z. Moldoveanu, B. Fahey, M. N. Muller, A. Ayouba, E. Nerrienet, H. M. McClure, J. L. Heeney, A. E. Pusey, D. A. Collins, C. Boesch, R. W. Wrangham, J. Goodall, P. M. Sharp, G. M. Shaw, and B. H. Hahn.2002. SIVcpz in wild chimpanzees. Science 295:465.
53. Sivard, P., W. Berlier, B. Picard, O. Sabido, C. Genin, and L. Misery.2004. HIV-1 infection of Langerhans cells in a reconstructed vaginal mucosa.
J Infect. Dis.190:227–235.
54. Talbott, R., G. Kraus, D. Looney, and F. Wong-Staal.1993. Mapping the determinants of human immunodeficiency virus 2 for infectivity, replication
efficiency, and cytopathicity. Proc. Natl. Acad. Sci. USA90:4226–4230.
55. Thompson, J. D., D. G. Higgins, and T. J. Gibson.1994. CLUSTAL W: improving the sensitivity of progressive multiple sequence alignment through sequence weighting, positions-specific gap penalties and weight matrix
choice. Nucleic Acid Res.22:4673–4680.
56. Torre, V. S., A. J. Marozsan, J. L. Albright, K. R. Collins, O. Hartley, R. E. Offord, M. E. Quin˜ones-Mateu, and E. J. Arts.2000. Variable sensitivity of CCR5-tropic human immunodeficiency virus type 1 isolates to inhibition by
RANTES analogs. J. Virol.74:4868–4876.
57. Troyer, R. M., K. R. Collins, A. Abraha, E. Fraundorf, D. M. Moore, R. W. Krizan, Z. Toossi, R. L. Colebunders, M. A. Jensen, J. I. Mullins, and E. J. Arts.Changes in human immunodeficiency virus type 1 fitness and genetic diversity during disease progression. J. Virol., in press.
58. Vanham, G., L. Penne, H. Allemeersch, L. Kestens, B. Willems, G. G. van der, K. T. Jeang, Z. Toossi, and E. Rich.2000. Modeling HIV transfer between dendritic cells and T cells: importance of HIV phenotype, dendritic
cell-T cell contact and T-cell activation. AIDS14:2299–2311.
59. Vergne, L., A. Bourgeois, E. Mpoudi-Ngole, R. Mougnutou, J. Mbuagbaw, F. Liegeois, C. Laurent, C. Butel, L. Zekeng, E. Delaporte, and M. Peeters. 2003. Biological and genetic characteristics of HIV infections in Cameroon reveals dual group M and O infections and a correlation between SI-inducing phenotype of the predominant CRF02_AG variant and disease stage.
Virol-ogy310:254–266.
60. World Health Organization and Joint United Nations Programme on HIV/ AIDS.2004. AIDS epidemic update: 2004, p. 1–18. http://www.unaids.org /wad2004/report_pdf.html.
61. Yuste, E., C. Lopez-Galindez, and E. Domingo.2000. Unusual distribution of mutations associated with serial bottleneck passages of human
immunode-ficiency virus type 1. J. Virol.74:9546–9552.
62. Yuste, E., S. Sanchez-Palomino, C. Casado, E. Domingo, and C. Lopez-Galindez.1999. Drastic fitness loss in human immunodeficiency virus type 1
upon serial bottleneck events. J. Virol.73:2745–2751.