A COMPARATIVE
MID EXPIRATORY FLOW RATE BETWEEN
ASYMPTOMATIC TOBACCO SMOKERS
AND TOBACCO NON
THE TAMILNADU Dr. M.G.R MEDICAL
In partial fulfil
the award
A COMPARATIVE STUDY OF MAXIMUM
MID EXPIRATORY FLOW RATE BETWEEN
ASYMPTOMATIC TOBACCO SMOKERS
AND TOBACCO NON-SMOKERS
Dissertation
Submitted to
THE TAMILNADU Dr. M.G.R MEDICAL UNIVERSITY
n partial fulfilment of the requirements for
the award of the degree of
M.D PHYSIOLOGY
Branch V
APRIL 2017
UNIVERSITY
CERTIFICATE
This is to certify that the dissertation entitled “A COMPARATIVE STUDY
OF MAXIMUM MID EXPIRATORY FLOW RATE BETWEEN ASYMPTOMATIC TOBACCO SMOKERS AND TOBACCO NON-SMOKERS” is a bonafide work done by Dr. JIYA MICHAEL in partial
fulfilment of the university rules and regulations for award of M.D.
Physiology [Branch-V] under my guidance and supervision during the
academic year 2014-2017.
Dr. Rajagopalan Asari,M.D.,
[Co-Guide]
Asso. Professor
Department of Physiology Sree Mookambika Institute of Medical Sciences [SMIMS] Kulasekharam [K.K District] Tamil Nadu -629161
Dr. P.S. Krishnamurthy,M.D.,
[Guide]
Professor and HOD Department of Physiology Sree Mookambika Institute of Medical Sciences [SMIMS] Kulasekharam [K.K District] Tamil Nadu -629161
Dr. Rema. V. Nair, M.D., D.G.O.,
Director
DECLARATION
I Dr. JIYA MICHAEL here by submit the dissertation “A COMPARATIVE STUDY OF MAXIMUM MID EXPIRATORY FLOW RATE BETWEEN ASYMPTOMATIC TOBACCO SMOKERS
AND TOBACCO NON-SMOKERS” done in partial fulfilment for the award of the degree M.D. Physiology [Branch-V] in Sree Mookambika Institute of Medical Sciences, Kulasekharam. This is an original work done by me under the guidance and supervision of Dr. P.S. Krishnamurthy, M.D.
Dr. Jiya Michael
Post graduate
Department of Physiology Sree Mookambika Institute of Medical Sciences (SMIMS) Kulasekharam. [K.K District] Tamil Nadu -629161
Dr. P.S. Krishnamurthy,M.D.,
[Guide]
It’s time to look back and express my gratitude to all those wonderful people without whom my journey as a postgraduate wouldn’t have been a smooth sailing, as smooth and as beautiful as it was. Hence at the outset let me thank the almighty for giving me all I have and making all this possible.
I consider it my distinct privilege and honour to have worked under the guidance and supervision of Dr. P.S. Krishnamurthy, professor and HOD of Physiology, Sree Mookambika Institute of Medical Sciences, Kulasekharam. I express my feeling of gratitude and sincere appreciation for his guidance, constant support and encouragement in making the study possible. His constant help, patience and guidance helped me at every stage from conception to completion of this dissertation. I am blessed and privileged to be taught by such an eminent teacher.
My deepest gratitude and respect to my beloved Chairman
Dr. C.K. Velayuthan Nair and Director Dr. Rema V. Nair for
providing facilities to accomplish my dissertation work.
I extend my sincere heartfelt thanks to my co-guide, Associate Professor Dr. P. Raja Gopalan Asari whom I am highly indebted for his relentless help, proficient ideas and constant encouragement.
It is with the supreme sincerity and deep sense of gratitude that I thank the inspiring guidance and help given to me by my Professor
help, unconditioned support, valuable suggestion and encouragement in completing this study.
I am thankful to my colleagues Dr. Archana Chandran,
Dr. Hoshea Jeba Ruth for their voluntary help and support during this
study.
I am thankful to all other non-teaching staff members for their support and co-operation in completing this work.
Lastly, I am forever indebted to my parents Dr. Francis Xavier,
Dr. Philomina, Dr. Michael and Dr. Thankamma for their support
and understanding throughout my study period.
Without the love and extra ordinary patience of my dear husband,
Dr. Antoney and my kids Joseph, Jude and David I would not have
No Contents Page No
1 INTRODUCTION 1
2 HYPOTHESIS AND SCIENTIFIC JUSTIFICATION 4
3 AIMS AND OBJECTIVES 6
4 REVIEW OF LITERATURE 7
4.1 Pulmonary function tests 7
4.1.1 Introduction to PFT 7
4.1.2 Objectives of PFT 7
4.1.3 History of PFT 8
4.1.4 General considerations of PFT 10
4.1.5 Classification of PFT 10
4.1.6 Static lung volumes and capacities 12 4.1.7 Dynamic lung volumes and capacities 15 4.1.8 Methods of measuring lung volumes 19
4.1.8.A. Introduction to spirometry 19
4.1.8.B. Indications 20
4.1.8.C. Contraindications 21
4.1.8.D. Equipments 21
4.1.8.E. Types of spirometer 23
4.1.8.F. Methods of spirometry 23
4.1.8.G.Technique of spirometry 23
4.1.8.H. Reference values 26
4.1.8.I. Interpretation and patters in common lung disorders 26 4.1.8.J Factors affecting lung volumes and capacities 28
4.2 NORMAL LUNG FUNCTIONS 29
4.2.1 Historical review 29
4.2.2 Development of respiratory system 30
4.2.3 Functional Anatomy 32
4.2.4 Weibel’s lung Model 32
4.2.5 Alveolar capillary network 33
4.2.8.A Respiratory Functions 36 4.2.8.B Non-respiratory Functions 36 4.2.9 Diffusion of gases through the respiratory membrane 38 4.2.9.A Respiratory Unit and Respiratory Membrane 38 4.2.9.B Factors affecting diffusion across respiratory membrane 40 4.2.10 Physiology of smaller airways 41 4.2.11 Relevance of smaller airways in Smoking 42
4.3 SMOKING 42
4.3.1 Introduction 42
4.3.2 Epidemiology of cigarette smoking in India 43
4.3.3 Historical Review 44
4.3.4 Toxicology 46
4.3.5 Biomarkers 49
4.3.6 Nicotine Addition 50
4.3.7 Health Hazards and pathologic changes 52
4.3.7.1 Harm to smokers 52
4.3.7.1.A. Cancer 52
4.3.7.1.B. Chronic Pulmonary disease 53
4.3.7.1.C. Infection 55
4.3.7.1.D. Cardiovascular system 56 4.3.7.1.E. Gasterointestinal system 56 4.3.7.1.F. Genito urinary system 57
4.3.7.1.G. Other complications 57
4.3.7.2 Harm to non-smokers 58
4.3.8 Importance of PFT in tobacco smokers 59
5 MATERIALS AND METHODS 61
5.1 Study Design 61
5.2 Study setting 61
5.3 Study period 61
5.4 Sample size calculation 61
5.5 Study groups 63
5.9 Instrument used for the study 64 5.10 Institutional Human Ethical Committee [IHEC] approval 65
5.11 Procedure 65
5.12 Pulmonary function testing 67
5.13 Statistical method of analysis 68
6 RESULTS 70
6.1 Study subjects 70
6.2 Assessment of Physical characteristics of study subjects: 70
6.3 Assessment of FVC 71
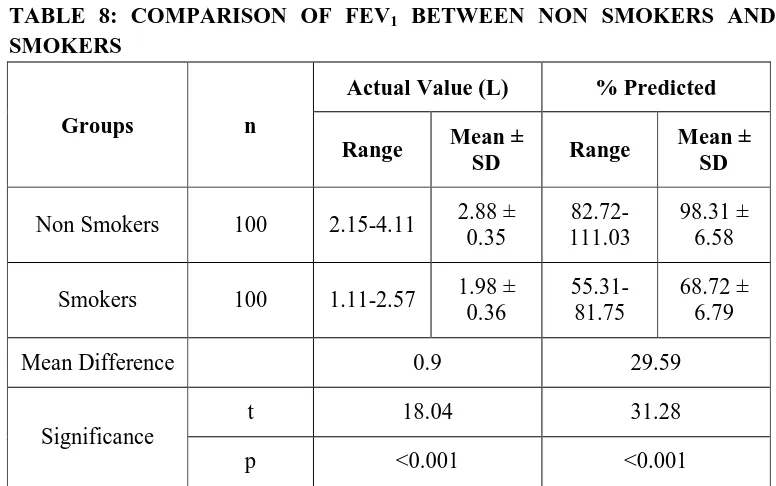
6.4 Assessment of FEV1 71
6.5 Assessment of FEV1/FVC 71
6.6 Assessment of FEF25-75% 71
6.7 Assessment of PEFR 72
6.8 Comparison of lung function parameters with relation to duration of smoking
72
7 DISCUSSION 86
8 CONCLUSION 93
9 SUMMARY 94
REFERENCES ANNEXURE
Institutional Research Committee [IRC] Certificate Institutional Human Ethics Committee [IHEC] Certificate Informed Consent Document
Case Record form Images
No Tables Page No
1 Lung Volumes and Capacities 12
2 Expiratory flow volume curve 15
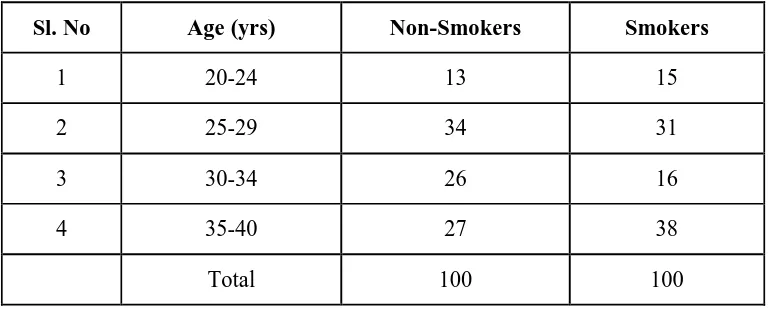
3 Bar diagram showing age wise distribution of non smokers and smokers
82
4 Bar diagram showing FVC, FEV1 and FEV1/FVC(% predicted)
in non smokers and smokers
82
5 Bar diagram showing FEF25-75% and PEFR (% predicted) in non
smokers and smokers
83
6 Line diagram showing comparison of FVC and FEV1 with
relation to duration of smoking
83
7 Bar diagram showing comparison of FEV1/FVC with relation
to duration of smoking
84
8 Line diagram showing comparison of FEF25-75% and PEFR with
relation to duration of smoking
84
9 Bar diagram showing comparison of lung function parameters with relation to number of cigarettes smoked per day
85
List of Tables
No Figures Page No
1 Major toxic constituents of particulate matter of tobacco smoke 48 2 Major toxic constituents of gaseous phase of tobacco smoke 49
3 Description of study groups 63
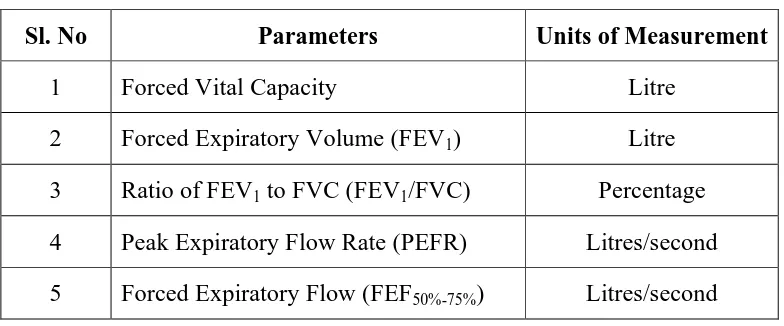
4 Details of parameters used in the study 64 5 Age wise distribution of non smokers and smokers 76
6 Physical characteristics of subjects 77
7 Comparison of FVC between non smokers and smokers 78 8 Comparison of FEV1 between non smokers and smokers 78
9 Comparison of FEV1/FVC between non smokers and smokers 79
10 Comparison of FEV25-75% between non smokers and smokers 79
11 Comparison of PEFR between non smokers and smokers 80 12 Comparison of lung function parameters with relation to duration
of smoking
80
13 Comparison of lung function parameters with relation to number of cigarettes smoked per day
[image:10.612.124.521.105.594.2]1 | P a g e
1. INTRODUCTION
Smoking is an important public health problem and it causes many
prevalent and preventable disease like asthma, COPD and also premature
death around the globe.1 WHO report says that smoking alone killed over 100
million people around the globe in 20th century and this rate will increase to 1
billion people in 21stcentury. Tobacco related deaths are expected to increase
to about 10 million a year around 2030. Smoking rates have gradually
decreased in industrialized countries since 1975, but there is a 50% increase
in smoking rates in low income countries.2 In India smoking is a common
habit in both urban and rural areas.
Respiration is the major integrator of all biological processes and due
to its direct connection to all other bodily functions it act as motor of life. So
when the respiratory system fails, life is in danger .The term small airway
generally refers to airways with an inner diameter of about 2mm and do not
have cartilage. Small airways are very thin walled and offer very minimal
resistance to the flow of air.3 Although small airways offer very minimal to
airway resistance, studies have shown that these (small airways) are important
site of airway obstruction in respiratory diseases like asthma and COPD; in
healthy subjects.3
Smoking causes inflammation, squamous epithelium metaplasia,
globlet cell changes, mucus plug formation in small airway, eventually
2 | P a g e
are responsible for the physical alterations in respiratory diseases like asthma
COPD etc.4 All these effects are directly proportional to the rate of smoking.
Thus smoking is the prime etiological factor in chronic lung disease.5
Even though the small airways are very important; it seems difficult to
study small airways obstruction by the commonly used lung function tests.
Pulmonary function test are the only valuable investigation in diagnosis and
treatment of patients with suspected respiratory problems.
Spirometry is the most commonly used tool to assess lung function. It
is a very simple, non-invasive procedure used for measuring the flow and
volume of air in the lungs as function of time using forced maneuvers.6
Spirometry and the spirometric parameters helps in finding out obstructive or
restrictive respiratory defects. The reduction in FEV1, more than FVC shows
obstructive defects like asthma or COPD.7
Asthma and COPD, the most prevalent airway diseases are
characterized by personal, social and also economic impact. COPD cause
significant economic burden including hospitalization, absence from work
and disability.8 So it is very important to detect these diseases at reversible
and early stage to prevent further damage to respiratory system.
Both asthma and COPD is characterized by airway obstruction, airway
inflammation and remodelling occurs in both large and small airways in later
state.3 Pathological and Physiological studies in cigarette smokers indicate
3 | P a g e
less than 2mm and without cartilage. The airway in this region of bronchial
tree (terminal portion) is not detectable by normal spirometric parameters like
FVC, FEV1 or FEV1/FVC.5Assessment of maximum mid expiratory flow rate
is the specific and sensitive test for early detection of these small airway
4 | P a g e
2. HYPOTHESIS
There is significant decrease in small airway function in tobacco
smokers compared to non-smokers.
SCIENTIFIC JUSTIFICATION
Smoking is a major risk factor for the development of small airway
obstruction which will later develop into major lung diseases like asthma,
COPD. It is has been found out that there is decrease in maximum mid
expiratory flow rate in smokers, which indicates the smaller airways are
affected.
Khan A et al found out that the prevalence of undetected airflow
obstruction is high among asymptomatic active smokers.9 Another study by
Hussain M et al concluded that there is strong association between duration of
smoking and development of airway obstruction even before the smokers
becomes symptomatic.10
There are only very few studies in Indian context that examines the
role of maximum mid expiratory flow rate among asymptomatic smokers,
which is the specific test for small airway obstruction. This will help in early
and accurate detection of airways disease at very early stage. It was evident
from study by Kaur H et al that, smokers who had their lung functions
measured and explained to them in a specific way, were more likely to have
5 | P a g e
Spirometry is very effective and the easiest method for detecting
airway diseases (asthma, COPD) in risk group of people like smokers. The
key method to prevent airway diseases and reduce lung cancers in community
is by identifying the airway changes at an early stage of diseases and
encourage smoking cessation efforts as there is no other effective treatment
that can restore lung function.
The study may also be beneficial in providing an opportunity for a
reappraisal of the importance of small airways in respiratory disease and
relationship with smoking. Hence it has been proposed to study the maximum
mid expiratory flow rate and other spirometric parameters among smokers
Aims & objectives
6 | P a g e
3. AIMS AND OBJECTIVES
This study is aimed to find out the following in rural population of
Kanyakumari district, Tamilnadu.
1. To study the effects of tobacco smoking on pulmonary function tests.
2. To determine the effects of tobacco smoking on small airway function
3. To know whether there is any statistically significant difference in
small airways function as measured by spirometry among
7 | P a g e
4. REVIEW OF LITERATURE
4.1 PULMONARY FUNCTION TESTS
4.1.1.Introduction to Pulmonary Function Tests
Respiratory physiology has now become a major concern in modern
medicine and pulmonary function tests are an inevitable method for evaluation
of the healthy functioning of respiratory system.16 The lung function test are
very simple procedure and give an early insight in the diagnosis and treatment
responses of pulmonary disease.17 The different respiratory diseases can be
identified and monitored using lung function tests.18
4.1.2 Objectives of Pulmonary Function Tests
1. To assess objectively and quantitatively the nature and degree of altered
physiology in a patient with respiratory disease.
2. To know the effect of therapy on deranged lung functioning.
3. To keep a longitudinal follow-up of patients with respiratory disease and
help in the assessment of the natural history of the respiratory disease in a
given patient.
4. To allow surveillance in patients exposed to environmental insults, in
patients who have received cytotoxic drugs or who have received
radiotherapy to the lungs, mediastinum or chest wall.
5. To evaluate the effects of neuromuscular or cardiovascular disease on the
respiratory system.
8 | P a g e
4.1.3 History of PFT
The history of experimentation on human lungs started in 160 AD by
Galen who first performed volumetric experiments on human ventilation. In
1689, Borelli GA measured the lung volumes for the first time; after that the
progress of lung function tests has evolved drastically. Borelli done an
experiment by sucking liquid from cylindrical tube with closed nostrils and
measured the inspiratory volumes of lungs.21
In 1718, tidal volume and maximal expiratory volume was
experimentally measured by Jurin J by blowing air into the bladder, the results
were confirmed by Hales in 1727. Another renounced scientist Bernoulli in
1749 demonstrated a method of measuring the expiratory volume.22
Around 1795 Abernethy and Goodwyn E measured the vital capacity.19
In 1796 Menizier R introduced plethysmography method and measured
the tidal volume by using mercury and gasometer in 1799.23
Hydrogen dilution method for finding out lung volumes was
introduced by Humphry Davy in 1800. Kentish E and Thrackrah CT (1831)
used a pulmometer to measure ventilatory volumes and in 1837 AD
interpretation of arterial and venous blood gases was done by Magnus by
using extraction technique.30
Turnover in history of respiratory experiments was done by John
Hutchison in 1844. He invented the spirometer. Hutchison’s water spirometric
9 | P a g e
Hutchison’s spirometer was modified in 1854 by Wintrich and he
measured various lung parameters and demonstrated that vital capacity is
dependent on bodyweight, age and height of the person.31
In 1859 portable spirometer was introduced by Smith E and Salter (1866)
made changes in spirometer and added kymograph to it to record time while
measuring lung volumes. Total body plethysmography was first developed by
Bert P in 1868 and Gad J in 1879 invented pneumatograph and named as
“Aeroplethysmograph”. Dead space during post mortem was measured by
Loewy in 1894.
Another important instrument was introduced by Brodie TG in 1902,
the dry bellow wedge spirometer; which is now modified as Fleisch
spirometer and in 1904 Tissot developed closed circuit spirometer.18
Alveolar sampling method was introduced by Haldane and Priestly in
1905 AD. Spiro-ergometry principle was introduced by W.H Kipping in 1929.
Peak flow meter was introduced by Wright BM and McKcrrow CB in
1959 and modified light weighted and economical peak flow meter was
introduced by Campbell in 1974.19
After Hutchison developed spirometer in 1846; 100 years passed for
Tiffeneau to add the timed vital capacity as a measure of airflow in lungs. Thus
spirometry became complete as a diagnostic instrument (Tiffeneau, Pinelli
10 | P a g e
The modern computerized spirometer was introduced in 1990 and
modern portable spirometry for recognizing early signs of lung transplant
rejection was introduced in 2000.
4.1.4 General Considerations of PFT
Spirometry is a non-invasive tool for measuring the airflow and
volume of air in lungs, as a function of time, using forced manoeuvres.14 It is
the modern accepted clinical tool for detecting obstructive, restrictive or
mixed respiratory defects.13 It is very simple and a very quick procedure to
perform.15
General considerations before performing spirometric test are the
subject has to be in either sitting or standing position, preferably sitting for
preventing falling from syncope. The age, gender, race, level of regular
physical activity height weight and clothing has to be considered because
these parameters have impact on the tests. The mouth pieces and nose clips
have to be disinfected and sterilized to prevent cross contamination among the
subjects.20
4.1.5 Classification of PFT
Pulmonary function tests can be classified under three categories as
a. Tests for assessment of ventilation
b. Tests for assessment of gaseous exchange in the lungs
11 | P a g e
a. Tests for assessment of ventilation
i. Static lung volumes
• Tidal volume (TV)
• Expiratory reserve volume(ERV)
• Inspiratory reserve volume(IRV)
• Residual volume(RV)
ii. Static lung capacities
• Inspiratory capacity (IC)
• Functional residual capacity(FRC)
• Vital capacity(VC)
• Total lung capacity(TLC)
• Expiratory capacity(EC)
iii. Mechanics of breathing
• Forced vital capacity (FVC)
• Timed vital capacity(TVC)
• Maximum mid expiratory flow rate (MMFR)
• Peak expiratory flow rate(PEFR)
• Maximum voluntary ventilation (MVV)
• Closing volume(CV)
• Maximal inspiratory pressure(MIP)
12 | P a g e
b. Tests for assessment of gaseous exchange in the lungs
i. Ventilation perfusion matching
ii. Diffusion capacity
[image:26.612.141.501.203.473.2]iii. Arterial blood gas analysis
Figure 1: Lung volumes and capacities [Adopted from Hall JE. Guyton and Hall textbook of medical physiology. 12th ed. Philadelphia: Saunders Elsevier; 2011. P.465-75).26
4.1.6 Static lung volumes and capacities
Tidal volume(TV)16
The amount of air inspired or expired during quiet breathing represents
the tidal volume. Normal value of TV is about 500 ml; of which 350ml of air
only takes part in alveolar ventilation. The remaining 150 ml constitutes the
13 | P a g e
Inspiratory reserve volume(IRV)17
The maximum amount of air a person forcefully inhales after normal
tidal inspiration represents IRV. Normally it is about 3.3 litres in males and
1.9 litres in females. So it is about 2000 - 3500 ml in normal adults.
Expiratory reserve volume(ERV)24
The maximum amount of air a person forcefully exhales after normal
tidal expiration represents ERV. Normally it is about 1.2 litres in males 0.9
litres in females.
So it is about 700 – 1300 ml in normal adults.
Residual Volume(RV)25
It is amount of air that is present or left behind inside the lungs after
maximal forceful expiration. It constitutes about 20–25% of total lung
capacity and is directly proportional to the age of the individual. The alveoli is
kept inflated in between two breaths by residual volume.26
Normal value of RV in men is 1.2 litres and in females is 1.1 litres.
Capacities
Inspiratory capacity(IC)27
The maximum volume of air inspired after normal tidal expiration,
represents inspiratory capacity. Therefore it equals the tidal volume and
inspiratory reserve volume (TV+IRV) and is approximately 3500 ml in a
14 | P a g e
Expiratory capacity (EC)29
The maximum volume of air expired after normal tidal inspiration,
represents EC. It equals tidal volume plus expiratory reserve volume (TV +
ERV) and is approximately about 1600 ml in normal adult male.
Functional residual capacity (FRC)
The volume of the air remaining inside the lungs after normal tidal
expiration, represents FRC. Therefore it equals the expiratory reserve volume
plus the residual volume (ERV+RV) and is about 2300ml in a normal adult
male.
Vital capacity
This is the maximum amount of air a person expels from the lungs after
the deepest possible inspiration. Therefore it equals the tidal volume + the
expiratory reserve volume + inspiratory reserve volume,(TV +IRV+ERV) and is
about 4600 ml in a normal adult male.
Total lung capacity(TLC):
The amount of air present inside the lungs after the maximal
inspiration represents TLC. It equals the vital capacity plus the residual
15 | P a g e
4.1.7 Dynamic lung volume and capacities
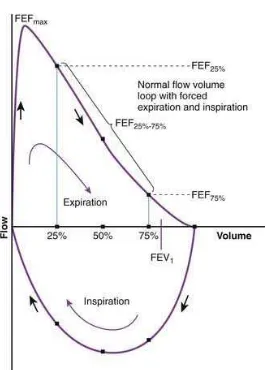
Figure 2: Expiratory flow volume curve [Adapted from Altalag A, Road J, Wilcox P. Pulmonary function tests in clinical practice. 1st ed. London: Springer-Verlag; 2009. p. 1-57)24
Forced Vital capacity (FVC)16
The amount of air exhaled forcefully represents the forced vital
capacity.15 The normal value of FVC is the % predicted FVC more than
80%.32 FVC is decreased in obstructive lung diseases due to small airway
[image:29.612.188.454.107.477.2]16 | P a g e
Forced expiratory volume in first second(FEV1)17
(Timed Vital Capacity)
It is the fraction of vital capacity expired in the specified time.7 It
represents the volume of air exhaled in the 1st second in FVC test.33 This test
measures the vital capacity in relation to time. 80% of FVC is normally
expired at the end of first second. It is one of the most useful test to detect
generalized airway obstruction.34It is a relatively insensitive indicator of
smaller airway obstruction.15
FEV1 is considered as indicator of airway obstruction due to its
relation with the pathologic scores in airway diameter; and is a predictor of
mortality of airway diseases. FEV1 values obtained in research and clinical
practice is endorsed by the National Asthma Education and Prevention
Program (NAEPP) as an important component of the asthma severity
classification scheme.35
FEV1/FVC ratio
This ratio is very useful in diagnosis of airway disease. The FEV1
/FVC ratio is reduced in obstructive lung diseases.
• COPD is diagnosed based on pulmonary function test showing
irreversible air flow limitation.36
• Asthma is diagnosed by pulmonary function test showing reversible air
17 | P a g e
Recent studies have shown that age of the subject is a major
determining factor of FEV1/FVC; but the nature of this dependence is
uncertain.39 Tomasz Golczewski et al (2012) mathematically analysed and
found out that there is a very strong; age-independent linear relationship
between FEV1 and FVC.
Peak expiratory flow rate(PEFR)
The maximum rate of air flow which is sustained for a period of 10
milliseconds during a forced expiration; after a maximal inspiration is PEFR.
It is measured in litres/sec or litres/min. This value is useful to assess the
responsiveness of medications in obstructive lung diseases. PEFR reflects
large airway functions.15,7 It can be measured by a peak expiratory flow meter
and is normally about 400-600 litres per minute or 6-10 litres per second. It
indicates patency of airways.
Forced expiratory flow at 50% of the vital capacity (FEF 50%)
This measures the flow of air at which 50% of the VC has been
exhaled from the lungs in the forced vital capacity testing. This test is
important for determining lung diseases. In obstructive lung disease, patient
exhales less than that measured in a normal person.15
Forced expiratory flow at 75% of Vital capacity (FEF 75%)
FEF 75% measures the instantaneous flow rate at which 75% of the
18 | P a g e
Maximum Voluntary Ventilation(MVV)
Also known as maximum breathing capacity (MBC), represents the
amount of air that a person can breathe in one minute by maximal voluntary
effort. The MVV is reduced in many respiratory disorders. In obstructive
airway diseases the reduction in MVV is much greater than the reduction in
VC; but in restrictive disorders VC is reduced to a greater extent than MVV.
The normal range is 120-180 litres/minute.40
Closing Volume (CV)
The remaining amount of air in the lungs after closure of small airways
is the closing volume. It is an indicator of small airway obstruction.
Maximal inspiratory pressure (MIP)
It indicates power of inspiratory muscles. It is the pressure generated to
take in air maximally against a closed airway after complete expiration.41
Maximum expiratory pressure (MEP)
It is an indicator of power of expiratory muscles. It is the pressure
generated to expire maximally against a closed airway after complete
inspiration.
Maximum mid expiratory flow rate (MMEFR)
It is the pulmonary function tests which indicate the small airway
function.3This is the maximum flow achieved during the middle half of the
25-19 | P a g e
75% of lung volume (FEF 25% -75%). 42
FEF 25% - 75% indicates the patency of
small airway. Using computerized spirometry, the value is compared with the
percentage predicted value. If it is less than the predicted value, it is an
indicator of early obstructive disease even if FEV1/FVC ratio is normal.
The maximum mid expiratory flow rate was first introduced by
Leuallen and Fowler in 1955 as a simple sensitive means for the detection of
respiratory obstruction.42
4.1.8 Methods of measuring lung volumes24,44
a. Spirometry
b. Open Circuit Nitrogen washout method
c. Closed Circuit inert gas dilution technique
d. Whole body Plethysmography
e. Radiographic method
Spirometry
4.1.8.A. Introduction to Spirometry
Spirometry is the most commonly used lung function test. In many
ways its utility can be compared to blood pressure measurement or ECG in
routine cardiac evaluation. However one needs to pay careful attention to
follow standard procedures while performing and interpreting the test.
Because the residual volume in lungs cannot be exhaled; spirometric
20 | P a g e
4.1.8.B. Indications
The most common indication for doing spirometry is a functional
evaluation of patient with lung disease. The presence of spirometric
abnormalities; as well as the degree of impairment; provides useful
information about the disease severity and pulmonary reserve of the patient.
Often the test is conducted to narrow the differential diagnosis of a patient
being assessed for pulmonary disorder. For instance, the documentation of
airflow limitation in a smoker being evaluated for breathlessness would
increase the probability of the patient having COPD. Because the test can be
repeated and the results are quite reproducible for a given patient, serial
measurements can provide information about disease progression as well as
response to prescribed treatment.
The test also has an important role in clinical trials; as it is the best
standardized objective surrogate for true pulmonary functions. Spirometry is
also used as screening tool for studies in epidemiologic surveys as it may
provide an objective definition of disease state such as bronchial asthma. It
can also be used to screen at risk populations for subclinical disease (for
example preoperative assessment or detecting COPD among asymptomatic
smokers).
The test is also utilized in occupational setting; both for detecting
21 | P a g e
symptomatic people (for example as part of compensation procedures).
Finally spirometry is an important research tool for understanding
pathophysiology and temporal cause of several diseases as well as for the
derivation and validation of reference equations.
4.1.8.C. Contraindications
It is also important to understand when not to perform spirometry.
Any benefits from the information obtained through this test should be
carefully weighed against patient discomfort and risk. The test is better
avoided in pregnant and severely dyspnoic patients. It should also not be
performed in patients where pressure swings due to forced expiratory
maneuver can worsen existing conditions (such as ruptured tympanic
membrane, bronchopleural fistula, on-going hemoptysis etc.
It should be avoided in patients with myocardial infarction within 1
month or patients with dementia and in confused state. Persons with facial
pain or oral pain which is aggravated by mouth piece can be avoided. Also
patients with stress incontinence and chest pain or abdominal pain of any
cause can be avoided. Uncooperative patients and those on life support
systems should also not undergo the test.
4.1.8.D. Equipment
A wide range of apparatus, ranging from hand held portable devices to
22 | P a g e
systems is available to perform spirometry. Although many factors such as
cost, patient load, clinical requirements etc, determine the choice of machine; it
is important to use one that confirms to some minimum technical specifications
necessary to obtain valid results. Such recommendations for equipment
performance was laid out by the American Thoracic Society;45 and have
recently been updated as joint recommendation from the American Thoracic
Society and European respiratory society.46 The important performance criteria
relate to accuracy (degree of conformity to the true value), precision (degree of
repeatability of the same measurement) and resolution (minimum measurable
incremental quantity). It is also advisable to have a system that can be
calibrated periodically to ensure optimum performance.
Most commercially available spirometer nowadays are computerized
systems that employ a transducer to convert a mechanical signal to an
electrical one; and display the output in a way understood by the operator.
These equipments can be divided into two broad categories: volume
displacement spirometers and flow sensing spirometers. The former work
with volume as the primary output; and flow is a derived parameter. Such
machines have a water seal, a dry rolling seal or a bellows type design. Flow
sensing devices can either be electronic turbines or use electronic
pneumotachometers (sensors that estimate airflow from the change in
pressure occurring across a suitable resistance) which in turn can have a
23 | P a g e
displacement spirometers, these machines measure flow as the primary
signal, which is time integrated to yield volume estimates.
4.1.8.E. Types of Spirometer47
i. Incentive Spirometer
ii. Fully electronic Spirometer
iii. Pneumotachometer
iv. Whole body Plethysmograph
v. Peak flow meter
vi. Wind mill type spirometer
vii. Tilt – compensated Spirometer
4.1.8.F. Methods for measuring Spirometry48
i. Pneumotachograph
ii. Turbine
iii. Ultrasound
iv. Hot wire anemometer
4.1.8.G Technique of spirometry
A typical spirometry Session
• Ensure equipment integrity (electrical power, tubings, filters, etc.)
• Calibrate spirometer
24 | P a g e
• Obtain informed consent for procedure
• Check personal and clinical details (age, gender, smoking habits,
medications, diagnosis, previous tests, results of other investigations, etc.)
• Measure weight and standing height
• Explain (and preferably demonstrate) test procedure to the subject.
Forced expiratory maneuvers
• Apply nose clip
• Place appropriately sized mouthpiece in the mouth, and ask subject to
tightly close lips around it.
• Ask subject to breathe gently from and into the mouthpiece for a few
breaths.
• At end tidal expiration the subject inhales as completely as he can.
• Subject exhales as rapidly, completely, as forcefully and for as long as
possible till no more air can be expelled out from the lungs; provide
constant encouragement throughout. Repeat for a minimum of three
maneuvers.
Optimize test quality
• Verify that each maneuver is technically acceptable
o Satisfactory start of test (no hesitation)
o Good duration (expiratory time preferably more than six
25 | P a g e
o Free from artifacts (such as cough, submaximal effort, early
glottis closure, premature termination of expiration etc.)
• Check repeatability from among at least three acceptable maneuvers.
o Two largest FVC values within 150mL of each other
• Perform additional maneuvers if necessary till repeatability criteria are
satisfied
Check for bronchodilator reversibility (optional but recommended)
• Ask patient to inhale 400Ug of salbutamol, preferably through a
spacer attached to inhaler
• wait for 15- 30 minutes
• Repeat forced expiratory maneuvers as above ,and verify test
quality
Interpretation and reporting
• Compare observed values to predicted norms
• Look at shape, size and pattern of flow - volume loop
• Review available clinical information
• Categorize spirometry data into normal, obstructive or restrictive
patterns
• Assess the severity of pulmonary function impairment(if any )
26 | P a g e
4.1.8.H Reference Values
The basic purpose of PFT is to identify persons with abnormal lung
functions. To know what is abnormal, we must first define what is normal.
Predicted normal values can be obtained from studies carried out in healthy
subjects. They are usually in the form of a regression equation describing the
predicted value as a function of genders and anthropometric data (height,
weight etc) and differ greatly with ethinicity.49
Any value below the predicted normal is not necessarily reduced; since
the normal value is a range rather than a fixed point. This introduces the
concept of “lower limit of normal” or LLN. The simplest (and most widely
used) method is to use a fixed percentage of predicted value. For example, a
value less than 80% of predicted FEV1 can be considered abnormal.
4.1.8.I Interpretation and pattern in common disorders
Interpreting PFT is not just about looking at numbers generated by
spirometer. Both the volume - time curve and the flow- volume loop should
also be evaluated with regard to their technical quality, size and shape and
various components; before making a final interpretation.
Broadly, the interpretation of spirometric data involves only three
numerical variables FEV1, FVC and FEV1/FVC.14 The largest observed values
of FEV1 and FVC available from among at least three acceptable and
27 | P a g e
both forced and relaxed VC maneuvers have been performed; the larger value
of VC among those measurements should be used for interpretation.
Any spirometry record with normal FEV1, FVC and FEV1/FVC (i.e.,
all values more than their corresponding LLN values) should be interpreted as
normal. Any spirometry record with FEV1/FVC value below its predicted
LLN should be interpreted as having an obstructive abnormality. In situations
where statistically valid LLN figures are not available FEV1/VC ratio less
than 70% is often used to define airway obstruction.
An obstructive defect is commonly seen in disorders associated with
airflow limitations such as asthma and COPD. It may also be observed in
disease with small airway obstruction such as bronchiolitis, cystic fibrosis,
bronchiectasis, airway tumors etc. Patients with upper airway obstruction can
further be characterized based on appearance of flow volume loops.
Any spirometry record with a normal FEV1/FVC(i.e., value above
corresponding LLN) coupled with a reduced FVC (i.e, value below
corresponding LLN) is suggestive of restrictive abnormality. In situations
where statistically valid LLN figures are not available, observed FVC ratio
less than 80% of predicted value is often used to define reduction in FVC.
Restrictive defects are common in conditions with the loss of
functioning lung parenchyma (eg: diffuse parenchymal lung disease, lung
28 | P a g e
seen in neuromuscular disease (due to reduction in generation of force needed
for a FVC maneuver). Other restrictive defects are massive pleural effusion,
pleural fibrosis, obesity, Kyphoscoliosis etc.
4.1.8.J. Factors affecting lung volumes and capacities
1. Day and night variation
Bronchial tone increases during night leading to increase in airway
resistance. This decreases FEV1 during night compared to day time.
2. Age
Till 20 years lung volume increase with age. Between 20-25 years lung
volumes remain constant. After 20-25 years lung volumes decreases as the age
advances.
3. Sex
Until puberty lung volumes are equal in both sexes. After puberty lung
volumes are higher in males by 20-30%.
4. Posture
Lung volumes are higher in upright position. This is due to descent of
diaphragm and decrease in blood volume in pulmonary vessels in upright
position.
5. High altitude
29 | P a g e
4.2 NORMAL LUNG FUNCTIONING
Respiratory system
5.2.1. Historical review55,56
• Holy Bible says that the human life and respiration started, when God breathed into Adam’s nostrils, and later used a part of Adam’s ventilator
apparatus and the rib to give life to the next person, Eve.
• In 4th and 5th centuries BC Hippocrates teachings showed that the primary purpose of respiration is to cool the heart.
• In 1750, Joseph Black from Scotland, found that calcium carbonate on
heating produced a gas, and he called it “fixed air”, the Carbon-dioxide.
• In 1760s and 1770s, British scientist Cavendish, found out that fermentation and putrefaction of organic substances produced “fixed air”.
• Priestley in 1765 found that combustion, putrefaction of organic substances and breathing consumed “dephlogistonated air”, which on
reacting with nitric oxide (a colourless gas) produced nitrogen dioxide.
• Around 1770s, Lavoisier recognised that dephlogistonated air; and named it Oxygen (O2) that represented the 20% of air consumed by combustion in
Priestley’s experiments.
30 | P a g e
• In 1790s, Spallanzani, working in Italy, confirmed Lavoisier’s finding that Oxygen and Carbondioxide production does not occur in the respiratory
organ.
• Later work observed by Spallanzani showed that Oxygen consumption and Carbondioxide production is due to mitochondrial respiration in cells
(CO2 is formed by oxidation of carbon compounds).
4.2.2 Development of respiratory system
• The epithelial portion of lungs arise as a pouch from primitive foregut at 22-26 days after fertilization of ovum.
• It form laryngotracheal diverticulum that includes the oesophagus and the trachea as a single tube.
• Laryngotracheal tube continues to elongate, and this lung bud branches into two. Thus the primitive form of right and left lung is formed at 2-3
weeks. After that further branching continues, and the irregular
dichotomous branching turns into bronchial buds.
• The bronchial bud further divides to become bronchi .The right bronchus becomes slightly larger than and more vertical than the left bronchus. And
the right bronchus is the main continuation of the trachea and branch from
31 | P a g e Fetal lung development
The three important laws of lung development was proposed by Reid;
• The development of bronchial tree by 16th week,
• Alveoli by 8th year,
• Periacinar vessels parallel to development of alveoli. It is divided into three periods of development, they are
(i) Pseudoglandular period: In the 5-17 weeks of fetal life, the bronchial tree is developed. The bronchial tree is then differentiated, and the
important elements of lung tissue are developed except the bronchioles
and alveoli.
(ii) Canalicular period: During 16-25 weeks, the bronchioles and bronchi increase in size and vascularization of lung tissue occurs, cartilages
and glands develop. At the end of this period respiratory bronchioles
and primitive alveoli developed and so respiration is possible. Also
type II alveolar cells begin to secrete surfactant.
(iii) Terminal sac period: From 24 weeks till birth, the alveolus becomes thin, making ready for gas exchange. Pulmonary capillary proliferation
also takes place during this time. Alveoli develop after birth and
increase in number by 8 years of age and size increases until
adulthood. In this period the alveolar ducts are formed and alveoli
32 | P a g e
4.2.3 Functional Anatomy
The knowledge of respiratory physiology is essential for the
assessment of pulmonary function tests.50 The primary function of respiratory
system is to supply adequate oxygen and the removal of carbondioxide from
the pulmonary circulation.51 For this purpose, there should be adequate
provision of air to the alveoli for the supply of Oxygen and removal of
Carbondioxide gas [ventilation]. Adequate circulation of blood [perfusion]
and the adequate movement of gas between alveoli and pulmonary
capillaries[diffusion]are also other important factors. The diffusion and
appropriate contact between alveolar gas and pulmonary capillary blood also
govern the normal functioning of lungs. (ventilation-perfusion matching).50
Inhaled air enters the nasal passages, where it is warmed, humidified and
passes down the trachea and through the bronchioles, respiratory bronchioles and
alveolar ducts to the alveoli; where gaseous exchange occurs.52
4.2.4. Weibel’s lung Model
According to Weibel, a Swiss anatomist, there are 23 generations of
trachea bronchial tree numbered from 0 to 23. Trachea is numbered as zero and
the alveolar sac is numbered as 23. The conducting zone of the air passage is
formed by the first 16 generations of passages. This zone only transports gas
from and to the exterior. The conducting zone starts from trachea till terminal
33 | P a g e
transitional or the respiratory zone. In this zone the actual gas exchange occurs.
This zone is made up of respiratory bronchioles; alveolar ducts and alveoli. The
total cross sectional area of the airways is much increased from 2.5 cm2 in the
trachea to 11,800 cm2 in the alveoli by these multiple divisions. So that the
velocity of airflow in the small airways falls to very low values.8 The term
small airways generally refers to airways with an inner diameter of about
<2mm in diameter and are without cartilage and submucosal glands.
Obstruction of these small airways will affect the ventilation and leads to small
airway closure along with air trapping.3
Since gaseous exchange occurs only in the respiratory zone of the
airways, the air occupying the rest of the respiratory system is not available
for gas exchange with pulmonary capillary blood.52 During inspiration, only
the first 350ml of the 500ml inspired air with each breath mixes with the air in
the alveoli. Likewise with each expiration, the first 150 ml expired gas, is the
gas that occupied the dead space, and only the last 350 ml is from the alveoli.
Thus, the alveolar ventilation or the air reaching the alveoli per minute is
usually less than the respiratory minute volume.
4.2.5 Alveolar capillary network
Gaseous exchange takes place via a dense network of alveoli and
capillaries which is known as alveolar capillary network. Respiratory
34 | P a g e
the alveolar capillary unit. Normal adult lung contains about 300 million
alveoli. The size of each alveoli is 250 microns. The entire surface of each
alveoli is covered by 1000 capillaries. Thus the presence of large number of
alveoli and capillaries, the surface area for the exchange of gases increases
which is about 50 –100m2.
Normally, inspired air get mixed with the alveolar gas, and replaces the
carbon-dioxide that has entered the alveoli with oxygen from the air. Part of
this mixture is exhaled. The ratio of pulmonary ventilation to pulmonary
blood flow of lung is about 0.8 (4.2 litres/min ventilation; divided by 5.5
litres/min blood flow).52
4.2.6 Microscopic Structure of Alveolus
Each alveolus consists of two types of epithelial cells.
• Type I cells are present in more numbers and cover 95% of epithelial
surface area of alveoli. They are flat and large cells, with numerous
cytoplasmic extensions.
• Type II cells also called granular pneumocytes, secrete surfactant. They
play an important role in alveolar repair. The cells have numerous lamellar
inclusion bodies.
The alveolar wall also contains:
• Other special type of epithelial cells
• Pulmonary alveolar macrophages (PAM) which are active phagocytic
35 | P a g e
• Lymphocytes
• Plasma cells which form and secrete immunoglobulins
• Amine precursor uptake and decarboxylation (APUD) cells which
store and secrete many biologically active peptidases, e.g. vasoactive
intestinal peptide (VIP) and substance P
Communication between the two alveoli occurs through small pores,
called pores of Kohn.
4.2.7 Innervation
Blood Supply
Conducting airway is supplied by systemic blood, whereas the
respiratory zone of the lung is supplied by deoxygenated (venous) blood
coming through pulmonary arteries to lungs. Blood is oxygenated in lungs
and is returned to left atrium via pulmonary veins.53
Nerve Supply
The main innervation of the walls of bronchi and bronchioles is by the
autonomic nervous system.
• Parasympathetic fibres innervate through vagus nerve, their stimulation
causes cholinergic discharge producing bronchoconstriction and increased
bronchial secretion via muscarinic receptors.
36 | P a g e
• Sympathetic nerve supplying the lungs when stimulated causes
bronchodilation and decreased bronchial secretion via adrenergic
receptors.
4.2.8 Functions of the respiratory system
4.2.8.A. Respiratory functions
The main function of the respiratory system is exchange of gases
between atmosphere and blood.
4.2.8.B Non-respiratory functions
Besides the respiratory the respiratory system performs many
important non-respiratory functions which include:
1. Function subserved by lung defence mechanisms
Respiratory system is involved in defence functions by following
mechanisms;
a. Organisms that enter the lungs are phagocytosed by pulmonary alveolar macrophages (PAMs) or dust cells or the intestinal macrophages in the
lung. Particles less than 2 micrometer in diameter reach alveoli, where
they are phagocytosed by alveolar macrophages.
37 | P a g e
c. The epithelium of lungs contains protease activated receptors that on activation releases PGE2, which in turn protects pulmonary epithelial cells. Particles
more than 10 micrometer in diameter are removed by hairs in the nostrils.
d. Ciliary escalator action is an important defence system against airborne infection. Cigarette smoking disturbs the ciliary function. That explains
why there is higher incidence of respiratory infections in smokers.55
2. Functions subserved by Pulmonary Circulation
a. Reservoir for left ventricle: The entire cardiac output from right ventricle
is pumped into pulmonary circulation. Due to their high compliance,
pulmonary vessels normally accommodate about 0.5 litre of blood at any
given time. This serves as reservoir for left ventricular filling.
b. Pulmonary Circulation acts as a filter: and filters out particles from the
blood which may include small fibrin or blood clots, fat cells, gas bubbles,
RBCs, platelet masses and debris from blood.
c. Removal of fluid from alveoli: Because of low pulmonary hydrostatic
pressure the fluid entering the alveoli is absorbed by the capillaries. This
provides protection for the gas exchange function of lungs and checks
transudation of fluid from capillaries to the alveoli.56
d. Role in absorption of drugs: Certain drugs that rapidly pass through the
alveolar capillary barrier by diffusion are administered by inhalation e.g.
38 | P a g e
3. Metabolic function of lungs
i. Surfactant produced in the lungs plays an important role in respiration.
ii. Protein Synthesis for maintenance off the structural framework.
iii. Angiotensin converting enzyme is mainly secreted by endothelium of the
pulmonary blood vessels. It converts angiotensin 1 to angiotensin 2;
which occurs in pulmonary circulation.
iv. Inactivation partly or completely of many vasoactive substances present
in the blood is done by capillary endothelial cells as they pass through
pulmonary circulation. These substances include bradykinin, serotonin,
some prostaglandins, norepinephrine, acetyl choline etc
v. Fibrinolytic mechanism present in the lung lyses clot in the pulmonary
vessels.
vi. Storage of Hormones and Certain Biologically Active Peptides is done in
the APUD cells and nerve fibres present in the alveoli. These substances
include VIP substance, opioid peptides, Cholecystokininpancreozymin
(CCK – PZ) and somatostatin.
4.2.9. Diffusion of gases through the respiratory membrane
4.2.9.A. Respiratory Unit and Respiratory Membrane
The Respiratory unit consists of respiratory bronchiole, alveolar ducts,
and alveoli. About 300 million respiratory units are present in a single lung.
The exchange of gases occurs through the membranes of all the structures in
39 | P a g e
Respiratory Membrane or pulmonary membrane or the
alveolocapillary membrane forms the blood gas interface that separates
blood in the pulmonary vessels with the air in the alveoli. Diffusion of gas
between the alveoli and pulmonary capillary blood takes place through this
membrane.
Structure of Respiratory Membrane
It consists of following layers
• Alveolar surfactant and fluid lining the alveolus.
• Alveolar epithelial cell layer
• Basement membrane of alveolar epithelial cells
• A very thin layer of interstitial fluid
• Capillary endothelial basement membrane
• Layer of capillary endothelial cells.
• Plasma
• Red cell membrane
• Intraerythrocyte fluid
• Hemoglobin molecule
Characteristic Features of respiratory membrane which optimize for the gas
exchange are:
• Thickness of the respiratory membrane despite the large number of
40 | P a g e
• The total surface area of respiratory membrane is about 70 square
metres in the normal adult.
4.2.9.B. Factors Affecting Diffusion across Respiratory Membrane
The diffusion of gases across the respiratory membrane is affected by
following factors:
1. Thickness of Respiratory Membrane: As mentioned above the thickness
of respiratory membrane(about 0.6um) has been optimized for gas
exchange. Diffusion is inversely proportional to the thickness of the
alveolar capillary membrane. Any factor which increases thickness will
therefore significantly decrease the gaseous exchange.
• Pulmonary oedema, i.e. collection of fluid in the interstitial space and
alveoli
• Pulmonary fibrosis occurring in certain lung diseases increase the
thickness of respiratory membrane.
2. Surface Area of Respiratory Membrane. Normally the surface area of
the respiratory membrane is about 70 square meters. Rate of diffusion is
directly proportional to the surface area (A), i.e. with the decrease in total
surface area the rate of diffusion of gases decrease.
3. Diffusion Coefficient. The rate of diffusion is directly proportional to the
41 | P a g e
4. Pressure Gradient across Respiratory Membrane. The rate of diffusion
across the respiratory membrane is directly proportional to the pressure
difference between the partial pressure of a gas in alveoli (PA) and in
pulmonary capillary (PC).59
This is called Fick’s law of diffusion. Thus it can be concluded that the
rate of pulmonary gas diffusion, i.e. the volume of gas that crosses the
respiratory membrane per minute is determined by several factors as defined
by Fick’s law of diffusion.
4.2.10. Physiology of smaller airways
Airways having diameter less than 2mm are considered as small
airways.60 They are pathways of low resistance and normally contribute
about 10% of total resistance to airflow.43 They endow with a laminar flow
of air due to low velocity of air flow through them and their high cross
sectional area.61 Low surface tension in them protects these airways from
closing at low lung volumes.62 Increased mucous secretion in them increases
the surface tension and lead to their collapse. If this collapse is extensive, it
leads to gas trapping and increased in residual volume.61 Hogg and
colleagues found out that small airway obstruction has little effect on lung
mechanics, but it affects distribution of ventilation.63 But it is usually
difficult to determine the small airway obstruction by the usual pulmonary
42 | P a g e
4.2.11. Relevance of small airways in smoking
• Studies have shown that disruption of small airway function was present
only when the FEV1/FVC<70%.64 Maximum mid expiratory flow rate is a
spirographic manifestation of small airway function. Small airway
obstruction is the key factor leading to development of asthma and COPD.65
• FEF25-75% is a spirographic parameter commonly used for detecting small
airway function.3
4.3 SMOKING
4.3.1 Introduction
Smoking is a malicious curse of today’s world.66 In India smoking is a
common habit in both the urban and rural areas. Cigarette smoking is said to
be the prime cause of preventable and premature morbidity and mortality
throughout the globe. Death due to tobacco related disease cause one in every
four cancers and one in four deaths globally.67,69 Premature death due to
smoking is about a one in three chance for a lifelong smoker.70
In respiratory physiology, smoking is particularly important as it is
the major cause of various types of respiratory malignancies and respiratory
disease in developed countries. Smoking also causes various other respiratory
infections like pneumococcal pneumonia, tuberculosis, chronic bronchitis and
43 | P a g e
accidents are promoted by smoking.71 Cessation of smoking, even in middle
age, decreases the risk of death from smoking related disease72 and disability.
Childhood smoking begins due to psychosocial reasons such as
parental smoking, curiousness, friends circle, peer pressure, rebellious attitude
and as a sign of freedom and independence.74 Once the habit become regular;
the pharmacological addictive properties of nicotine cause strong influence in
the continuation of it.75 Thus that habit becomes advantageous to the mood of
the person and life response.76 Russel described the effect of smoking as “the
most additive and dependence producing form of object specific
self-gratification known to man.77 One of the most striking information is that the
Asians who use drugs rated tobacco as their most wanted drug, more than
heroin, methodone, cannabies, LSD and alcohol.78 Yet the production and
sales of cigarette and tobacco products remain legal and advertising of these
products are allowed in almost all countries.
4.3.2 Epidemiology of cigarette smoking in India
WHO reported that currently about 300 million people in India are
cigarette smokers (age group more than 15 years) which include 50 million of
female users and 195 million of male users and 5 million in the age group
10-15 years.79 Global Adult Tobacco Survey [GATS, 2009-2010] reported that
36.6% of adults in the age group 15 years and above were tobacco smokers.
Another report by Global Youth Tobacco Survey [GYTS] 2010 on 25,000
44 | P a g e
users in India.80 Tobacco kills about 50 lakh people every year around the
world of which 15 lakh death accounts from India alone and around 56,000
children start using tobacco products everyday in India.81
People with low socio economic status, or with low education level or
having unskilled professions are more into smoking. For example, 45% of
persons with 8 to 10 years of education are smokers; when comparing with
13.4% of those who are having a college degree. If the current trends of
smoking remain the same, the burden from smoking is calculated to become
triple the number by 2025. These figures were informed in the recently
conducted WHO convention on Tobacco control (2012);82 that aims to
decrease both the demand and supply of tobacco throughout the globe through
political, educational, legislative, awareness and various other methods.
4.3.3 Historical Review
History of smoking into human civilization dates back to as early as
5000BC in American rituals. Smoking was practiced in any one form or
another from ancient periods. There are evidences that ancient great
civilizations like Babylonians, Indians and Chinese fumed incense as a part of
their religious rituals and it was continued as a religious practise among
Israelites in Catholic and Orthodox churches. After the arrival of Europeans in
America; during 16th century, the cultivation, consumption and marketing of
tobacco began to increase greatly. Later on it gained popularity among
45 | P a g e
Jean Nicot, a French tradesman (the word nicotine is taken from his
name) introduced tobacco products into France in 1560.
In India tobacco was introduced to the royal courts around 17th century
by Portuguese traders. But Cannabis smoking was popular from 2000 BC, and
is written in Atharvaveda. Fumigation, the dhupa and offerings, the homa
mentioned in Ayurveda, even for medical purposes; has been practiced for at
least 3000 years. Dhrunrapana (drinking smoke) was practiced for 2000 years
as mentioned in the early historical books.81
After Portuguese introduction of tobacco in 17th century; the reign of
British East India Company popularized tobacco as an economical crop and
encouraged its cultivation and trading in India.8
The actual production of tobacco on large scale was started by the
imperial Tobacco Company(1901) which is now known as Indian Tobacco
Company [ITC] Ltd. The foreign trade of tobacco started in 1910. Later beedi
was introduced and beedi factories flourished. Thus beedi became an important
tobacco consuming product pushing cigarettes behind in working class people
and common man. Chewing tobacco as smokeless tobacco was also very
popular earlier but it was overtaken by cigarettes in 20th century. Presently the
chewing tobacco is restricted to rural population in western countries but it has