Copyright © 2004, American Society for Microbiology. All Rights Reserved.
Global Analysis of Host Cell Gene Expression Late during
Cytomegalovirus Infection Reveals Extensive Dysregulation of Cell
Cycle Gene Expression and Induction of Pseudomitosis
Independent of US28 Function†
Laura Hertel and Edward S. Mocarski*
Department of Microbiology and Immunology, Stanford University School of Medicine, Stanford, California
Received 26 March 2004/Accepted 24 May 2004
Replication of human cytomegalovirus (CMV) depends on host cell gene products working in conjunction with viral functions and leads to a dramatic dysregulation of cell cycle gene expression. Comprehensive transcriptional profiling was used to identify pathways most dramatically modulated by CMV at late times during infection and to determine the extent to which expression of the viral chemokine receptor US28 contributed to modulating cellular gene expression. Cells infected with the AD169 strain of virus or a fully replication competent US28-deficient derivative (RV101) were profiled throughout the late phase of infection (50, 72, and 98 h postinfection). Although sensitive statistical analysis showed striking global changes in transcript levels in infected cells compared to uninfected cells, the expression of US28 did not contribute to these alterations. CMV infection resulted in lower levels of transcripts encoding cytoskeletal, extracellular matrix, and adhesion proteins, together with small GTPases and apoptosis regulators, and in higher levels of transcripts encoding cell cycle, DNA replication, energy production, and inflammation-related gene products. Surprisingly, a large number of cellular transcripts encoding mitosis-related proteins were upmodulated at late times in infection, and these were associated with the formation of abnormal mitotic spindles and the appearance of pseudomitotic cells. These data extend our understanding of how broadly CMV alters the regulation of host cell cycle gene products and highlight the establishment of a mitosis-like environment in the absence of cellular DNA replication as important for viral replication and maturation.
Human cytomegalovirus (CMV) infection has a dramatic impact on the cell that starts immediately after infection (4) and continues through late times (34, 67). The replication cycle follows a temporal cascade of events that depends upon both viral and host cell functions. Viral DNA replication begins between 14 and 24 h postinfection (hpi), and release of prog-eny starts between 36 and 48 hpi, reaching maximal levels between 72 and 96 hpi (67). This process causes profound changes in host cell shape, metabolism, and gene transcription, components of which are suspected to be critical for efficient replication. Previous studies in primary fibroblasts have re-vealed the global impact of viral infection on signaling and transcriptional changes that start as early as 15 min and last as long as 48 hpi (4, 16, 50, 51, 85, 112, 113). These studies have largely focused on the immediate impact of the virus on cells and have revealed a dramatic upmodulation of cellular inflam-matory and immune gene expression due to virus binding and penetration. Based on this work, selected cellular signaling events (51, 103) and cellular proteins (13, 89, 114) have been implicated as important regulators of infection. There has been a less concerted effort to understand the global impact of CMV infection at late times during infection (16), despite the fact
that maximal modulation would be expected at late times. Also, remarkably little information has been presented on the contribution of virus-encoded signaling proteins that are ex-pressed at late times, such as the CMV chemokine receptor US28.
CMV encodes at least four apparent seven transmembrane-spanning proteins (21, 42), pUL33, pUL78, pUS27, and pUS28, one of which (pUS28) is a G-protein-coupled receptor that binds a wide range of CC chemokines (9, 38, 56, 72, 100), as well as fractalkine/CX3CL1 (55). pUS28-mediated signaling
is both chemokine ligand dependent (38) and constitutive (19, 101) and stimulates mitogen-activated protein kinase extracel-lular-signal-regulated kinase 2, focal adhesion kinase 1, and Src (9, 19, 91, 101). pUS28-mediated signaling occurs in CMV-infected cells (9, 98), as well as in US28-transfected cells. US28 transcripts are readily detected by 24 hpi and continue to rise through late times when pUS28 scavenges chemokines from the infected cell culture fluid (12, 98). Although many of the US28 mutant viruses exhibit modest replication defects, US28 itself is completely dispensable for replication in cultured fi-broblasts (12, 98), as shown through studies on one viral mu-tant in particular, RV101 (12). The phenotypic consequences of signaling through this receptor during infection in fibro-blasts have not been investigated.
CMV infection of resting primary fibroblasts dysregulates expression of several genes encoding cell cycle regulators (34), such as the G2/M cyclin B (26); cell cycle checkpoint proteins,
such as p53 and pRb (49); and DNA replication effectors,
* Corresponding author. Mailing address: Department of Microbi-ology and ImmunMicrobi-ology, Stanford University School of Medicine, Stan-ford, CA 94305-5124. Phone: (650) 723-6435. Fax: (650) 723-1606. E-mail: mocarski@stanford.edu.
† Supplemental material for this article may be found at http://jvi .asm.org/.
11988
on November 8, 2019 by guest
http://jvi.asm.org/
including components and regulators of the prereplication complex (10, 107). Through the induction of these changes, CMV has long appeared to stimulate the generation of an intracellular environment similar to S phase based initially on cellular activation (4) while simultaneously inhibiting cellular DNA synthesis in a manner analogous to a G1/S block (34, 67).
The execution of these strategies presumably allows the virus to maximize the availability of cellular functions required for successful replication of the viral genome, to eliminate the competition from the cellular genome, and to avoid the onset of apoptosis.
We used cDNA microarrays to evaluate the impact of CMV infection, as well as the contribution of US28 expression, on cellular gene transcription in fibroblasts at late times postin-fection. We used a replication-competent US28 mutant virus, RV101 (12), to avoid contributions from adventitious muta-tions that are a common occurrence in CMV mutants (67). The levels of a large number of transcripts encoding functions in-volved in a wide range of cellular pathways were altered by infection, but none of these changes could be ascribed to US28 expression. The most remarkable findings revealed a substan-tial increase in the expression levels of mitochondrial genes, a considerable alteration in expression levels of multiple GTPase family members, and an intense dysregulation of cell cycle pathways that normally control mitosis. These latter changes were linked to the appearance of pathological mitosis in cul-ture and were likely part of a virus-induced strategy to enhance viral genome replication and virion maturation.
(These results were presented at the 9th International Cy-tomegalovirus Workshop and the First International Betaher-pesvirus Workshop in Maastricht, The Netherlands, on 20 to 25 May 2003.)
MATERIALS AND METHODS
Cells, viruses, and microarrays.Primary human foreskin fibroblasts (HFs) were cultured as described previously (23) and used between passage 15 and 17 postisolation. The human CMV strain AD169 obtained from the American Type Culture Collection (ATCC) has been denoted AD169varATCC (AD) to distin-guish it from other variants of this strain in current use (41, 87). The US27/US28 deletion mutant virus RV101 (RV) was made by using AD169varATCC by T. R. Jones (Wyeth-Ayerst Research, Pearl River, N.Y.) and exhibits growth charac-teristics indistinguishable from parental virus (12) that we independently con-firmed for the present study (data not shown). Microarrays were purchased from the Stanford Functional Genomics Facility (http://www.microarray.org/sfgf/jsp /home.jsp). About 85% of the spots printed on the polylysine-coated glass mi-croscope slides were from the I.M.A.G.E. consortium clones from the Research Genetics Sequence Verified clone set, 10% were from the Cancer Genome Anatomy Project clone set (http://www.ncbi.nlm.nih.gov/ncicgap), and 5% were from a set ofMethanococcus jannaschiicontrols. The batch of arrays (SHDB) used in the present study contained 41,792 total spots (39,781 unique and 2,011 repeated spots) representing 29,593 unique genes. After purchase, the microar-rays were postprocessed as described previously (http://derisilab.ucsf.edu/).
Cell infections.CMV was propagated at a multiplicity of infection (MOI) of 0.01 in confluent HFs and purified as described previously (23). For microarray analysis, HF monolayers plated at a density of 3⫻104cells/cm2in 850-cm2roller bottles were infected at confluency (day 5 postseeding) with purified virions (23) at an MOI of 10. After virus adsorption for 1 h at 37°C in 5% CO2, the inoculum was removed, and the cells were washed twice with culture medium prior to the addition of fresh medium. At 50, 72, and 98 hpi, infected monolayers were harvested, snap-frozen, and stored at⫺80°C until the time course was com-pleted. Uninfected confluent HF cultures were used as a reference. For all other analyses described here, HF monolayers were plated at a density of 5⫻104 cells/cm2on coverslips in 24-well plates 3 days before infection with purified AD virions at an MOI of 10. After virus adsorption for 1 h, cells were washed twice prior to the addition of fresh medium. For drug treatment, medium plus 300g
of phosphonoformic acid (PFA; Sigma, St. Louis, Mo.)/ml or medium plus 1 mM or 10 mM hydroxyurea (HU; Sigma) was added to the washed cells. Virus titers in the supernatant of wells treated with each of the drugs were determined by plaque assay and were consistent with previous reports (6, 99).
RNA isolation and microarray hybridization.mRNA was extracted by using the FastTrack 2.0 mRNA Isolation Kit (Invitrogen, Carlsbad, Calif.). Only RNA preparations reaching optical density at 260/280 nm (OD260/280) ratio values of
ⱖ2.0 were used. Labeled cDNA populations were synthesized from 2g of mRNA per sample by reverse transcription and simultaneous incorporation of Cy3-dUTP (reference sample, green) or Cy5-dUTP (infected samples, red) (Am-ersham Biosciences, Piscataway, N.J.) with an oligo-dT20primer and the Super-script II Reverse TranSuper-scriptase (Invitrogen). Reference and sample cDNA pop-ulations were mixed, and unincorporated nucleotides were removed by using a CyScribe GFX purification kit (Amersham Biosciences). Then, 5g of human Cot-1 DNA (Invitrogen), 20g of poly(A) RNA (Sigma), 20g of yeast tRNA (Invitrogen), 3.4⫻SSC (1⫻SSC is 0.15 M NaCl plus 0.015 M sodium citrate), and 0.3% sodium dodecyl sulfate were added to the probe prior to denaturation by heating at 100°C for 2 min and application on the arrays. Hybridization of two arrays per virus per time point (total of 12 arrays) were performed at 65°C for 16 to 18 h in a custom slide chamber with humidity maintained by a small reservoir of 3⫻SSC. The arrays were then washed as described previously (29) and scanned with a Gene Pix 4000A Scanner (Axon Instruments, Foster City, Calif.). Microarray data analysis.Array images were analyzed with the Gene Pix Pro 4.0 software and unreliable spots identified by visual inspection were marked with a “flag.” After submission to the Stanford Microarray Database (SMD; http: //genome-www.stanford.edu/microarray/), infected/uninfected ratio values were log2transformed, normalized by using the default normalization protocol of the SMD, and retrieved by spot number (so that no averaging of the ratio values from duplicate spots was performed). To eliminate spots of poor quality from subsequent analyses, spot data were filtered by applying three criteria: no flag, brightness (channel 1 [Cy-3] net mean and channel 2 [Cy-5] normalized net mean intensities) ofⱖ150 fluorescence units, and even distribution of color brightness across the whole spot area (regression correlation values ofⱖ0.6). Statistical analysis was performed by applying the one- or two-class (unpaired) response type of Significance Analysis of Microarrays (SAM), version 1.20 (http://www -stat.stanford.edu/⬃tibs/SAM/) (96), to three sets of four arrays each (at 50, 72, or 98 hpi) or one set of 10 arrays (50, 72, and 98 [50-72-98] hpi). The number of permutations was set to 24 (4-array sets) or to 300 (10-array set), and the random number seed was set to 94332998 (one class) or to 91797601 (two classes, unpaired). The lists of SAM significant spots generated by the one-class analysis of the 50-, 72-, and 98-hpi array sets were intersected with the list generated from the 50-72-98-hpi array set by using the I.M.A.G.E. number as spot identifier. The identity of SAM significant spots was obtained through the SOURCE database (http://source.stanford.edu; time of the analysis, April 2003) (25), and gene grouping in functional categories was performed according to information re-trieved from Online Mendelian Inheritance in Man (OMIM) and Medline da-tabases. Genes belonging to the same cellular subcompartments or functional pathways were assigned to a specific class within each category. This classification process brought genes having similar roles into close proximity within each category’s Excel spreadsheet (see information file S6 in the supplemental mate-rial), allowing us to immediately appreciate if they were part of extensive cellular pathways. Functional maps were generated by either modifying existing maps on the Gene Microarray Pathway Profiler (GenMAPP) website (http://www .genmapp.org/) or by creating new maps by using GenMAPP software (24) in combination with the Kyoto Encyclopedia of Genes and Genomes database (KEGG, http://www.genome.ad.jp/kegg/) and literature searches. Microarray im-ages and raw data are available on the SMD website, SAM analysis Excel files and functional grouping Excel files are included as six information files in the supplemental material.
Immunofluorescence analysis.For␥tubulin 1 (␥tub1) and immediate-early protein 1 and 2 (IE1/IE2) double staining, cells were fixed in cold methanol for 5 min at⫺20°C, permeabilized with 0.1% Triton X-100 in phosphate-buffered saline (PBS) for 20 min on ice, incubated in blocking buffer (1% fetal calf serum in PBS) for 10 min at room temperature, and stained with an anti-␥tub1 mono-clonal antibody (MAb; 1:10,000; clone GTU-88, Sigma), followed by a Texas red-conjugated goat anti-mouse antibody (1:100; Vector Laboratories, San Bruno, Calif.). After three washes with PBS, cells were incubated with normal mouse immunoglobulin G (1:10; Caltag, Burlingame, Calif.) for 30 min at room temperature before being stained with a fluorescein isothiocyanate (FITC)-conjugated anti-IE1/IE2 antibody (1:800; MAB810F; Chemicon, Temecula, Calif.). Cellular DNA was highlighted with Hoechst 44432 (Molecular Probes, Eugene, Oreg.). For ppUL44, pp150, and pUL43 staining, infected cells were fixed with 1% paraformaldehyde in PBS for 15 min at room temperature,
on November 8, 2019 by guest
http://jvi.asm.org/
meabilized, and blocked as described above and then stained with MAbs to ppUL44 (1:500; Goodwin Institute, Plantation, Fla.), pp150 (MAb 36-14), or pUL43 (MAb 20392), followed by an FITC-conjugated goat anti-mouse antibody (1:100; Vector Laboratories). Cellular DNA was highlighted with propidium iodide (Molecular Probes). For␥tub1 and bromodeoxyuridine (BrdU) double staining, cells were labeled with 50M BrdU (Sigma) for 1 h at 37°C with 5% CO2, washed with PBS, fixed with 1% paraformaldehyde for 30 min at room temperature, and incubated with 2 M HCl for 1 h at 37°C. Cells were then washed twice with borate buffer (pH 8.5) and three times with PBS, permeabil-ized, blocked, and stained with anti-␥tub1 and Texas red anti-mouse antibodies as before. After being washed, the cells were labeled with a FITC-conjugated anti-BrdU antibody (1:100; Molecular Probes) for 1 h at room temperature. Coverslips were mounted with FluoroGuard Antifade Reagent (Bio-Rad, Her-cules, Calif.) before being analyzed on an Olympus BX60 epifluorescence mi-croscope equipped with⫻60 or⫻100 phase-contrast objective lenses. Images were collected with a Hamamatsu ORCA-100 digital camera and Image Pro Plus 4.0 software (MediaCybernetics, Silver Spring, Md.). Digitized images were stored, electronically colorized, and overlaid for evaluation of two- and three-color experiments.
Transmission electron microscopy.Cells were fixed in 2% glutaraldehyde in PBS, postfixed with 1% osmium tetroxide for 1 h, blocked with 1% aqueous uranyl acetate, dehydrated through graded ethanol steps, and embedded in Poly/Bed (Polysciences). Thin sections (70 nm) were then prepared, stained with 1% uranyl acetate and 1% lead citrate, and viewed on a Phillips CM12 micro-scope.
RESULTS AND DISCUSSION
Trends in cellular gene expression at late times during CMV infection and impact of viral chemokine receptor expression.
To identify cellular genes modulated by CMV at late times postinfection, we compared the transcriptional profiles of HFs infected with either wild-type CMV strain AD169varATCC (AD) or RV101 (RV), a mutant virus derived from AD169var
ATCC exhibiting full replication potential despite the com-plete absence of US27 and US28 expression (12). We used this particular mutant to avoid potential contribution of adventi-tious mutations that appear to be carried in US28 mutants that exhibit growth defects. Transcriptional profiling was per-formed according to the scheme outlined in Fig. 1A. Cy5-labeled cDNAs from HFs infected with either AD or RV for 50, 72, or 98 h were combined with Cy3-labeled cDNA from confluent uninfected HFs used as a reference (29) and hybrid-ized to 12 replicate 42,000 spot human cDNA arrays. After normalization of the spot ratio values, usable data were se-lected according to an established set of filtering criteria (84). The percentage of qualified spots identified on each array ranged from 44 to 83%, with a mean of 65%⫾11% (Table 1). The data from replicate arrays were organized into four groups to facilitate analysis, three with the 4 arrays at 50, 72, or 98 hpi and one with the 12 arrays from the combined time points (50-72-98 hpi). Each group contained a common set of spots that passed filtering criteria on all arrays contained in that group. These sets consisted of 20,123 spots from the 50-hpi time point (48% of total spots), 14,856 (35%) spots from the 72-hpi time point, 21,940 (52%) spots from the 98 hpi-time point, and 11,942 (29%) spots from the combined 50-72-98-hpi time points. In order to maximize the usable data in the anal-ysis, two arrays containing⬍50% qualified spots (AD 72 hpi 1 and RV 72 hpi 1) were excluded from the combined time point group. In this way, 10 replicates composed the 50-72-98-hpi group, and this group had 14,126 (34% of total spots) qualified spots.
To identify genes significantly regulated at late times of
CMV infection, we applied SAM one-class analysis to the set of array replicas spanning a 50- to 98-hpi time course. This statistical procedure evaluates the consistency and certainty of gene expression patterns and has eclipsed simple fold-cutoff methods of analysis because it offers an assessment of signifi-cance of microarray data (96). Initially, SAM analysis was used to evaluate the combined 50-72-98-hpi set of 14,126 spots with the aim of identifying genes that were consistently modulated throughout late times of infection. Figure 1B (left) shows the plot generated by this analysis. Each datum point in this graph represented a comparison of the observed relative difference value (actual data) plotted against the chance relative differ-ence value (denoted as “expected” in the figure and calculated by permuting the data) for each spot in the set. The distribu-tion of the data along a sigmoidal curve revealed that the observed differences in the expression levels of a large number of genes greatly exceeded the differences expected by chance, with transcript levels showing the strong impact of viral infec-tion on host cells. We selected a conservative false discovery rate (FDR) value of 0.0045 for the combined 50-72-98-hpi data, which was the maximum stringency allowed and indicated that⬎99.996% of the differences we detected were authentic (see information file S1, FDR and delta values). A total of 5,658 of 14,126 spots, ⬎40% of the data set, were altered at late times, with 1,983 (14%) upmodulated and 3,675 (26%) downmodulated by viral infection (see information file S1, significant spots, in the supplemental material). This dramatic impact of virus infection was also observed when individual time points were analyzed, showing that a wide range of cel-lular genes were altered by CMV infection at late times during infection no matter how the analysis was completed. The FDR value for each set of arrays was always set to the most conser-vative value available for the size of the data set, 0.03 for 50-hpi data, 0.01 for 72-hpi data, and 0.01 for 98-hpi data (see infor-mation files S2, S3, and S4, FDR and delta values). This ap-proach yielded a ⬎99.97% likelihood that 1,595 spots across the four 50-hpi arrays, 3,177 spots across the four 72-hpi arrays, and 3,596 spots across the four 98-hpi arrays represented au-thentic changes based on maximally stringent analysis (see information files S2, S3 and S4, significant spots, in the sup-plemental material). Due to fewer replicates, the number of spots significantly altered by viral infection corresponded to 8, 21, and 16% of the qualified spots within the 50-, 72-, and 98-hpi data sets, respectively. More than 75% of the SAM-significant spots at any of the three late time points were contained in the combined 50-72-98-hpi set and thus exhibited similar levels of transcriptional change (increase or decrease) across all time points. Few SAM-significant spots (1% at 50 hpi, 3% at 72, and 3% at 98 hpi) showed altered levels at only one time point, due mostly to poor spot quality at other time points. Taken together, these statistical analyses all indicated that large numbers of cellular genes were significantly modu-lated by CMV infection over the period from 50 to 98 hpi.
Expression levels of US28, a signaling G-protein-coupled receptor, have been shown to be elevated at late times of infection (12). To evaluate the contribution of US28 signaling to the host cell response during the time of maximal expres-sion, we compared the transcriptional profiles of AD and RV virus-infected cells by using SAM two-class (unpaired) analy-sis. Given the consistency of changes at all late time points in
on November 8, 2019 by guest
http://jvi.asm.org/
FIG. 1. (A) Flow chart of microarray data generation and analysis. Cy5-labeled cDNA from infected HFs and Cy3-labeled cDNA from uninfected HFs were mixed and hybridized to replicate 42,000 spot human cDNA arrays to generate data that was normalized and filtered by the SMD and subjected to statistical analysis by SAM software. (B) SAM one-class analysis (left) and SAM two-class (unpaired) analysis (right) of the 14,126 data set from the combined 50-72-98-hpi time points. For each spot, the observed SAM score is plotted against the expected SAM score. The middle line intersecting the origin in each graph represents observed equals expected score values, whereas the additional lines define the upper and lower significance threshold specified by the lowest allowed FDR parameter (96). Significantly regulated spots are shaded gray. Gray spots in the upper right quadrant are upmodulated, and gray spots in the lower left panel are downmodulated. (C) Functional categories (right column) represented in the 1,983 SAM-significant upmodulated (white bars) and 3,675 SAM-significant downmodulated (gray bars) spots from the 50-72-98-hpi data set. The series of bars indicates the distribution of total spots (All spots), unnamed (All unknown spots), and named (All known genes), as well as the distribution of the named genes into functional groups based on their principle role according to the literature. Functional groups include soluble factors and cell surface receptors (Factors Receptor), cytoskeleton-extracellular matrix-adhesion (Cytosk-ECM-Adh), nucleic acid metabolism (Nucl Acid metab), protein metabolism (Protein metab), vesicles and intracellular transport (Vesicles transport), enzymes (Enzyme), transcription factors (Transcr factor), intracellular signaling (Signaling), cell cycle (Cell cycle), other (Other), GTPases (GTPase), lipid metabolism (Lipid metab), immune system (Imm system), and apoptosis (Apoptosis). The categories are ranked according to the total number of spots or genes in each (left column).
on November 8, 2019 by guest
http://jvi.asm.org/
[image:4.603.111.472.82.569.2]the combined data set, this method was initially applied to the 14,126 spot data set, comparing the results of the five replicate AD virus- and five replicate RV virus-infected cell arrays where⬎50% of spots were qualified. Figure 1B (right) shows the plot generated by this analysis. The distribution of the data fell along a line representing observed equals expected score values, with few deviations. This analysis showed that genes were not expressed differently in AD and RV virus-infected cells. No FDR values of⬍43 were available for this analysis, indicating that even spots appearing slightly outside the signif-icance threshold had a relatively high (43%) likelihood of being false (see information file S5, FDR and delta values, in the supplemental material). Thus, we concluded that these spots were unlikely to represent true positives and that cellular gene expression was not perceptively influenced by US27 or US28. A comparison of the transcriptional profiles generated by each virus at each time point, conducted by using two arrays per virus per time point, also failed to reveal any differences (data not shown). It is important to consider that the viruses we compared exhibited equivalent replication in HFs (12) and that previous studies (12, 90, 98) have used some US28 mutant viruses that exhibit a variety of growth defects that appear to be unrelated to the disruption of the US28 gene and US28 signal-ing (12). Growth defects may have been more important than US28 expression in some of the reported differences ascribed to US28. No matter how our data were analyzed, either with replicates from each time point or total combined AD and RV virus-infected cell arrays, a US28 mutant virus that retained normal growth properties did not impact the cellular transcrip-tional profile any differently than control virus.
Functional analysis of cellular gene expression at late times
of infection. Genes whose expression was altered by viral
infection in the combined 50-72-98-hpi data set relative to uninfected HFs were categorized according to functional ac-tivity, cellular localization site, or metabolic pathway. Accord-ing to the SOURCE database (http://source.stanford.edu; see Materials and Methods), 3,210 spots were found to represent 2,227 functionally characterized genes (983 spots were sented more than once on each array), with 2,448 spots repre-senting either expressed sequence tags (ESTs) or genes that had not been annotated. Based on known properties listed in SOURCE, as well as in literature searches, each gene was
assigned into one functional category shown in Fig. 1C (see information file S6 in the supplemental material). The five categories with the greatest numbers of genes, soluble factors and cell surface receptors (14%), cytoskeleton-extracellular matrix-adhesion (13%), nucleic acid metabolism (10%), pro-tein metabolism (10%), and vesicle and intracellular transport (9.6%) accounted for more than half of the genes whose ex-pression was altered by infection. Of the 2,227 functionally characterized genes, a smaller percentage (927; 42%) was upmodulated, and a greater percentage (1,300; 58%) was downmodulated. Genes belonging to most of the functional categories showed similar distributions; however, the cytoskel-eton-extracellular matrix-adhesion, vesicles and intracellular transport, GTPase, and apoptosis categories contained even greater percentages (ⱖ68%) of downmodulated genes, and the nucleic acid metabolism, enzyme, cell cycle, and immune sys-tem categories contained greater percentages of upmodulated genes (Fig. 1C). Our finding that 2,448 ESTs and 2,227 named genes out of a survey of ca. 14,000 host genes were modulated by CMV infection contrasts with a previous published analysis (16). Although past work focused on early times of infection comparing infectious virus and UV-inactivated virus particles, a dramatic drop in numbers of modulated genes from 900 to 650 was reported to occur between 24 and 48 hpi. Our prelim-inary analysis had revealed no such drop (S. Watanabe, M. B. Eisen, P. O. Brown, and E. S. Mocarski, Abstr. 24th Interna-tional Herpesvirus Workshop, Cambridge, abstr. 15.019, 1999). Comparison of previously published 48 hpi data (16) with the analysis reported here is difficult due to differences in the application of statistical analysis.
Relationships between the genes in a category were queried by using OMIM and literature searches. Genes within the same category showing similar transcriptional changes were often found to encode proteins that were functionally related and could be organized into classes within each category (see in-formation file S6, column class). Certain categories (cytoskel-eton-extracellular matrix-adhesion, GTPase, enzyme, cell cy-cle, and nucleic acid metabolism) contained a large proportion of genes in functional relationships that were diagrammed by using GenMAPP software in combination with the KEGG database. Although most of the maps were assembled by using the SAM-significant genes from the combined 50-72-98-hpi set, we added several SAM-significant genes from single time points when they were excluded from the combined set be-cause spots representing the gene did not qualify at other time points. We found that the pathways emerging from these anal-yses were more valuable than a list of genes to illustrate the impact of the virus on the host cell transcriptome during the late phase of infection. Gene maps are shown in Fig. 2 to 5. Being microarray-derived, all changes described in the present study refer exclusively to transcript levels. In addition to tran-scriptional changes, other cellular mechanisms affecting trans-lation, posttranslational modifications, protein stability, and activity affect the amount and functionality of the products of the genes displayed on the maps.
Cytoskeleton-, extracellular matrix-, and adhesion-related
genes. Expression of cytoskeleton-extracellular
[image:5.603.43.283.89.219.2]matrix-adhe-sion transcripts showed the greatest level of downmodulation of any category (Fig. 1 and Table 2). The 299 genes in this category were assigned to four classes, with 110 genes (37%)
TABLE 1. Number and percentage of spots passing the filtering criteria on each array
Slide print no. Slide name Good spots (n) Good spots (%)
SHDB 156 AD 50 hpi 1 29657 71
SHDB 154 AD 50 hpi 2 28860 69
SHDB 163 AD 72 hpi 1 20060 48a
SHDB 165 AD 72 hpi 2 26189 64
SHDB 167 AD 98 hpi 1 27774 66
SHDB 170 AD 98 hpi 2 27866 66
SHDB 157 RV 50 hpi 1 32131 77
SHDB 155 RV 50 hpi 2 27573 66
SHDB 164 RV 72 hpi 1 18458 44a
SHDB 166 RV 72 hpi 2 22045 53
SHDB 168 RV 98 hpi 1 29769 71
SHDB 169 RV 98 hpi 2 34657 83
aArrays with percentages of good spots of⬍50% that were excluded from the combined 50-72-98-hpi data set.
on November 8, 2019 by guest
http://jvi.asm.org/
TABLE 2. Statistically significant cytoskeleton-, extracellular matrix-, and adhesion-related genes consistently upmodulated (positive fold change) or downmodulated (negative fold change) across late times of infection
Category and full gene namea Gene designation Fold change Subclass Adhesion molecules
A disintegrin and metalloproteinase domain 12 (meltrin␣) ADAM12 ⫺2.3 Cell-cell A disintegrin and metalloproteinase domain 19 (meltrin) ADAM19 ⫺1.6 Cell-cell
Cadherin 11, type 2, OB-cadherin (osteoblast) CDH11 ⫺3.5 Cell-cell
Cadherin 12, type 2 (N-cadherin 2) CDH12 2.1 Cell-cell
Cadherin 13, H-cadherin (heart) CDH13 ⫺1.9 Cell-cell
Cadherin 2, type 1, N-cadherin (neuronal) CDH2 ⫺2.8 Cell-cell
Cadherin 5, type 2, VE-cadherin (vascular epithelium) CDH5 ⫺1.4 Cell-cell
CD164 antigen, sialomucin CD164 ⫺1.5 Cell-cell
CD33 antigen (gp67) CD33 ⫺1.6 Cell-cell
CD68 antigen CD68 ⫺2.1 Cell-cell
Discoidin domain receptor family, member 1 DDR1 1.7 Cell-cell
Fracture callus 1 homolog (rat) FXC1 ⫺2.1 Cell-cell
Myeloid/lymphoid or mixed-lineage leukemia; translocated to, 4 MLLT4 2 Cell-cell Myeloid/lymphoid or mixed-lineage leukemia; translocated to, 7 MLLT7 2.5 Cell-cell
Neogenin homolog 1 (chicken) NEO1 2.3 Cell-cell
Neural cell adhesion molecule 1 NCAM1 3.4 Cell-cell
Neural cell adhesion molecule 2 NCAM2 1.9 Cell-cell
Protein tyrosine phosphatase, receptor type, M PTPRM ⫺1.4 Cell-cell
Protocadherin 1 (cadherin-like 1) PCDH1 ⫺1.5 Cell-cell
Protocadherin5 PCDHB5 1.8 Cell-cell
Protocadherin␥subfamily C, 3 PCDHGC3 ⫺6.6 Cell-cell
Thrombospondin 1 THBS1 ⫺19.1 Cell-cell
Thrombospondin 2 THBS2 ⫺6.7 Cell-cell
Thrombospondin 3 THBS3 ⫺1.8 Cell-cell
Thy-1 cell surface antigen THY1 ⫺5.7 Cell-cell
CD44 antigen (homing function and Indian blood group system) CD44 ⫺6.9 Cell-matrix CD47 antigen (Rh-related antigen, integrin-associated signal CD47 ⫺1.4 Cell-matrix Similar to triple functional domain (PTPRF interacting) LOC115557 1.5 Cell-matrix
Integrin4-binding protein ITGB4BP ⫺1.9 Integrin
Integrin,␣1 ITGA1 ⫺1.3 Integrin
Integrin,␣2 (CD49B,␣2 subunit of VLA-2 receptor) ITGA2 ⫺7.3 Integrin Integrin,␣3 (antigen CD49C,␣3 subunit of VLA-3 receptor) ITGA3 ⫺1.8 Integrin Integrin,␣4 (antigen CD49D,␣4 subunit of VLA-4 receptor) ITGA4 ⫺3.2 Integrin Integrin,␣E (antigen CD103, human mucosal lymphocyte antigen 1) ITGAE 1.4 Integrin Integrin,␣V (vitronectin receptor,␣polypeptide, antigen CD51) ITGAV ⫺2.5 Integrin Integrin,1 (fibronectin receptor,polypeptide) ITGB1 ⫺6.2 Integrin
Integrin,5 ITGB5 ⫺1.6 Integrin
Integrin,8 ITGB8 ⫺3.7 Integrin
Integrin,-like 1 (with EGF-like repeat domains) ITGBL1 ⫺1.4 Integrin
LIM and senescent cell antigen-like domains 1 LIMS1 ⫺3.2 Integrin
Transmembrane 4 superfamily member 2 TM4SF2 2 Integrin
Transmembrane 4 superfamily member 7 TM4SF7 ⫺2.1 Integrin
Armadillo repeat gene deletes in velocardiofacial syndrome ARVCF 1.6 Adherens junctions
Ems1 sequence EMS1 ⫺1.6 Adherens junctions
Bullous pemphigoid antigen 1, 230/240 kDa BPAG1 ⫺2.1 Desmososme junctions
Breast cancer anti-estrogen resistance 1 BCAR1 ⫺1.4 Focal junctions
Paxillin PXN ⫺2.4 Focal junctions
Protein tyrosine kinase 2 PTK2B 1.8 Focal junctions
Gap junction protein,␣1, 43 kDa (connexin 43) GJA1 ⫺2.4 Gap junctions
Gap junction protein,␣7, 45 kDa (connexin 45) GJA7 ⫺1.5 Gap junctions
Gap junction protein,3, 31 kDa (connexin 31) GJB3 2 Gap junctions
Angiomotin like 1 AMOTL1 ⫺1.6 Tight junctions
Angiomotin like 2 AMOTL2 ⫺2.1 Tight junctions
Claudin 3 CLDN3 ⫺2.9 Tight junctions
Claudin 4 CLDN4 ⫺3.1 Tight junctions
Claudin 8 CLDN8 1.6 Tight junctions
Junctional adhesion molecule 1 JAM1 ⫺3 Tight junctions
Activated leukocyte cell adhesion molecule ALCAM ⫺1.4
Catenin (cadherin-associated protein),␦2 CTNND2 ⫺1.6
CD151 antigen CD151 ⫺2.5
Cerebral cell adhesion molecule LOC51148 ⫺1.9
Cysteine and histidine-rich domain (CHORD)-containing 1 CHOROC1 ⫺1.6
FAT tumor suppressor homolog 1 (Drosophila) FAT ⫺2.4
Heparan sulfate proteoglycan 2 (perlecan) HSPG2 ⫺1.9
Immunoglobulin superfamily containing leucine-rich repeat ISLR ⫺2.2
KiSS-1 metastasis-suppressor KISS1 ⫺1.4
L1 cell adhesion molecule L1CAM ⫺1.5
Mesothelin MSLN 1.6
Neurexin 2 NRXN2 4.9
Neurofascin NFASC ⫺1.5
Ninjurin 2 NINJ2 1.4
Poliovirus receptor PVR ⫺1.4
Syndecan 1 SDC1 ⫺2.2
Continued on following page
on November 8, 2019 by guest
http://jvi.asm.org/
TABLE 2—Continued
Category and full gene namea Gene designation Fold change Subclass
Syndecan 3 (N-syndecan) SDC3 ⫺2.6
Transforming growth factor,-induced, 68 kDa TGFBI ⫺5.4
Trophinin associated protein (tastin) TROAP 2.5
Type I transmembrane protein Fn14 FN14 ⫺2.9
TYRO3 protein tyrosine kinase TYRO3 1.6
Vinculin VCL ⫺2
Extracellular matrix
Collagen, type I,␣1 COL1A1 ⫺6.5 Collagen
Collagen, type I,␣2 COL1A2 ⫺7.7 Collagen
Collagen, type III,␣1 (Ehlers-Danlos syndrome type IV) COL3A1 ⫺13 Collagen
Collagen, type IV,␣1 COL4A1 ⫺8.7 Collagen
Collagen, type IV,␣2 COL4A2 ⫺3.5 Collagen
Collagen, type IV,␣5 (Alport syndrome) COL4A5 1.3 Collagen
Collagen, type IV,␣6 COL4A6 ⫺1.5 Collagen
Collagen, type IX,␣2 COL9A2 1.9 Collagen
Collagen, type V,␣1 COL5A1 ⫺3.9 Collagen
Collagen, type V,␣2 COL5A2 ⫺2.2 Collagen
Collagen, type V,␣3 COL5A3 ⫺2.2 Collagen
Collagen, type VI,␣1 COL6A1 ⫺10.4 Collagen
Collagen, type VI,␣2 COL6A2 ⫺4.2 Collagen
Collagen, type VI,␣3 COL6A3 ⫺25.6 Collagen
Collagen, type VII,␣1 COL7A1 ⫺5.6 Collagen
Collagen, type VIII,␣2 COL8A2 1.4 Collagen
Collagen, type XI,␣2 COL11A2 1.7 Collagen
Collagen, type XII,␣1 COL12A1 ⫺3 Collagen
Collagen, type XIV,␣1 (undulin) COL14A1 ⫺2.6 Collagen
Collagen, type XV,␣1 COL15A1 ⫺2.8 Collagen
Collagen, type XVI,␣1 COL16A1 ⫺6.4 Collagen
Procollagen (type III) N-endopeptidase PCOLN3 1.9 Collagen
Procollagen C-endopeptidase enhancer PCOLCE ⫺2.9 Collagen
Procollagen-lysine, 2-oxoglutarate 5-dioxygenase 2 PLOD2 ⫺2 Collagen
Procollagen-lysine, 2-oxoglutarate 5-dioxygenase PLOD ⫺2.4 Collagen
Procollagen-lysine, 2-oxoglutarate 5-dioxygenase 3 PLOD3 ⫺1.8 Collagen
Procollagen-proline, 2-oxoglutarate 4-dioxygenase␣I P4HA1 ⫺4 Collagen
Procollagen-proline, 2-oxoglutarate 4-dioxygenase␣II P4HA2 ⫺2.9 Collagen
Procollagen-proline, 2-oxoglutarate 4-dioxygenase P4HB ⫺2 Collagen
Serine (or cysteine) proteinase inhibitor, clade H, member 2 SERPINH2 ⫺5.6 Collagen A disintegrin-like and metalloprotease with thrombospondin type 1 motif ADAMTS1 ⫺11.4 Enzyme A disintegrin-like and metalloprotease with thrombospondin type 1 motif ADAMTS2 ⫺2.5 Enzyme
Exostoses (multiple) 1 EXT1 ⫺4 Enzyme
Fibroblast activation protein,␣ FAP ⫺3.3 Enzyme
Glucosamine (N-acetyl)-6-sulfatase (Sanfilippo disease IIID) GNS ⫺1.6 Enzyme
Glucoronidase, GUSB 1.8 Enzyme
Heparan sulfate (glucosamine) 3-O-sulfotransferase 3A1 HS3ST3A1 ⫺2.8 Enzyme Heparan sulfate (glucosamine) 3-O-sulfotransferase 3B1 HS3ST3B1 ⫺4.2 Enzyme
Heparan sulfate (glucosamine) 3-O-sulfotransferase 4 HS3ST4 ⫺2.2 Enzyme
Heparan sulfate 2-O-sulfotransferase 1 HS2ST1 ⫺1.4 Enzyme
Heparan sulfate 6-O-sulfotransferase 1 HS6ST1 2.2 Enzyme
Hyaluronan synthase 2 HAS2 ⫺1.4 Enzyme
Duronidase,␣-L IDUA 3.5 Enzyme
Lysyl oxidase LOX ⫺11.4 Enzyme
Lysyl oxidase-like 1 LOXL1 ⫺2.4 Enzyme
Lysyl oxidase-like 2 LOXL2 ⫺3.4 Enzyme
N-Deacetylase/N-sulfotransferase (heparan glucosaminyl) 1 NDST1 ⫺2.7 Enzyme Suppression of tumorigenicity 14 (colon carcinoma, matriptase, epithin) ST14 1.5 Enzyme
Uronyl-2-sulfotransferase UST ⫺3.5 Enzyme
Xylosylprotein1,4-galactosyltransferase, polypeptide 7 B4GALT7 ⫺1.3 Enzyme
Basigin (OK blood group) BSG ⫺1.4 MMP
Matrix metalloproteinase 1 (interstitial collagenase) MMP1 ⫺1.5 MMP
Matrix metalloproteinase 11 (stromelysin 3) MMP11 ⫺1.8 MMP
Matrix metalloproteinase 17 (membrane inserted) MMP17 1.5 MMP
Matrix metalloproteinase 2 (gelatinase A) MMP2 ⫺5 MMP
Matrix metalloproteinase 24 (membrane inserted) MMP24 ⫺1.8 MMP
Matrix metalloproteinase 3 (stromelysin 1, progelatinase) MMP3 ⫺5.2 MMP
Reversion-inducing-cysteine-rich protein with kazal motifs RECK ⫺5.9 MMP
Tissue inhibitor of metalloproteinase 1 TIMP1 ⫺3.1 MMP
Tissue inhibitor of metalloproteinase 2 TIMP2 ⫺5.9 MMP
Tissue inhibitor of metalloproteinase 3 TIMP3 ⫺13.7 MMP
Biglycan BGN ⫺3
Capillary morphogenesis protein 2 CMG2 ⫺1.7
Cartilage associated protein CRTAP ⫺3.3
Cartilage linking protein 1 CRTL1 ⫺1.7
Cartilage oligomeric matrix protein COMP ⫺1.8
Chondroitin sulfate proteoglycan 6 (bamacan) CSPG6 1.7
Continued on facing page
on November 8, 2019 by guest
http://jvi.asm.org/
TABLE 2—Continued
Category and full gene namea Gene designation Fold change Subclass
Decorin DCN ⫺1.5
Dermatan sulfate proteoglycan 3 DSPG3 1.3
EGF-containing fibulin-like extracellular matrix protein 1 EFEMP1 ⫺1.7 EGF-containing fibulin-like extracellular matrix protein 2 EFEMP2 ⫺5.4 Fibrillin 2 (congenital contractural arachnodactyly) FBN2 ⫺5.8
Fibronectin 1 FN1 ⫺19.7
Fibulin 1 FBLN1 ⫺3.6
Fibulin 2 FBLN2 ⫺4.3
Glypican 1 GPC1 ⫺3
Inter-␣(globulin) inhibitor H4 ITIH4 1.9
Laminin receptor 1 (ribosomal protein SA, 67 kDa) LAMR1 ⫺1.7
Laminin,␣4 LAMA4 ⫺4.7
Laminin,1 LAMB1 ⫺1.7
Laminin,␥1 (formerly LAMB2) LAMC1 ⫺9
Lumican LUM ⫺21
Matrix Gla protein MGP ⫺4
Microfibril-associated glycoprotein-2 MAGP2 ⫺3
Microfibrillar-associated protein 4 MFAP4 ⫺1.6
Mucin 4, tracheobronchial MUC4 1.4
Proline arginine-rich end leucine-rich repeat protein PRELP ⫺4.3 Secreted protein, acidic, cysteine-rich (osteonectin) SPARC ⫺14.5 Serine (or cysteine) proteinase inhibitor, clade E, member 2 SERPINE2 ⫺10.9 Sparc/osteonectin, cwcv and kazal-like domains proteoglycan (testican) SPOCK ⫺3.3
Surfactant, pulmonary-associated protein B SFTPB ⫺2.3
Tenascin C (hexabrachion) TNC ⫺11.3
Tissue factor pathway inhibitor 2 TFPI2 ⫺1.7
Trefoil factor 1 TFF1 ⫺1.5
Tuftelin 1 TUFT1 1.8
Major cytoskeletal fiber
Intermediate filament protein syncoilin SYNCOILIN ⫺1.6 Intermediate filaments
Keratin 13 KRT13 1.7 Intermediate filaments
Keratin 18 KRT18 1.6 Intermediate filaments
Keratin 19 KRT19 ⫺6.4 Intermediate filaments
Keratin 5 KRT5 1.6 Intermediate filaments
Keratin, hair, basic, 5 KRTHB5 1.5 Intermediate filaments
Keratin, hair, basic, 6 (monilethrix) KRTHB6 1.7 Intermediate filaments
Neurofilament 3 (150-kDa medium) NEF3 1.7 Intermediate filaments
Periplakin PPL 2 Intermediate filaments
Plectin 1, intermediate filament-binding protein, 500 kDa PLEC1 ⫺4.8 Intermediate filaments
Vimentin VIM ⫺6.2 Intermediate filaments
Actin binding LIM protein 1 ABLIM1 1.6 Microfilaments actin
Actin filament-associated protein AFAP ⫺2.4 Microfilaments actin
Actin-related protein 2/3 complex, subunit 1A, 41 kDa ARPC1A ⫺1.6 Microfilaments actin Actin-related protein 2/3 complex, subunit 1B, 41 kDa ARPC1B ⫺2.4 Microfilaments actin Actin-related protein 2/3 complex, subunit 4, 20 kDa ARPC4 ⫺2.1 Microfilaments actin Actin-related protein 2/3 complex, subunit 5, 16 kDa ARPC5 ⫺2 Microfilaments actin
Actin,␣2, smooth muscle, aorta ACTA2 ⫺4.8 Microfilaments actin
Actin, ACTB ⫺4.4 Microfilaments actin
Actin,␥2, smooth muscle, enteric ACTG2 ⫺3.5 Microfilaments actin
Actinin,␣4 ACTN4 ⫺2 Microfilaments actin
Adducin 2 () ADD2 1.7 Microfilaments actin
Adducin 3 (␥) ADD3 ⫺1.9 Microfilaments actin
B-cell CLL/lymphoma 7A BCL7A 1.5 Microfilaments actin
Calcium/calmodulin-dependent serine protein kinase (MAGUK family) CASK ⫺1.6 Microfilaments actin
Caldesmon 1 CALD1 ⫺7 Microfilaments actin
Calponin 2 CNN2 ⫺2.7 Microfilaments actin
Calponin 3, acide CNN3 ⫺3.3 Microfilaments actin
Capping protein (actin filament) muscle Z-line,␣1 CAPZA1 ⫺2.2 Microfilaments actin
CD2-associated protein CD2AP 1.9 Microfilaments actin
Chaperonin containing TCP1, subunit 4 (␦) CCT4 2 Microfilaments actin
Chaperonin containing TCP1, subunit 8 (t) CCT8 1.7 Microfilaments actin
Coactosin-like 1 (Dictyostelium) COTL1 ⫺2.8 Microfilaments actin
Coronin, actin-binding protein, 1A CORO1A 2.3 Microfilaments actin
Coronin, actin-binding protein, 1C CORO1C ⫺2.3 Microfilaments actin
Drebin 1 DBN1 ⫺1.5 Microfilaments actin
Enabled homolog (Drosophila) ENAH ⫺3 Microfilaments actin
FERM, RhoGEF (ARHGEF) and pleckstrin domain protein 1 FARP1 ⫺2.5 Microfilaments actin
Filamin A,␣(actin-binding protein 280) FLNA ⫺3.1 Microfilaments actin
Filamin C,␥(actin-binding protein 280) FLNC ⫺2.8 Microfilaments actin
Gelsolin (amyloidosis, Finnish type) GSN ⫺1.5 Microfilaments actin
LIM and SH3 protein 1 LASP1 ⫺1.8 Microfilaments actin
Microtubule-actin crosslinking factor 1 MACF1 ⫺1.8 Microfilaments actin
Moesin MSN ⫺3 Microfilaments actin
Nebulin NEB ⫺1.8 Microfilaments actin
Continued on following page
on November 8, 2019 by guest
http://jvi.asm.org/
encoding major cytoskeletal fibers, 96 genes (32%) encoding extracellular matrix components, 79 genes (26%) encoding cell adhesion molecules, and 14 genes (5%) encoding miscellane-ous cytoskeletal gene products. A very high proportion (84%) of transcripts encoding extracellular matrix-related gene prod-ucts, including 30 encoding collagens and collagaltering
[image:9.603.49.537.83.638.2]en-zymes, 20 encoding extracellular matrix-modifying enen-zymes, and 11 encoding matrix metalloproteinases (MMP) or associ-ated regulators, were consistently downmodulassoci-ated by viral in-fection, with seven types of collagens, fibronectin 1, laminin␣4 and ␥1, MMP2, MMP3, and two tissue inhibitors of metallo-proteinases (TIMP2 and 3) among the transcripts reduced
TABLE 2—Continued
Category and full gene namea Gene designation Fold change Subclass
Plastin 3 (T isoform) PLS3 ⫺4 Microfilaments actin
Sarcoglycan,ε SGCE ⫺1.8 Microfilaments actin
Singed-like (fascin homolog, sea urchin) (Drosophila) SNL ⫺2.1 Microfilaments actin
Smoothelin SMTN ⫺1.9 Microfilaments actin
Talin 1 TLN1 ⫺3.7 Microfilaments actin
Transgelin TAGLN ⫺21.8 Microfilaments actin
Tripartite motif-containing 2 TRIM2 ⫺1.7 Microfilaments actin
Tropomodulin 3 (ubiquitous) TMOD3 ⫺1.8 Microfilaments actin
Tropomyosin 2 () TPM2 ⫺6.1 Microfilaments actin
Tropomyosin 4 TPM4 ⫺5.3 Microfilaments actin
Villin 2 (ezrin) VIL2 2.6 Microfilaments actin
WAS protein family, member 2 WASF2 ⫺1.3 Microfilaments actin
WD repeat domain 1 WDR1 ⫺1.4 Microfilaments actin
Wiskott-Aldrich syndrome-like WASL 2.4 Microfilaments actin
Lethal giant larvae homolog 1 (Drosophila) LLGL1 2 Microfilaments myosin
Myomesin (M protein) 2, 165 kDa MYOM2 1.3 Microfilaments myosin
Myosin IB MYO1B ⫺1.5 Microfilaments myosin
Myosin IE MYO1E ⫺1.4 Microfilaments myosin
Myosin IXB MYO9B ⫺2 Microfilaments myosin
Myosin regulatory light chain interacting protein MIR 1.3 Microfilaments myosin
Myosin X MYO10 ⫺3 Microfilaments myosin
Myosin, heavy polypeptide 11, smooth muscle MYH11 1.7 Microfilaments myosin
Myosin, heavy polypeptide 9, nonmuscle MYH9 ⫺3.3 Microfilaments myosin
Myosin, light polypeptide 6, alkali, smooth muscle and nonmuscle MYL6 ⫺1.6 Microfilaments myosin
Myosin, light polypeptide 9, regulatory MYL9 ⫺4.5 Microfilaments myosin
Myosin, light polypeptide kinase MYLK ⫺3.6 Microfilaments myosin
Protein phosphatase 1, regulatory (inhibitor) subunit 12A PPP1R12A ⫺1.8 Microfilaments myosin Protein phosphatase 1, regulatory (inhibitor) subunit 12B PPP1R12B ⫺3.2 Microfilaments myosin Protein phosphatase 1, regulatory (inhibitor) subunit 14C PPP1R14C ⫺2.1 Microfilaments myosin Protein phosphatase 1, regulatory (inhibitor) subunit 2 PPP1R2 ⫺1.7 Microfilaments myosin
␣-Tubulin-like MGC16703 1.4 Microtubules
Cyclin-dependent kinase 5 CDK5 2.3 Microtubules
Cyclin-dependent kinase 5, regulatory subunit 1 (p35) CDK5R1 2.1 Microtubules Cyclin-dependent kinase 5, regulatory subunit 2 (p39) CDK5R2 2.2 Microtubules
Cytoplasmic linker 2 CYLN2 ⫺2 Microtubules
Dynactin 1 (p150, glued homolog,Drosophila) DCTN1 ⫺1.5 Microtubules
Dynactin 4 (p62) DCTN4 ⫺1.9 Microtubules
Dynein light chain 2 Dlc2 1.6 Microtubules
Dynein, cytoplasmic, light intermediate polypeptide 2 DNCL12 ⫺1.6 Microtubules
Echinoderm microtubule-associated protein like 1 EML1 ⫺2.9 Microtubules
Echinoderm microtubule-associated protein like 2 EML2 ⫺1.5 Microtubules
Echinoderm microtubule-associated protein like 4 EML4 2.4 Microtubules
Gephyrin GPHN 1.4 Microtubules
Katanin p60 (ATPase-containing) subunit A1 KATNA1 1.4 Microtubules
Katanin p80 (WD40-containing) subunit B1 KATNB1 1.8 Microtubules
Kinesin 2, 60/70 kDa KNS2 ⫺1.6 Microtubules
Kinesin family member 13B KIF13B 1.9 Microtubules
Kinesin family member 1C KIF1C ⫺1.9 Microtubules
Kinesin family member 3B KIF3B ⫺1.7 Microtubules
Kinesin family member 4A KIF4A 2.2 Microtubules
Kinesin-like 5 (mitotic kinesin-like protein 1) KNSL5 1.5 Microtubules
Kinesin-like 6 (mitotic centromere-associated kinesin) KNSL6 1.4 Microtubules
MAP/microtubule affinity-regulating kinase 3 MARK3 ⫺1.5 Microtubules
Microtubule-associated protein 1A MAP1A ⫺2.2 Microtubules
Microtubule-associated protein 4 MAP4 ⫺3.4 Microtubules
Microtubule-associated protein tau MAPT 1.7 Microtubules
Microtubule-associated protein, RP/EB family, member 3 MAPRE3 ⫺1.5 Microtubules
Phosphoprotein enriched in astrocytes 15 PEA15 ⫺2.6 Microtubules
Similar to kinesin light-chain KLCt LOC147700 ⫺1.6 Microtubules
Stathmin 1/oncoprotein 18 STMN1 2.6 Microtubules
Transforming, acidic coiled-coil-containing protein 1 TACC1 ⫺1.7 Microtubules
Tubulin,5 TUBB-5 ⫺2.2 Microtubules
Tubulin,4 TUBB4 ⫺1.7 Microtubules
Tubulin,␥1 TUBG1 1.6 Microtubules
Tubulin-specific chaperone c TBCC 2.2 Microtubules
aGenes are listed in alphabetical order within each subclass.
on November 8, 2019 by guest
http://jvi.asm.org/
⬎10-fold (Table 2). Three-quarters of the genes encoding cell adhesion molecules, including 28 mediators of cell-cell and cell-matrix adhesion, 14 integrin subunits, and 15 components of various kinds of junctions, were suppressed by infection, with two thrombospondins (THBS1 and -2), integrin 1, and integrin␣2 among the transcripts reduced⬎5-fold (Table 2). Two-thirds of the genes in the major cytoskeletal fiber class, including 64 microfilament-related genes, 35 microtubule-re-lated genes, and 11 intermediate filament-remicrotubule-re-lated genes, were also markedly reduced during infection, with transgelin, cal-desmon 1, vimentin, and two tropomyosins (TPM2 and -4) among the transcripts reduced⬎5-fold (Table 2).
Forty-one genes from this category were assembled in a gene map that depicts the downmodulation of signaling pathways linking integrins to the actin cytoskeleton by viral infection (Fig. 2). Expression levels of 6 of 18 (33%) known integrin␣
subunits (␣1, ␣2, ␣3, ␣4, ␣E, and␣V) and of 4 of 8 (50%) known integrinsubunits (1,4,5, and8) were altered by infection: eight subunits were consistently downmodulated, whereas two (␣E and4) were upmodulated. These data re-vealed a major negative impact of infection on mediators of cell-extracellular matrix attachment, a finding consistent with the virus-induced decline in the substrate adhesion properties of the infected cell (3, 104). In agreement with this notion, several genes encoding integrin-binding partners, such as fi-bronectin, laminins, and collagens, as well as genes encoding the major focal adhesion-localized proteins vinculin,␣-actinin 4, talin 1, and paxillin, were strongly downmodulated. In ad-dition, three main members of the rho family of GTPases that control the formation of stress fibers and focal adhesions (rhoA), lamellipodia (rac1), and filopodia (cdc42), together with eight mediator proteins linking these GTPases to the actin
modifying proteins (PAK2 and PAK3, ROCK1, LIMK1, phos-phatidylinositol-4-phosphate 5-kinase [PI(4)P5K], WASP fam-ily verprolin-homologous protein 2 [WAVE2], and myosin light chain phosphatase [MYPT] regulatory subunits 1 and 2), were also downmodulated. Thus, expression of a broad range of integrin-to-actin bridging gene products appeared to be negatively impacted by infection, a finding consistent with a broad disruption of integrin binding and signaling responses during infection. Most actin modifiers, which are the targets of integrin signaling, including filamin A and C, gelsolin, trans-gelin, moesin, the capping protein muscle Z line␣1 (capZ␣1), four of the six subunits composing the actin-related protein 2/3 complex (arp1A, -1B, -4, and -5), and the assembler of the spectrin-actin lattice, adducin 3, were consistently downmodu-lated, together with the regulatory type of myosin light chain (i.e., MLC2) controlling the assembly of actin-myosin fila-ments, two calponin 1 homologs (calponins 2 and 3), and four actomyosin regulatory proteins (tropomyosins 2 and 4, tropo-modulin 3, and caldesmon). Finally, transcripts for three of the six known actin isoforms were also downmodulated by infec-tion.
[image:10.603.51.539.77.243.2]These findings demonstrated that the genes encoding pro-teins involved in the assembly and disassembly of actin fibers were downmodulated by CMV at late times. Such changes, along with a similar impact on all three major rho family GTPases and their downstream effectors, are likely to disrupt the organization of the cytoplasmic microfilaments and to strongly impair the formation of stress fibers, filopodia, and lamellipodia, eventually leading to the rounded, enlarged cell cytopathic effect observed at late times of infection. The same alterations, combined with the reduction in cellular adhesion transcript levels, would also predictably affect the potential for
FIG. 2. GenMAPP of virus-induced gene expression changes affecting integrin subunits, integrin-to-actin signaling pathways, and actin cytoskeleton. This map was generated by using the “integrin-mediated cell adhesion” KEGG pathway as a template. Genes (abbreviated names based on SwissProt accession number) are shown in boxes (see Materials and Methods for website and other information files). The map also includes two genes from the signaling category (the phosphatidylinositol-3-kinase subunits p110 [PI3K p110] and p55 [PI3K p55]) and eight genes from the GTPase category (rhoA, rac1, cdc42, rho-associated coiled-coil containing protein kinase 1 [ROCK1], LIM motif-containing protein kinase 1 [LIMK1], and p21-activated kinases 2 [PAK 2], 3 [PAK 3], and 6 [PAK 6]). Genes represented by more than one spot in the SAM-generated list are shown in a dashed box. Genes consistently upmodulated are bright orange, genes consistently downmodulated are green, genes not found in any of the data sets are uncolored, and one gene, which scored as SAM significantly upmodulated at one time (integrin4 was upmodulated in the 98 hpi data set), is light orange. The mean fold change (calculated by SAM) is noted to the right of each box, with positive values indicating upmodulation and negative values indicating downmodulation. The two dashed parallel lines indicate the plasma membrane. Solid arrows denote proximal events, and dashed arrows denote distal processes in the pathways shown. MLC, myosin light chain.
on November 8, 2019 by guest
http://jvi.asm.org/
infected cells to migrate, weakening GTPase-mediated mech-anisms on one hand and diminishing adhesiveness on the other hand.
GTPases and related genes. Transcripts encoding GTPase
category gene products involved in vesicle transport were also strongly downmodulated and extended beyond those functions involved in integrin-to-actin signaling (Fig. 3). The 112 genes in this category were assigned to one of six classes, with 32 genes (29%) encoding rho-related proteins, 26 genes (23%) encod-ing rab-related proteins, 17 genes (15%) encodencod-ing ras-related proteins, 16 genes (14%) encoding G-protein-related proteins, 14 genes (12.5%) encoding arf-related proteins, and seven genes (6%) encoding ran-related proteins. Forty-nine of these were assembled in the map, which depicts the main members of the six major GTPase families. Expression levels of 11 main G-protein family members were altered by infection, with eight subunits, including two G␣subunits (G␣i2 and -12), three G
subunits (G1, -4, and -2-like), and three G␥subunits (G␥10, -11, and -12), consistently downmodulated. Three G␣subunits (G␣olf, G␣13, and G␣14) showed upmodulation. Heterotri-meric G proteins play an important role in transducing signals derived from the activation of cell surface receptors by various hormones, neurotransmitters, chemokines, and sensory stim-uli. Based on the observed downmodulation of most G␣and all G and G␥transcripts that scored in the analysis, we would predict that the sensitivity of infected cells to signals conveyed via G-protein-coupled receptors would be reduced. This down-modulation may contribute to the failure of pUS28 to have a detectable impact on host gene expression at late times of infection.
Expression levels of nine ras family members were altered: seven (R-ras2/TC21, R-ras3/M-ras, ralB, rap1A, ragA, ragB, and GEM/KIR) were consistently downmodulated, and two (K-ras and rasD) were consistently upmodulated (Fig. 3). Ras family proteins are part of complex signaling networks,
con-trolling cellular proliferation and survival, vesicle trafficking, cytoskeletal organization, and integrin function. The observed persistent downmodulation of multiple ras family members would be predicted to impair these cellular functions. In par-ticular, the downmodulation of R-ras2/TC21 and rap1A, which have been shown to be potent activators of integrins in fibro-blasts (54), was consistent with a broad inhibitory effect on integrin functions, in remarkable agreement with the loss-of-adhesion phenotype observed with the cytoskeleton-extracel-lular matrix-adhesion-related genes. The expression levels of nine major representatives of the rho family were modified during infection: eight (rhoA, rhoB, rhoC, rac1, cdc42, TC10B/ rhoJ, rhoI, and rnd3/rhoE) were downmodulated, and one (rnd2/rhoN) was upmodulated. Although rhoB, rhoC, and TC10B/rhoJ regulate the assembly of focal adhesions and actin stress fibers in a way similar to rhoA, the rnd proteins rnd1, rnd2, and rnd3 control rounding of cells by counteracting some of the rhoA-regulated responses (74, 106). Consistent with the results obtained from the analysis of the cytoskeleton-extracel-lular matrix-adhesion category, the upmodulation of rnd2, to-gether with the downmodulation of rhoB, rhoC, and TC10B/ rhoJ, pointed toward the destabilization of adhesion structures and the rounding of the infected cell. Expression levels of 25 genes encoding main representatives of the two GTPase fam-ilies involved in intracellular control of vesicle trafficking, the arf and the rab families, were also modified in infected cells (Fig. 3). Five of these genes encoded arf family members: two (arf6 and arl1) were consistently downmodulated, and three (arl3, arl4, and arl8) were upmodulated. Arl1 helps maintain normal Golgi body architecture (61) and, together with arl3, may interact with vesicle-tethering factors associated with the Golgi apparatus (75). The modification of arl1 and arl3 expres-sion levels in the infected cell could indicate a viral strategy to exploit Golgi function for processing viral glycoproteins and for virion envelopment (28, 47). The persistent
downmodula-FIG. 3. GenMAPP of virus-induced gene expression changes affecting functions involved in vesicular traffic, including members of the G protein, ras, rho, rab, arf, and ran families of GTPases. Family names are typed in red, and the principal subcellular system controlled by each family is listed underneath. Members belonging to each family are grouped by braces (}). The same scheme shown in Fig. 2 is used with the addition of one gene, which scored as SAM significantly downmodulated at one time (rhoI was downmodulated in the 98 hpi data set), is light green.
on November 8, 2019 by guest
http://jvi.asm.org/
[image:11.603.52.532.69.273.2]tion of arf6, which is involved with macropinocytosis at the cell periphery, as well as in cell migration and wound healing through activation of rac1 (27), may therefore have negative effects not only on endocytic pathways but also on cell shape and motility. This alteration was consistent with the observed negative impact of infection on the expression of several actin cytoskeleton-related genes (Fig. 2). Transcript expression lev-els of 20 of the 60 (33%) known human rab family members were altered during infection: 13 (rab1a, -1b, -2a, -3a, -6a, -7, -13, -18, -21, -23, -31, -34, and -40b) were consistently down-modulated, and seven (ray/rab1C and rab2L, -8, -20, -27a, -32, and -38) were upmodulated by infection. These data showed a strong impact of CMV infection on this essential family of vesicle traffic regulators, suggesting a possible role for several rabs in the final steps of virion morphogenesis and egress. The apparent negative impact on rab7 (important for endosome transport and phagosome maturation) (30, 45), rab18 (in-volved in apical endocytosis and recycling) (63), and rab34 (required for efficient macropinocytosis) (92) suggested global inhibition of the endocytic process. This hypothesis was sup-ported by the consistent downmodulation of arf6 (see above) and by the expression pattern of five genes encoding interac-tors of rab5, an essential regulator of membrane traffic kinetics in the early endocytic pathway (17) (see information file S6, GTPases, class Rab family, in the supplemental material). Four of these genes were consistently downmodulated and encoded proteins involved either in signal transmission from the active rab5 to the membrane docking apparatus (rabap-tin-5, rabex-5, and RIN2) or in endosome fusion (early endo-some antigen 1). Interestingly, the fifth and only upmodulated gene encoded the rab5 interactor tuberin, whose main function is to negatively regulate rab5 activity in endocytosis (109). Transport mechanisms involving the Golgi apparatus also seemed to be negatively affected, based on the downmodula-tion of arl1 (see above) and of rab1a, rab1b, rab2a, and rab6a, which are required to form and maintain normal Golgi cister-nae and to regulate standard and retrograde transport between the endoplasmic reticulum (ER) and the Golgi body (64, 95, 108).
Three of the six consistently upmodulated rabs transcripts encode proteins involved in melanosome transport and mor-phogenesis (rab8a, rab38, and rab27a). Although rab38 is nec-essary to target the melanin biosynthesis enzyme tyrp1 to end-stage melanosomes (60), rab8 plays a role in melanosome trafficking (20) and rab27a is required for the recruitment of myosin Va to melanosomes, which then stimulates the micro-tubule-mediated transport of melanosomes to the tips of den-drites in melanocytes and their transfer to adjacent keratino-cytes (48). Since fibroblasts do not possess melanosomes, it is tempting to speculate that the observed transcriptional up-modulation of these genes might be part of a virus-controlled strategy to promote its maturation and release through the specific vesicle traffic mechanisms active in melanocytes.
Lastly, the downmodulation of rab13, a structural and func-tional regulator of tight junctions (65), was in optimal agree-ment with our results pointing to cell rounding, whereas the upmodulation of rab32, which participates in synchronizing the mitochondrial fission process (5), was particularly interesting in connection with the observed disruption of the reticular mitochondrial network in CMV-infected HFs (66). Altogether,
these data are the first to highlight GTPases and related genes as major targets of transcriptional modulation at late times during CMV infection.
Nuclear DNA-encoded mitochondrial genes. The enzyme
category had the most broadly upmodulated transcript levels (Fig. 1 and 4). The 146 genes in this category were assigned to one of five classes, with 55 genes (38%) encoding mitochon-drial functions, 39 genes (27%) associated with carbohydrate metabolism, 11 genes (7%) involved in detoxification, 8 genes (5%) participating in the synthesis and/or utilization of gluta-thione, and 33 genes (23%) representing miscellaneous en-zymes. Mitochondrial functions stood out as being the largest class in this category and had a remarkably high proportion of upmodulated genes (91%). Fifty-one genes from this class and two genes from the carbohydrate metabolism class were as-sembled in a map depicting the mitochondrial oxidative phos-phorylation (oxphos) and the related biochemical pathways involved in oxidation of fatty acids (-oxidation cycle), catab-olism of amino acids, and transport of NADH, acetyl coen-zyme A (CoA), and ATP (Fig. 4). Strikingly, all 24 genes encoding components of the electron transport chain com-plexes I to IV, representing one-third of the known electron transport chain subunits, were upmodulated by infection. Half of the 18 genes that are part of the ATP synthase complex and 8 genes involved in the assembly, biosynthesis, or activity reg-ulation of specific components of the oxphos (coenzyme Q7 [COQ7], cytochrome csynthase, ATPase inhibitory factor 1, chaperone ABC1, F1 complex assembly factor 1 and 2, and cytochromecoxidase 15 [COX15] and COX17) were consis-tently upmodulated during infection. Altogether, these data revealed a very strong positive effect of CMV infection on the expression levels of multiple genes related to ATP synthesis, which has not been observed previously. This impact likely results in enhanced energy production that benefits infection. Transcripts for four (short and medium chain acyl-CoA dehy-drogenases, 3-ketoacyl-CoA thiolase, and 3-hydroxyacyl-CoA dehydrogenase) of the six standard enzymes in the-oxidation cycle and one (enoyl-CoA isomerase) of the three auxiliary enzymes involved in the oxidation of unsaturated fatty acids were also upmodulated. Interestingly, the only downmodulat-ed enzyme in the-oxidation cycle was the short chain enoyl-CoA hydratase, which reverses the direction of the cycle by catalyzing the opposite reaction of the long chain enoyl-CoA hydratase. Both the electron transfer flavoprotein (ETFP), which transfers the electrons generated by the -oxidation cycle to complex II of the oxphos system, and the glutaryl-CoA dehydrogenase, which transfers electrons generated from the degradation of the amino acids lysine, hydroxylysine, and tryp-tophan to the ETFP, were upmodulated. These findings dem-onstrated that the entire mitochondrial system involved in res-piration, as well as the degradation of fatty acids and the utilization of amino acid catabolism products, was consistently upmodulated at late times of infection, eventually leading to an increased exploitation of the fatty acid deposits of the cell in order to produce ATP. Further support for this hypothesis was provided by the consistent downmodulation of the key medi-ators of the fatty acid neosynthetic pathway (citrate synthase, citrate transporter, and ATP citrate lyase), which use the acetyl-CoA produced by the-oxidation cycle to store energy for later use instead of synthesizing ATP for immediate
on November 8, 2019 by guest
http://jvi.asm.org/
sumption. Expression levels of nine genes belonging to four transport systems, one importing NADH from the cytosol and three exporting ATP from the inner mitochondrial matrix, were also modified by infection. The cytoplasmic and mitochon-drial isoforms of glutamate oxaloacetate (GOT1 and GOT2, respectively) and the mitochondrial malate dehydrogenase (part of the NADH transport system), the fibroblast isoform of adenine nucleotide translocator (ANT2), and the ubiquitous isoform of creatine kinase (part of the ATP transport system) were upmodulated, whereas liver ANT3 and sarcomeric crea-tine kinase were downmodulated. VDAC1, which forms volt-age-gated pores in the outer mitochondrial membrane to allow diffusion of small hydrophilic molecules and adenine nucleo-tides in normal situations and of cytochromecduring apo-ptosis was also downmodulated, whereas the low-abundance VDAC2 isoform that inhibits mitochondrion-mediated apo-ptosis when overexpressed (22) was upmodulated. Taken together, these data show that the vast majority of the genes composing the two main mitochondrial energy production sys-tems and their associated substrate import and product export mechanisms were consistently upmodulated. In contrast, the genes mediating the first three steps of the pathway leading to
the reconstitution of the fatty acids pools were downmodu-lated. These findings indicate that increased mitochondrial en-ergy production is important at late times during CMV infec-tion and suggest that fatty acid catabolism may dominate over neosynthesis, leading to the depletion of cellular fat stores dur-ing infection.
CMV infection has been shown to increase the mitochon-drial size (71), to disrupt the reticular mitochonmitochon-drial networks (66), to interfere with the mitochondrial proapoptotic path-ways (40, 41, 66, 87), and to stimulate mitochondrial DNA synthesis (37). Our results reveal that CMV infection dramat-ically and coordinately induces the expression of most mito-chondrial ATP-production system components, possibly result-ing in the intensification of high-energy phosphate production in order to sustain elevated energy demands of viral replica-tion.
Cell cycle- and cellular DNA replication-related genes.
[image:13.603.55.542.70.364.2]Con-sistent with data in the literature (10, 32, 34, 52, 83, 107), both cell cycle and nucleic acid metabolism categories were strongly and positively affected by infection (Fig. 1 and 5). The func-tional genomics approach used here allowed us not only to expand the number of known cell cycle- and cellular DNA
FIG. 4. GenMAPP of virus-induced gene expression changes affecting the mitochondrial oxphos, fatty acid -oxidation, malate-aspartate transport, ATP transport, and citrate transport systems. The oxphos system is depicted in five large boxes showing subunits (sub; small boxes) of complexes I to IV and ATP synthase. The dashed parallel lines to the left and right of the large boxes represent the mitochondrial inner membrane. The map also includes a gene from the amino acid metabolism category (glutaryl-CoA dehydrogenase), three genes from the vesicle and intracellular transport category (citrate transporter and the voltage-dependent anion channel 1 [VDAC1] and 2 [VDAC2]) and seven genes from the lipid metabolism category (short and medium chain acyl-CoA dehydrogenase, enoyl-CoA isomerase, short chain enoyl-CoA hydratase, 3-hydroxyacyl-CoA dehydrogenase, 3-ketoacyl-CoA thiolase, and ATP citrate lyase). The same scheme as shown in Fig. 2 is used. TCA, tricarboxylic acid cycle; catab, catabolism; synth, synthesis. In complex I, Chain 1//6 contains chains 1, 2, 3, 4, 4L, 5, and 6; B14.5A//18 Sub contains the B14.5A, B14.5B, B15, B17, B17.2, and B18 subunits; 9//24 kDa Sub contains the 9, 9.6, 13A, 13B, 15, 18, 19, 20, 23, and 24 kDa subunits; and 14//75 Sub contains the 14, 51, and 75 kDa subunits. In Complex IV, COX1//4 contains COX1, -2, -3, and -4.
on November 8, 2019 by guest
http://jvi.asm.org/
replication-related genes upmodulated by CMV but also to gain a better understanding of how these functions may be linked and have a concerted impact on the cell. The 113 genes in the cell cycle category were assigned to one of five classes, with 42 genes (37%) associated with the G2/M phase, 27 genes
(24%) involved in general growth control, 19 genes (17%) associated with the G1or G1/S phases, 13 genes (11%)
asso-ciated with the S phase, and 12 genes (11%) related to p53 or pRb activities. The 229 genes in the nucleic acid metabolism category were divided into three classes: RNA metabolism (103 genes, 45%), DNA metabolism (101 genes, 44%), and
nucleotide metabolism (25 genes, 11%). In the cell cycle cat-egory, the S-phase class contained the highest percentage of upmodulated genes (85%), followed by the p53-pRb-related class (75%) and the G2/M phase class (64%). In the nucleic
[image:14.603.57.525.85.530.2]acid metabolism category, the DNA metabolism class stood out as having the largest percentage of upmodulated genes (66%), followed by the mostly downmodulated nucleotide me-tabolism (42% upregulated) and RNA meme-tabolism (38% up-regulated) classes. These data revealed a very strong positive effect of CMV infection on the expression of multiple S-phase, G2/M-phase, and DNA activity regulators, probably all of
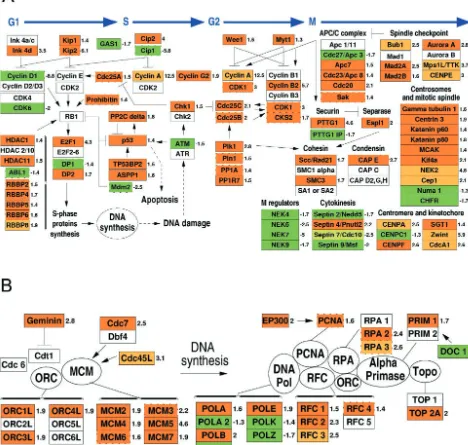
FIG. 5. GenMAPP of virus-induced gene expression changes affecting cell cycle and DNA synthesis. (A) Cell cycle phases G1, S, G2, and M
are depicted by blue arrows, with genes modulated by infection listed underneath. (B) DNA synthesis functions in the prereplication complex (left) and replication fork machinery (right) regulated by infection. The same scheme as shown in Fig. 2 is used with the addition of inhibitory relationships denoted by a⬜. Ink 4 a/c contains ink a, b, and c; HDAC 2/10 contains the histone deacetylases 1, 2, 3, 4, 5, 6, 7A, 8, 9, and 10; E2F 2/6 contains E2F 2, 3, 4, 5, and 6; and Apc 1/11 contains apc 1, 2, 4, 5, 6, 7, 10, and 11.
on November 8, 2019 by guest
http://jvi.asm.org/
which are required for efficient viral replication. Interestingly, DNA and RNA metabolism gene transcript levels were af-fected in opposite ways by viral infection, suggesting that genes involved in DNA metabolism might be preferentially tran-scribed during viral infection. A total of 112 genes from both categories were organized into the maps shown in Fig. 5A and B, which depict cell cycle control and DNA synthesis functions, respectively. A total of 78% of the genes present on the maps and altered by infection were upmodulated. Expression levels of several G1/S- and S-phase regulators were modified by
in-fection: while both cyclin D1 and the associated cyclin-depen-dent kinase 6 (CDK6) were strongly downmodulated, the G1
and S cyclin-CDK complex inhibitors ink4d, kip1, kip2