Statistical
First Release
Initial teacher training census for the academic year 2013/14
INTRODUCTION
This Statistical First Release (SFR) provides provisional figures on the number of new entrants who have started, or expect to start, an initial teacher training programme in England in the academic year 2013/14. The figures are presented at sector level, broken down by the subject being trained to teach and the training route. The figures include the estimates of the required number of new entrants (referred to as targets in this document and the data tables), which are based on the Department for Education’s, Teacher Supply Model.
Additional tables include the proportion of new entrants on postgraduate training programmes holding a first class or 2:1 classified UK degree, together with gender, ethnicity and age breakdowns of all new entrants. The SFR also includes an update to the provisional figures for the academic year 2012/13, published in November 2012.
KEY STATISTICS
This section provides an overview of the key statistics on new entrants to initial teacher training in the academic year 2013/14. It is based on data about 32,470 actual new entrants on a training programme on the census date (2nd Wednesday in October 2013) and a forecast of 640 new
entrants expected to start a training programme in this academic year. The provisional data will be updated at the end of the academic year and published as final statistics in November 2014.
The total number of new entrants who have started, or expect to start, a primary or secondary initial teacher training programme in the academic year 2013/14 is 33,110 (96 per cent of the target).
The number of new entrants who have started, or expect to start, a primary programme is 19,820 (96 per cent of the target), and is made up of 14,280 trainees on postgraduate programmes (101 per cent of the target) and 5,530 trainees on undergraduate programmes (85 per cent of the target).
The number of new entrants who have started, or expect to start, a secondary programme is 13,300 (96 per cent of the target), and is made up of 12,980 trainees on postgraduate programmes (97 per cent of the target) and 310 trainees on undergraduate programmes (62 per cent of the target).
SFR 49/2013 26 November 2013 Coverage: England Theme: Teacher
training
Issued by
Department for Education Sanctuary Buildings Great Smith Street London SW1P 3BT
Telephone: Press Office
020 7925 6789
Public Enquiries
0370 000 2288
There are 26,530 new entrants on Provider led programmes and 6,580 new entrants on the new School Direct programmes.
The proportion of postgraduate new entrants with a first class or 2:1 classified UK degree is 74 per cent, compared with 71 per cent in 2012/13 and 66 per cent in 2011/12.
The proportion of males starting primary programmes is 21 per cent compared with 20 per cent in 2012/13 and 19 per cent in 2011/12.
The proportion of black and minority ethnic trainees starting programmes is 12 per cent compared with 13 per cent in 2012/13 and 12 per cent in 2011/12.
DETAILED STATISTICS
Table A1 in the main tables
New entrants and forecast new entrants to initial teacher training in 2013/14
The provisional number of new entrants in 2013/14 is 33,110 and this represents 96 per cent of the target for required places (34,470). The figure for new entrants is made up of 32,470 actual new entrants on a programme at the census date (2nd Wednesday in October) and a forecast of 640 new entrants expected to start later in the academic year.
New entrants to primary programmes totalled 19,820 (including 300 forecast new entrants) and contribute to 96 per cent of the target for required places. Primary figures are made up of 14,280 entrants (101 per cent of the target) on postgraduate programmes and 5,530 entrants (85 per cent of the target) on undergraduate programmes.
New entrants to secondary programmes totalled 13,300 (including 340 forecast new entrants) and contribute to 96 per cent of the target for required places). Secondary initial teacher training programmes are predominantly postgraduate, and there are 12,980 entrants to postgraduate programmes (97 per cent of the target) and 310 entrants to undergraduate programmes (62 per cent of the target).
As in previous years there were wide variations across the secondary subjects being trained to teach, and the numbers of new entrants to English, chemistry, history and physical education programmes exceeded the targets (128, 127, 143 and 126 per cent respectively).
The numbers of new entrants to geography, art and music programmes were very close to their respective targets (99, 98 and 98 per cent respectively).
Numbers of new entrants to mathematics programmes were 90 per cent of the target, and to biology and physics (including physics with mathematics) programmes, 95 and 72 per cent of their respective targets.
The numbers of new entrants to business studies, modern and ancient languages and religious education programmes were 87, 83 and 80 per cent of their respective targets.
Numbers of new entrants to design and technology and the new subject of computer science were significantly below target at 48 and 57 per cent respectively.
(Fee) programmes and 2,310 on School Direct (Salary) programmes. Table A2 in the main tables
Percentage of new entrants to postgraduate programmes with first class or 2:1 classified UK degrees1
The classification of the UK degree held by new entrants to postgraduate programmes is used as one measure of the quality of the new entrants. UK Degree classifications are used to make in year comparison across training routes and subjects, as well as year on year comparisons.
Overall, 74 per cent of new entrants with UK degrees on postgraduate programmes held a first class or 2:1 classified degree. This is an increase of three percentage points compared with new entrants in 2012/13 and an increase of eight percentage points compared with new entrants in 2011/12.
Figure 1 (below) shows the full breakdown of UK degrees held by new entrants in the last five years. The data shows a year on year increase, since 2010/11, in the proportion of first class degrees and 2:1 classified degrees and a corresponding decrease in the proportion of 2:2, 3rd class and other classified degrees.
Figure 1: Full breakdown by classification UK degrees held by new entrants to postgraduate programmes over five years
Year
Classification of UK degree
1st 2:1 2:2 3rd other
2009/10 10% 51% 30% 3% 6%
2010/11 10% 52% 30% 3% 5%
2011/12 12% 54% 28% 1% 4%
2012/13 14% 57% 26% 1% 2%
2013/14 (provisional) 16% 58% 24% 1% 2%
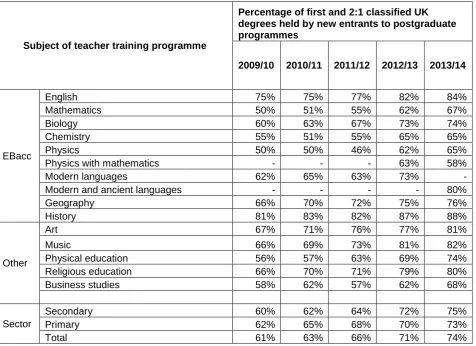
Further breakdowns by phase, subject and route are included in table A2 in the data tables. Of those new entrants to primary postgraduate programmes, 73 per cent held a first class or 2:1 classified UK degree. This is an increase of three percentage points compared with new entrants in 2012/13 and five percentage points compared with new entrants in 2011/12 (Figure 2).
Of those new entrants to secondary programmes, 75 per cent held a first class or 2:1 classified UK degree. This is an increase of three percentage points compared with new entrants in 2012/13 and eleven percentage points compared with new entrants in 2011/12 (Figure 2).
Table A2 shows a variation in the proportion of first class and 2:1 classified degrees held by new entrants to secondary programmes when broken down by subject (note: the table refers to the subject being trained to teach and not subject of the degree held).
New entrants to history programmes held the highest proportion of first class or 2:1 classified degrees (88 per cent) and new entrants to physics with mathematics programmes held the lowest proportion (58 per cent).
Figure 2 (below) shows a five-year breakdown by key subjects. With the exception of physics with
1
mathematics (for which we only have two years of data), all subjects show significant improvements over time in the proportion of new entrants with first class or 2:1 classified UK degrees.
Figure 2: Breakdown by subject and phase of training, of the percentage of new entrants with first class and 2:1 classified UK degrees
Subject of teacher training programme
Percentage of first and 2:1 classified UK degrees held by new entrants to postgraduate programmes
2009/10 2010/11 2011/12 2012/13 2013/14
EBacc
English 75% 75% 77% 82% 84%
Mathematics 50% 51% 55% 62% 67%
Biology 60% 63% 67% 73% 74%
Chemistry 55% 51% 55% 65% 65%
Physics 50% 50% 46% 62% 65%
Physics with mathematics - - - 63% 58%
Modern languages 62% 65% 63% 73% -
Modern and ancient languages - - - - 80%
Geography 66% 70% 72% 75% 76%
History 81% 83% 82% 87% 88%
Other
Art 67% 71% 76% 77% 81%
Music 66% 69% 73% 81% 82%
Physical education 56% 57% 63% 69% 74%
Religious education 66% 70% 71% 79% 80%
Business studies 58% 62% 57% 62% 68%
Sector
Secondary 60% 62% 64% 72% 75%
Primary 62% 65% 68% 70% 73%
Total 61% 63% 66% 71% 74%
Table A2 also includes a further breakdown by training route of UK degree class (percentage of first class and 2:1 classified degrees) of new entrants.
Overall, new entrants on a School Direct (Fee) route hold the highest percentage of first class and 2:1 classified UK degrees (76 per cent) compared with those on a Provider led route (74 per cent) and those on a School Direct (Salary) route (68 per cent2). A breakdown by phase shows a similar ranking for primary and secondary.
There were variations between the secondary subjects, when comparing Provider led with School Direct (Fee) routes3.
2
The age breakdown of new entrants to School Direct (Salary) routes (table A5 in the data tables) may explain the lower proportion of new entrants with first class or 2:1 classified UK degrees because of the effect of grade inflation over time.
3
Only subjects with differences of more than two percentage points in the percentage of first class and 2:1 classified UK degrees are being listed, because of the possible rounding effects on the published
[image:4.595.59.536.158.504.2]Provider led routes have a higher proportion of new entrants, with first class and 2:1 classified UK degrees, training to teach the following subjects:
English (87 per cent compared with 82 per cent)
Modern and ancient languages (79 per cent compared with 73 per cent) History (91 per cent compared with 87 per cent)
Art (84 per cent compared with 72 per cent)
Physical education (79 per cent compared with 70 per cent) Religious education (81 per cent compared with 77 per cent)
School Direct (Fee) routes have a higher proportion of new entrants, with first class and 2:1 classified UK degrees, training to teach the following subjects:
Science (70 per cent compared with 67 per cent) Chemistry (71 per cent compared with 63 per cent);
Computer science (80 per cent compared with 68 per cent); Design and technology (75 per cent compared with 61 per cent); Music (89 per cent compared with 80 per cent); and
Business studies (74 per cent compared with 67 per cent). Gender breakdown of new entrants (table A3 in the main tables)
The gender breakdown of new entrants is included in table A3 in the main tables. The proportion of male new entrants to primary programmes is 21 per cent, an increase of one percentage point compared with new entrants in 2012/13 and a continuation of similar increases in previous years. There is a higher percentage of male new entrants to primary School Direct (Salary) routes (28 per cent) compared with School Direct (Fee) routes (25 per cent) and Provider led routes (20 per cent). There was much less variation in the gender breakdown of new entrants to secondary programmes although the ranking is similar: School Direct (Salary) routes (40 per cent male); Provider led routes (38 per cent male); and School Direct (Fee) routes (37 per cent male).
Ethnicity breakdown of new entrants (table A4 in the main tables)
The ethnicity profile of new entrants is included in table A4 of the main tables. The proportion of black and minority ethnic new entrants is 12 per cent overall with a small variation across the routes.
The 12 per cent figure has remained broadly static over time (13 per cent in 2012/13 and 12 per cent 2011/12 and 2010/11).
Age breakdown of new entrants (table A5 in the main tables)
Update to the provisional figures for 2012/13 published in November 2012 (table A6 in the main tables)
Table A6 in the main tables is an update to the provisional data published in November 2012. In July 2013, all mainstream providers were invited to update the forecasts they made in their census submission. The EBITT (employment-based routes initial teacher routes) forecasts made by the NCTL recruitment division were also updated. The update is based on actual trainee level data from universities submitted via HESA (Higher Education Statistics Agency) and from employment-based route providers using the NCTL data management system.
The provisional data published in November 2012 included 620 forecast new entrants to primary mainstream programmes and 640 forecast new entrants to secondary mainstream programmes. These were replaced with 440 and 390 post census new entrants respectively.
Forecast new entrants to EBITT programmes totalled 620, and these were replaced with 550 post census new entrants.
The net effect was to reduce the number of primary new entrants in 2012/13 to 98 per cent of target, from 100 per cent; and increase the number of secondary new entrants to 107 per cent of target, from 105 per cent of target.
Index of main tables
Table A1: Provisional data on initial teacher training new entrants (including forecast new entrants) and training places (targets) by route and subject specialism in the academic year 2013/14.
Table A2: Provisional data on initial teacher training showing the percentage of new entrants with first class or 2:1 classified UK degrees in the academic year 2013/14.
Table A3: Provisional data on initial teacher training showing the gender breakdown of new entrants in the academic year 2013/14.
Table A4: Provisional data on initial teacher training showing the ethnicity breakdown of new entrants in the academic year 2013/14.
Table A5: Provisional data on initial teacher training showing the age breakdown of new entrants in the academic year 2013/14.
TECHNICAL NOTES
Background
The National College for Teaching and Leadership (formerly the Training and Development Agency (TDA) for Schools and the Teacher Training Agency (TTA)) has published the initial teacher training census annually since 1998.
Data Quality and Uses of Data
The aggregated data published in the census are based on trainee level data submitted by training providers. The data are used to inform recruitment and assure funding.
Methodology
Data from universities are collected via the Higher Education Statistics Agency (HESA) under a long-standing data sharing agreement. HESA supply an extract from their Initial Teacher Training In-Year record to populate the census.
The data from non-university providers of initial teacher training are collected directly using bespoke online systems managed by the NCTL.
Data are collected at trainee level and are aggregated for this publication. The data published are provisional and include the number of new entrants on programme at the census data (2nd
Wednesday in October) and a forecast of the number of new entrants expected to start a teacher training programme in the current academic year.
Confidentiality
Data are anonimised, aggregated and rounded to ensure that individual trainees cannot be identified.
Related Publications
The Department for Education also publish statistics about the outcomes of initial teacher training programmes in England.
Link to performance profiles 2013
Queries
Any queries or comments on the statistics in this publication should be addressed to: Martin Furner
National College for Teaching and Leadership Department for Education
Sanctuary Buildings
Great Smith Street, London SW1P 3BT
Telephone number: 020 7227 5381
Press enquiries should be made to the Department’s Press Office at: Press Office News Desk
Department for Education Sanctuary Buildings
Great Smith Street, London SW1P 3BT